
Wildlife conservation / aerial survey analysis
Wildlife Survey Geospatial Dashboard & Bird Distribution Map
Overview
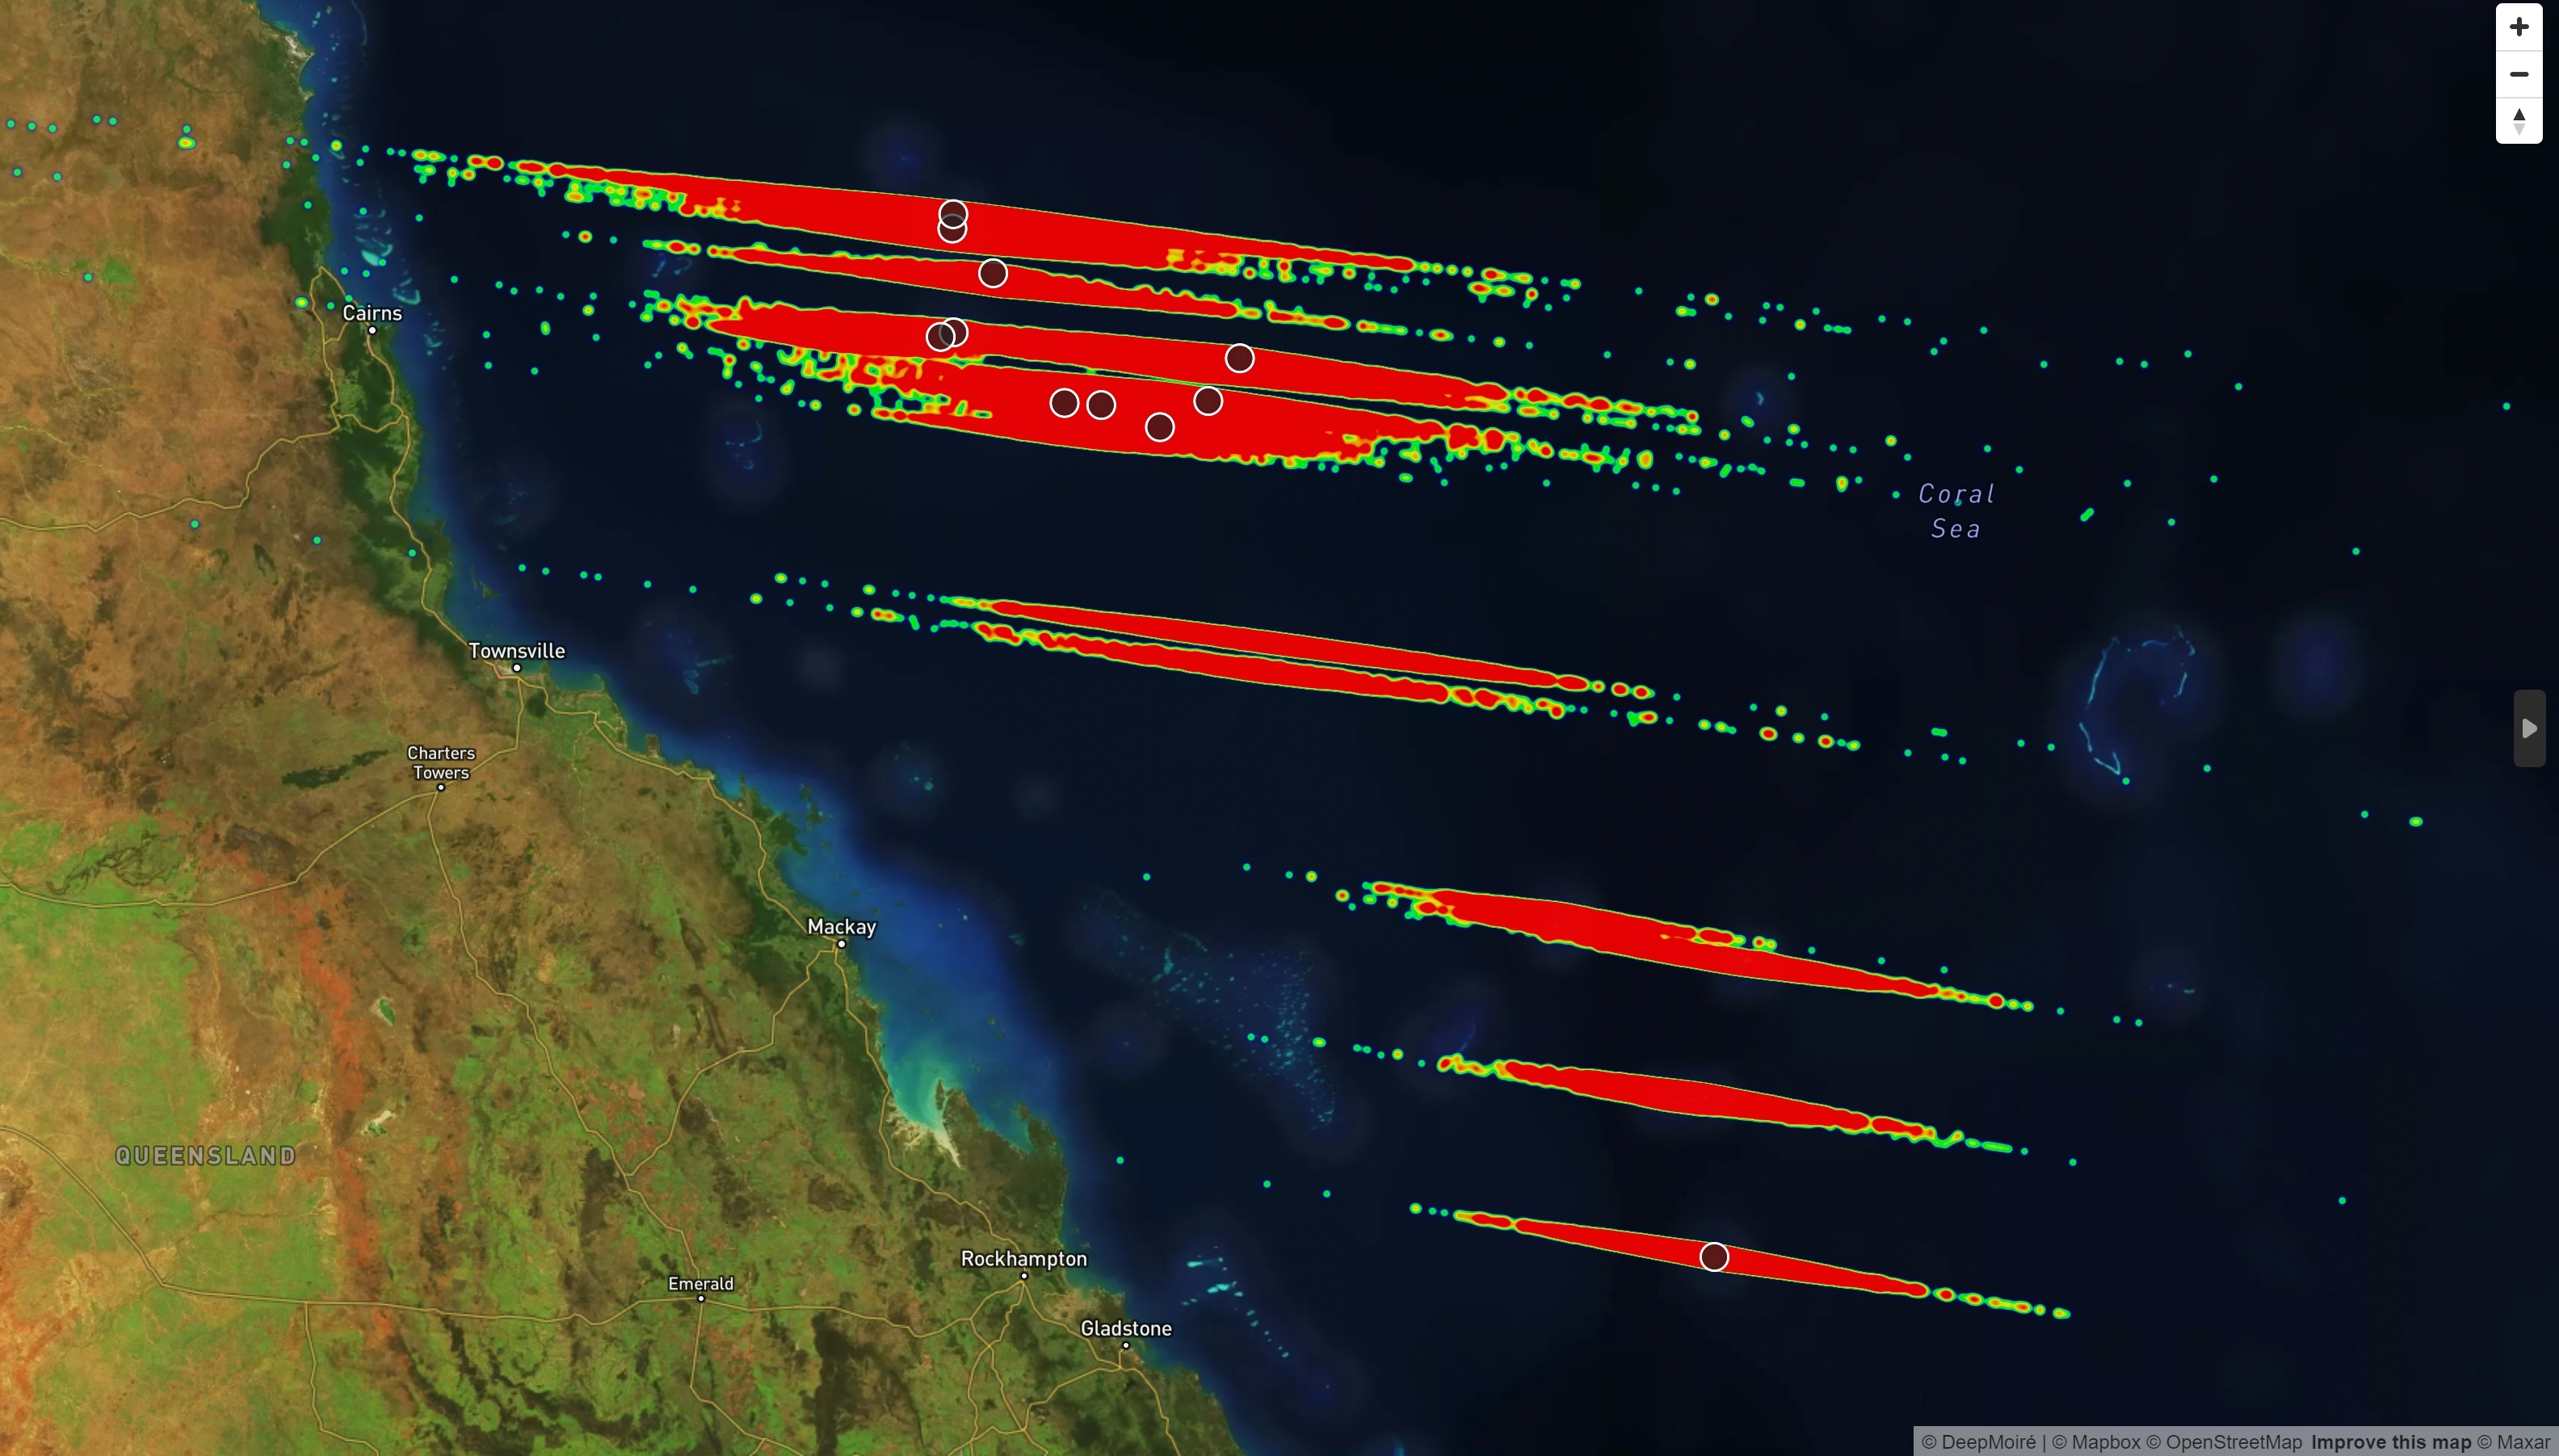
This project transformed aerial bird-survey data from remote tropical islands into an interactive geospatial dashboard for a conservation report. The final application combined population totals, species composition, spatial density, and human-versus-AI observation comparisons, allowing more than 33,000 individual observations across 12 surveyed islands to be explored through an interactive map, filters, and statistical charts.
Challenge
Each survey record represented an individual bird observation with geographic information and classification attributes including bird group, species or subspecies, and observer type. The application had to connect two analytical scales: regional comparison of population totals between islands and detailed spatial analysis of observation density within each island. It also needed to support comparison between human-generated and AI-generated classifications while remaining reusable as new survey data became available.
Solution
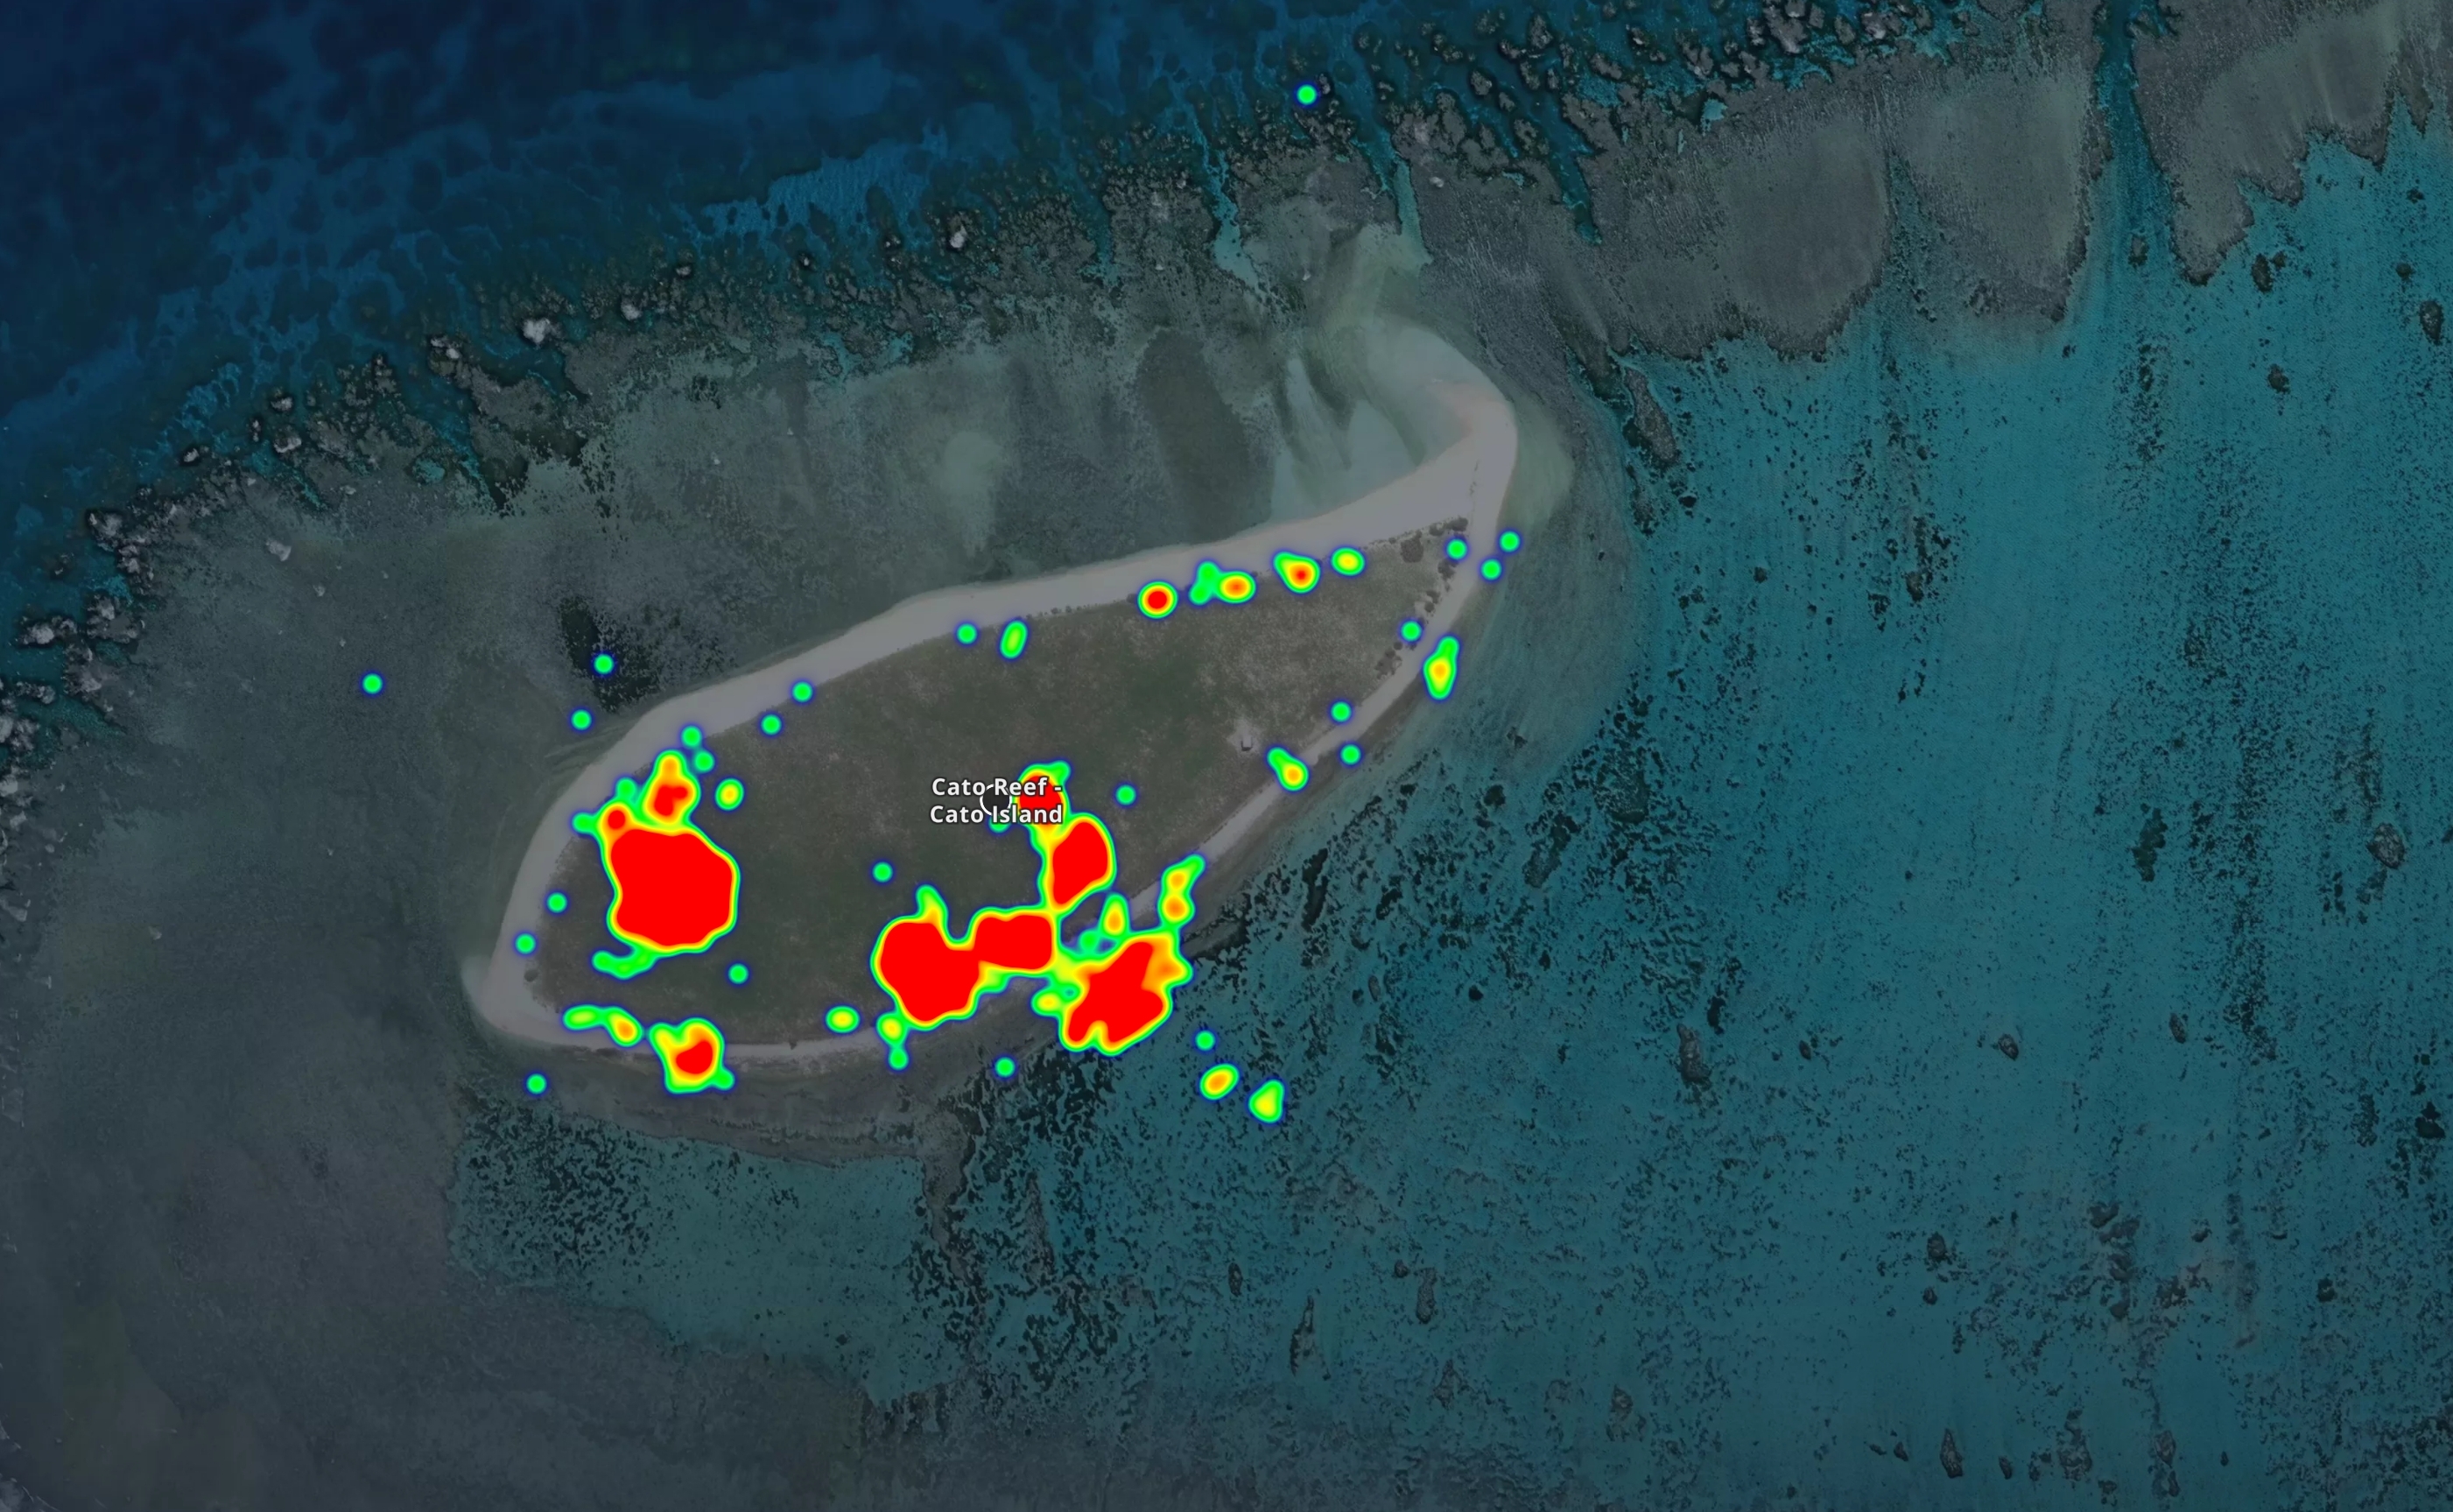
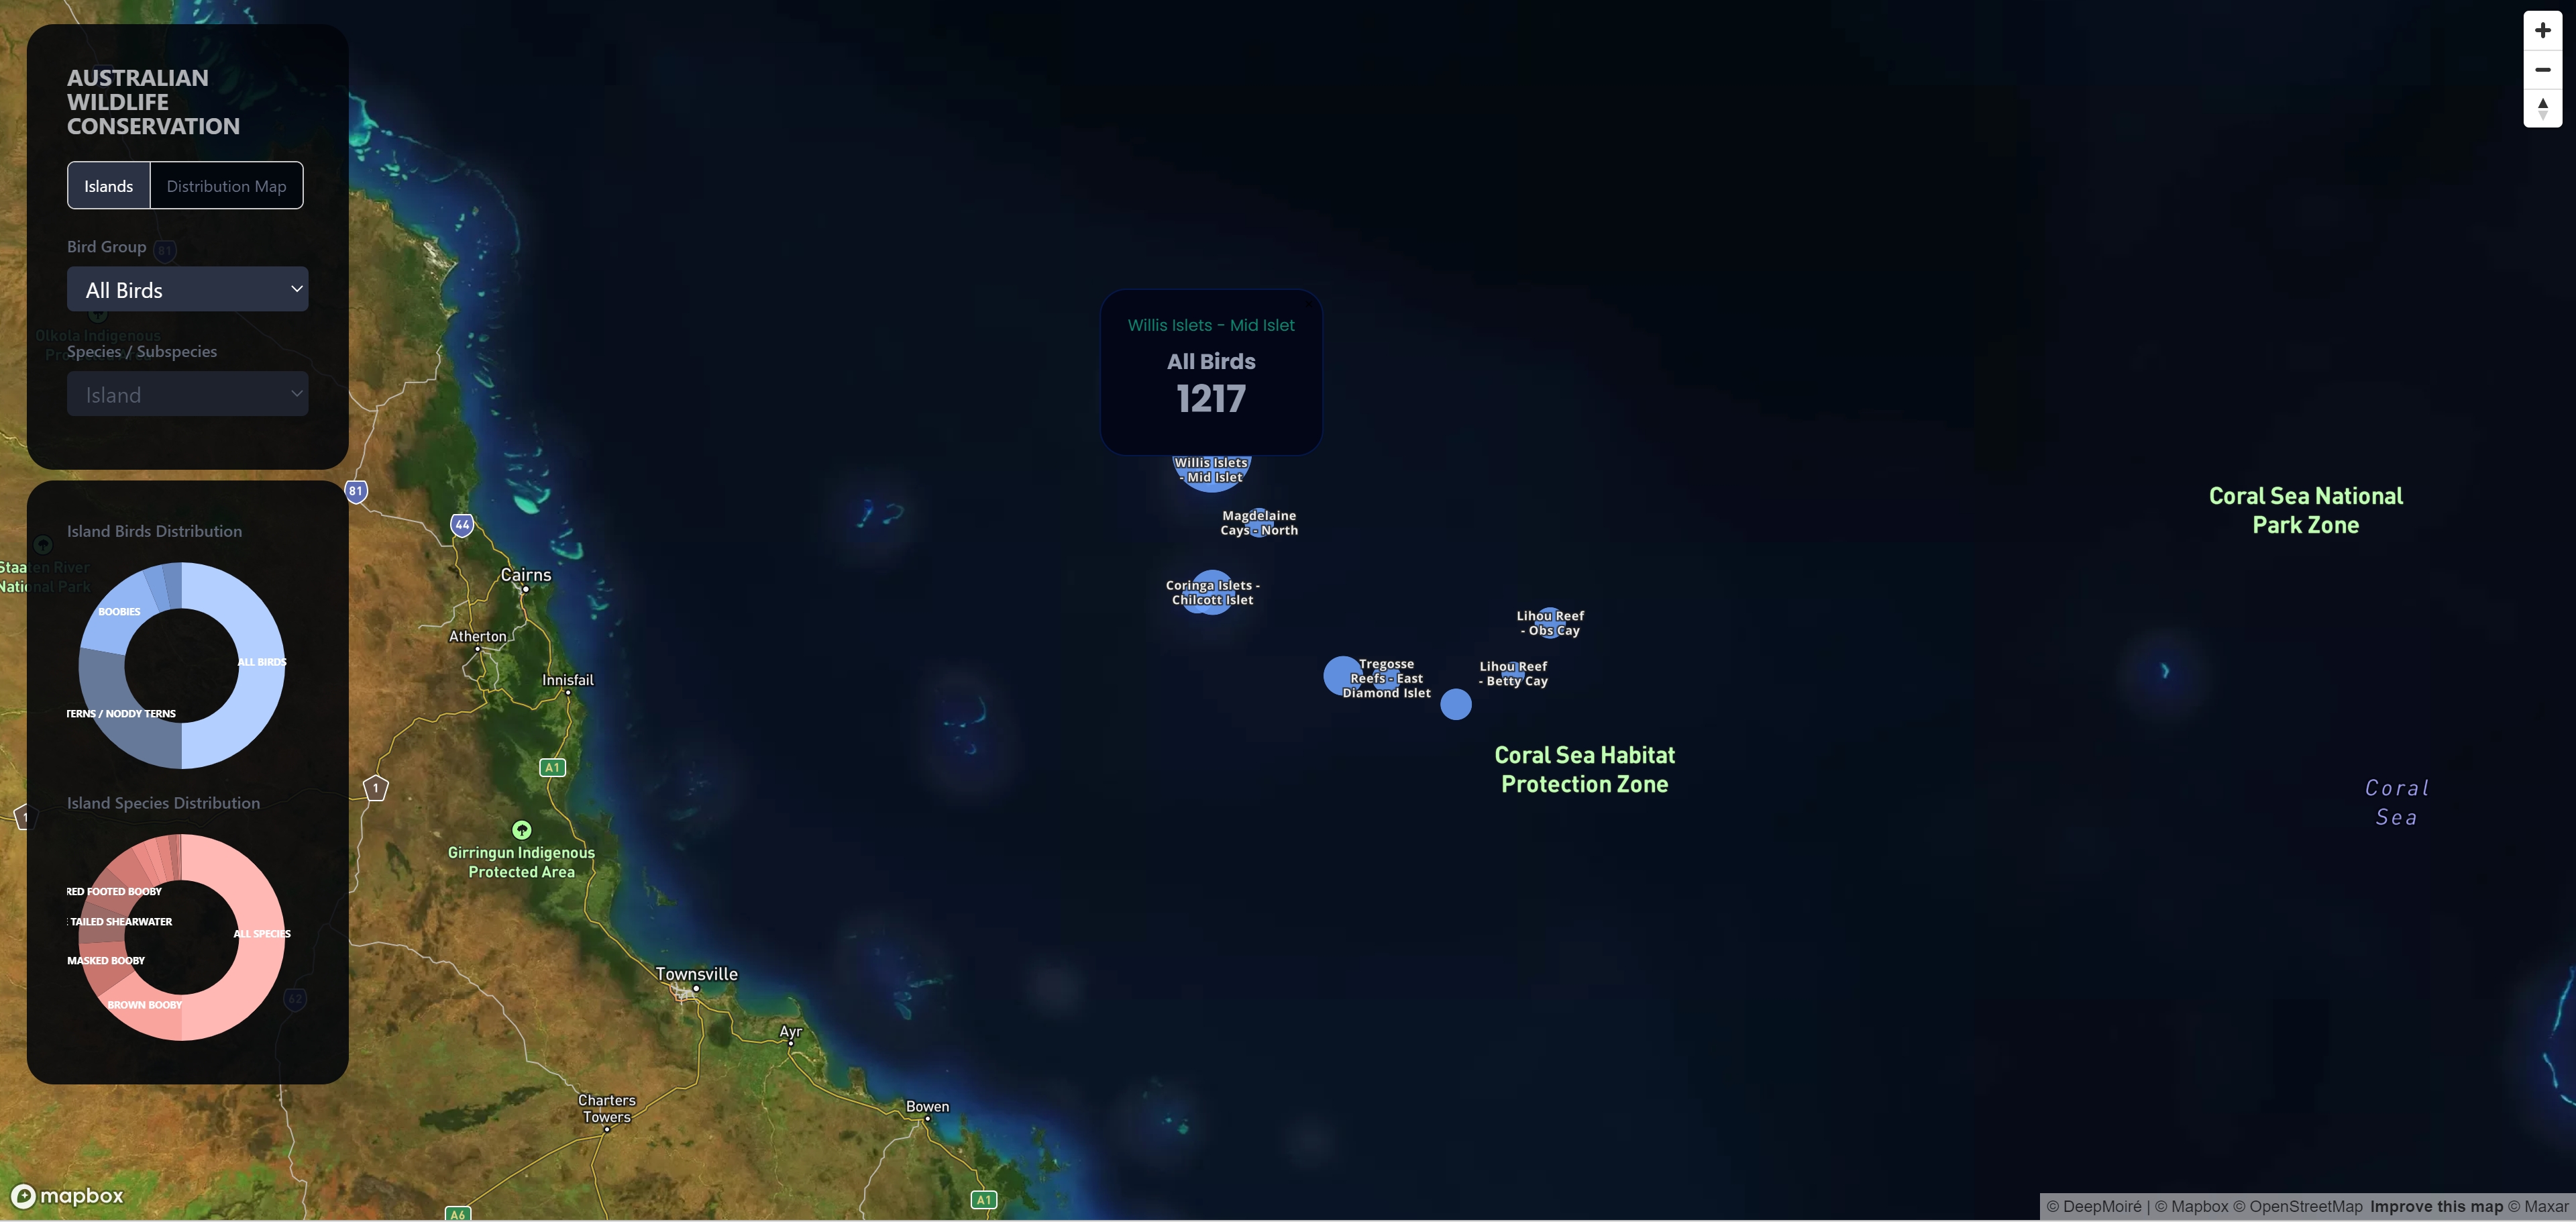
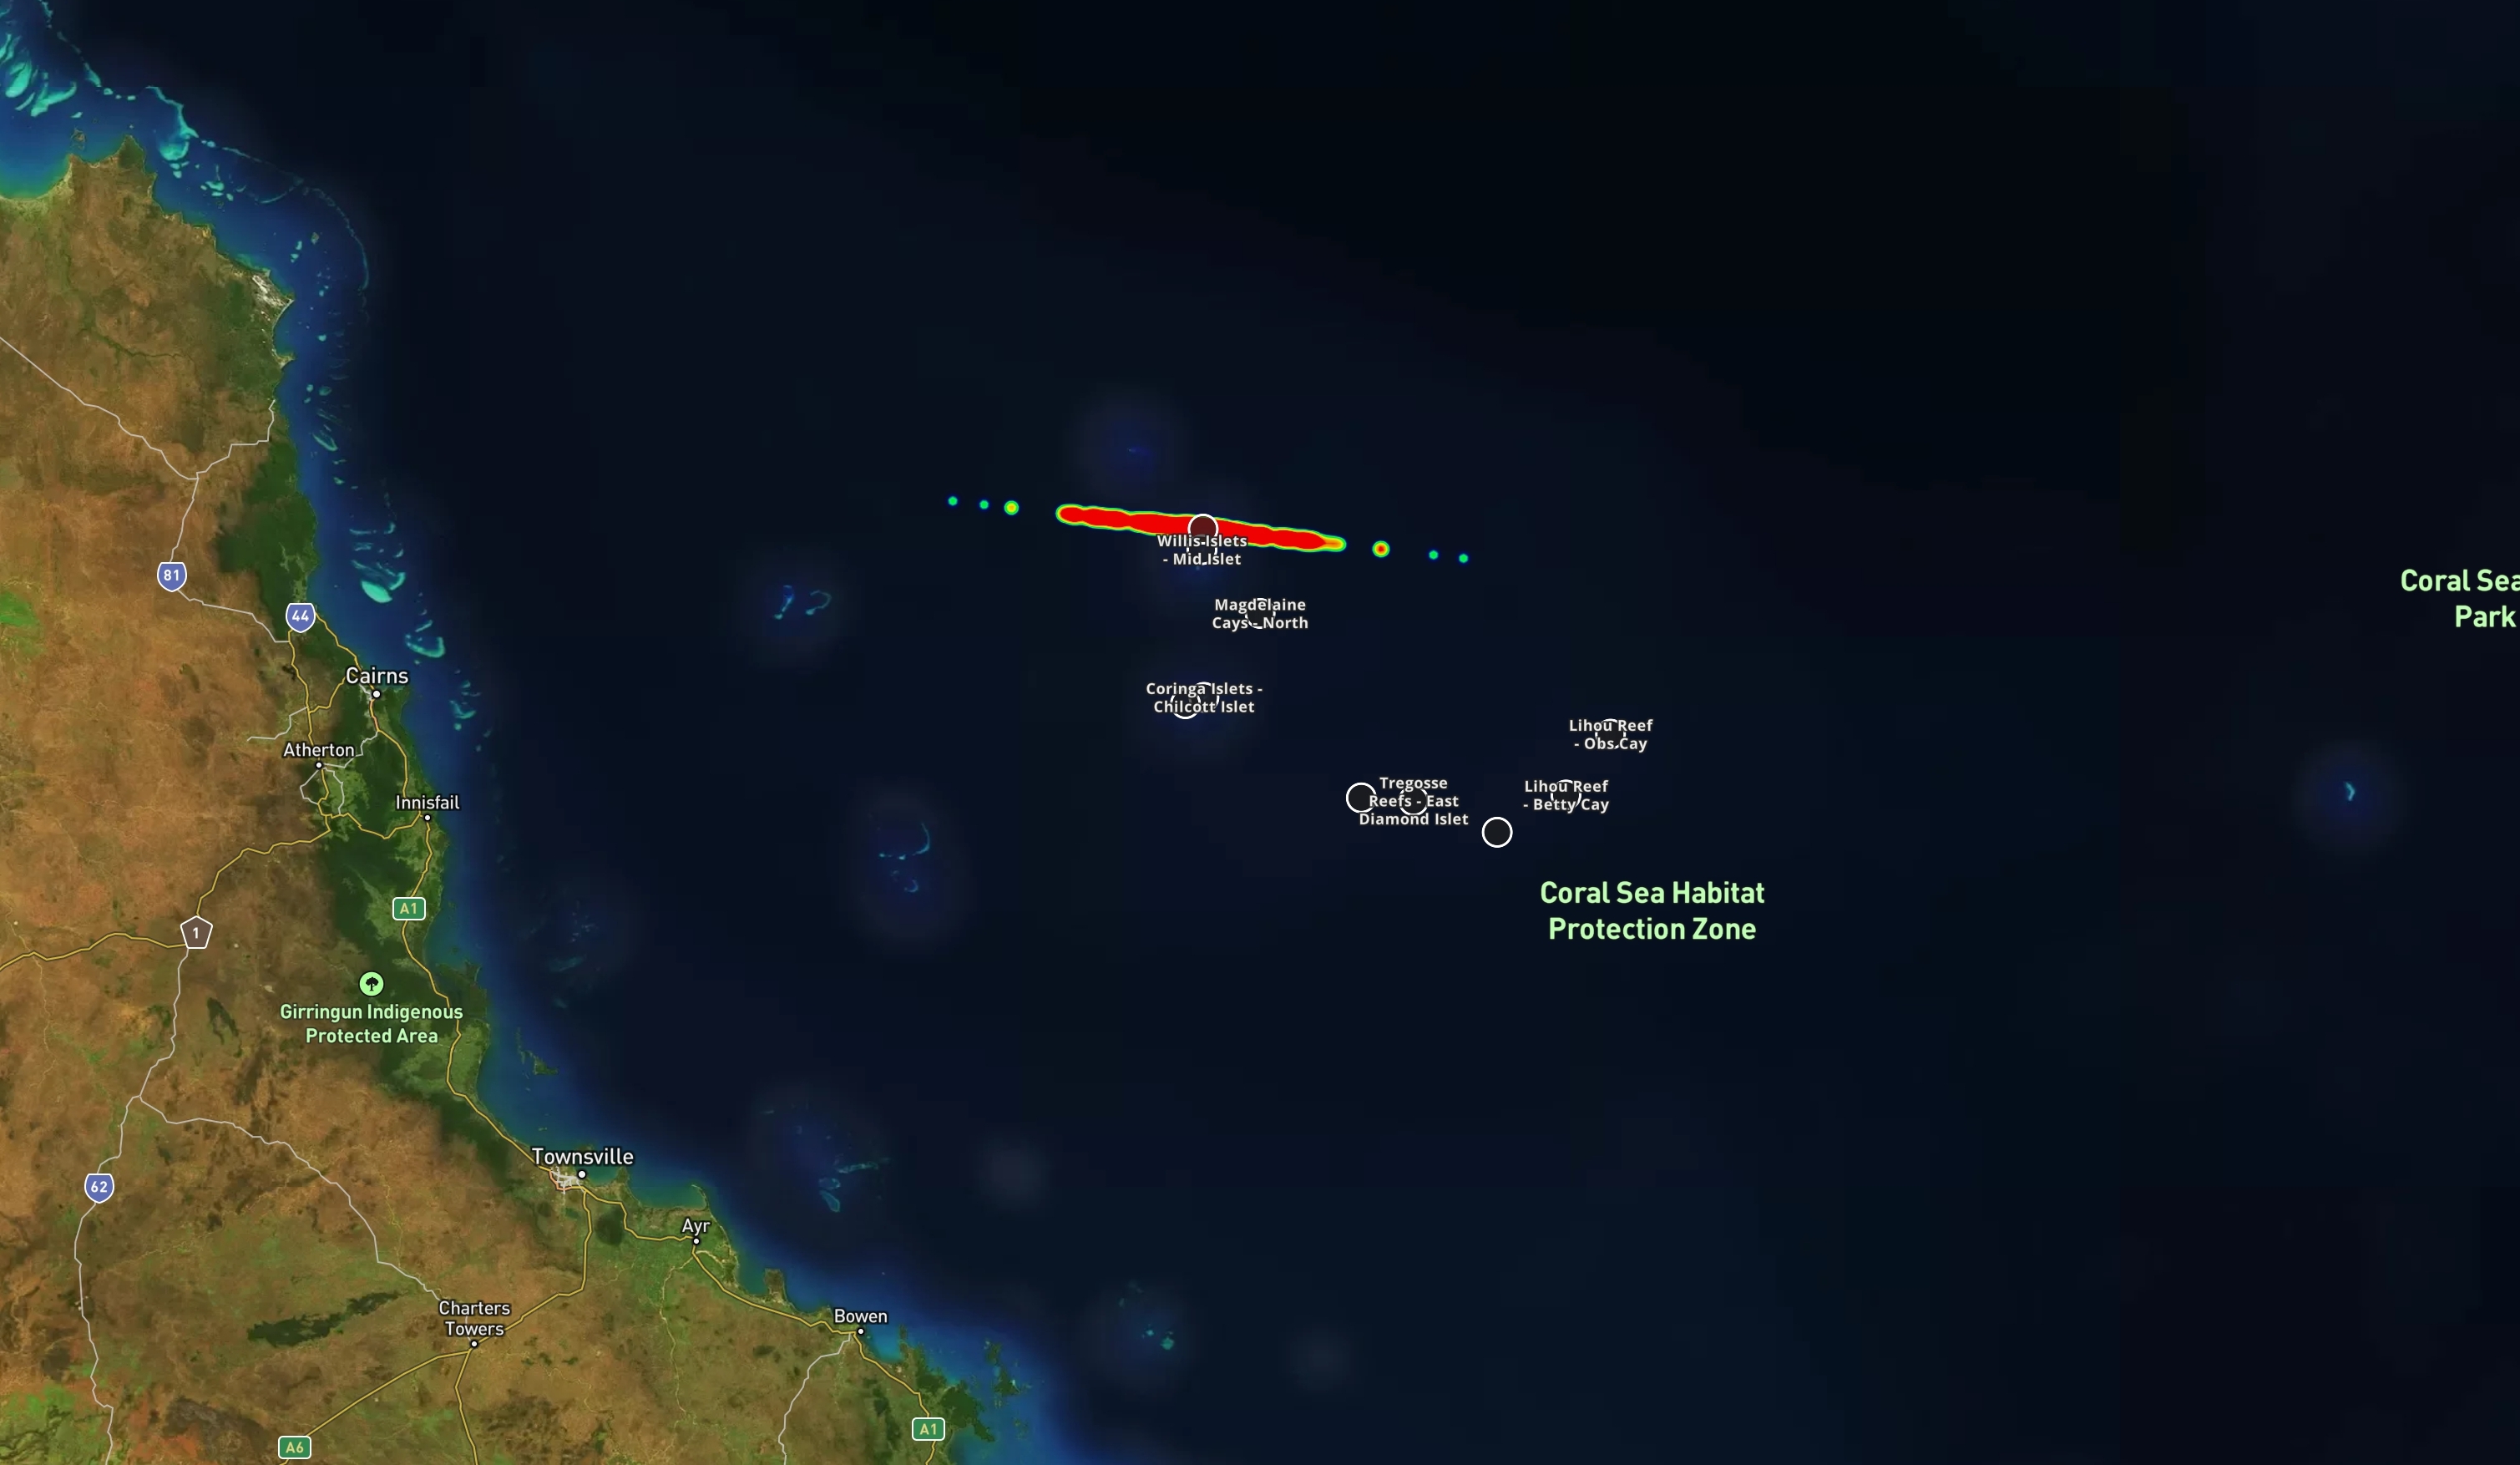
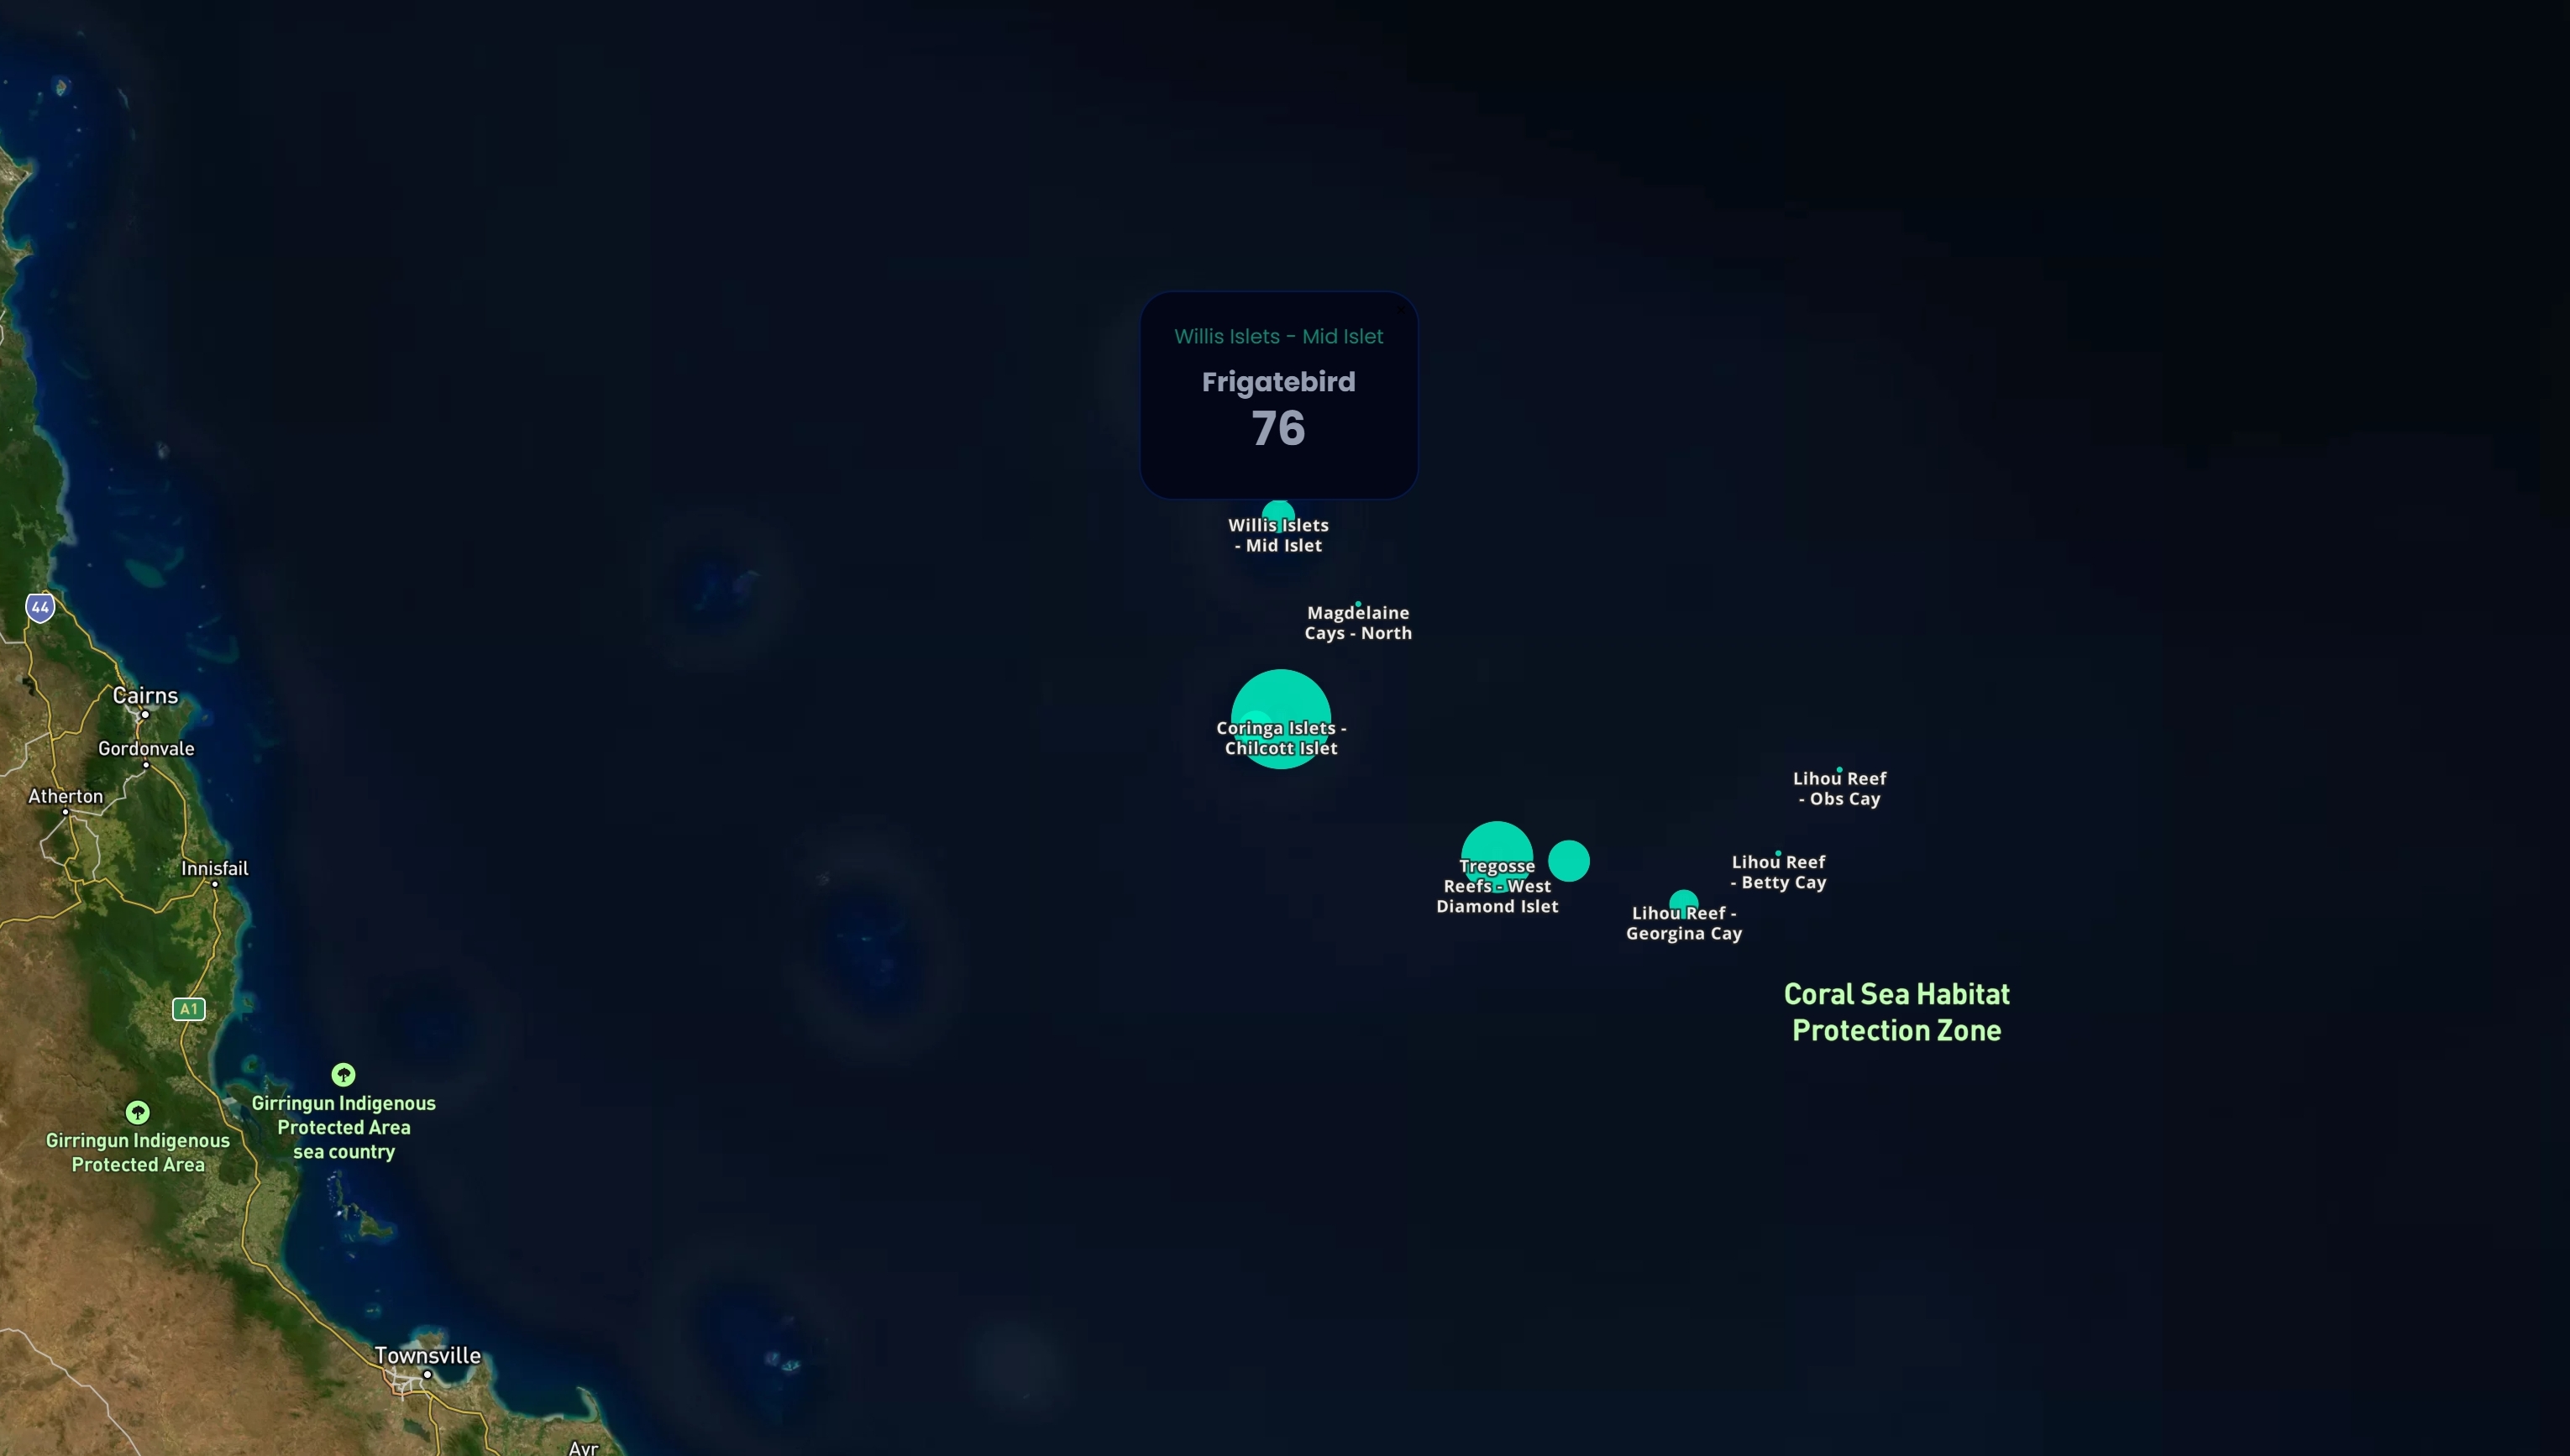
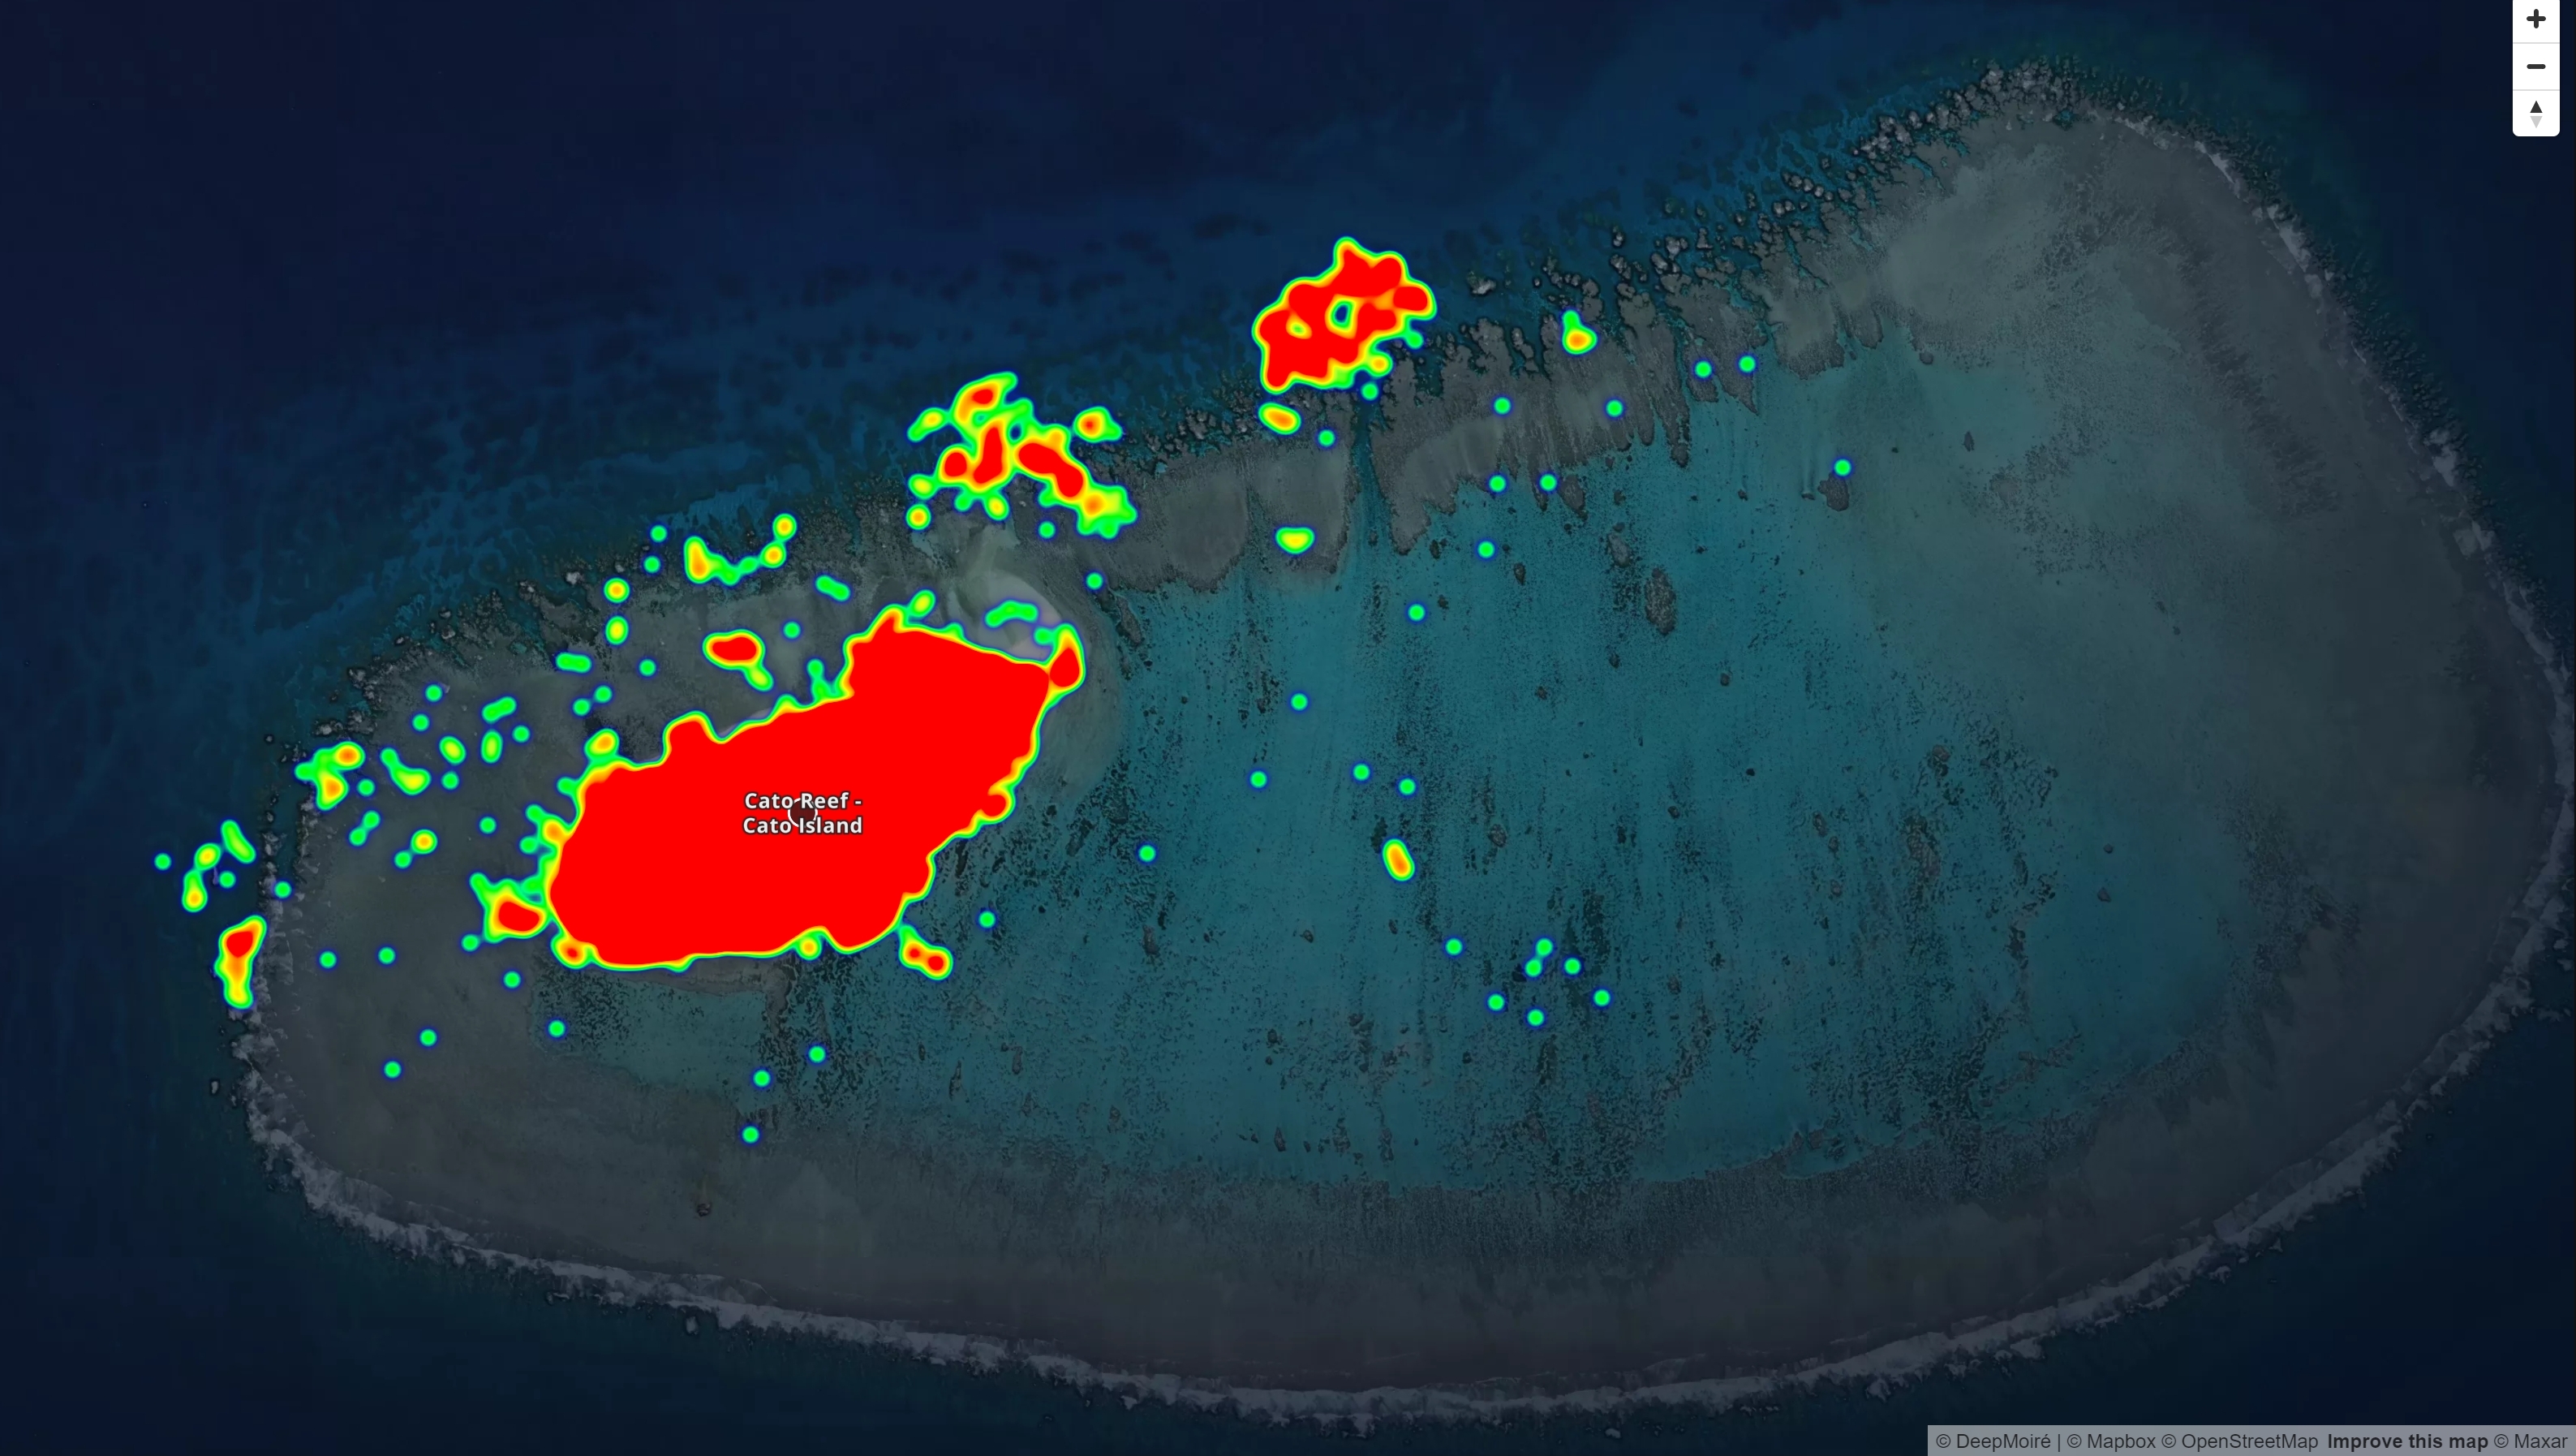
The delivered browser-based application combined an island-level map, a distribution heatmap, dynamic filters, and statistical charts. Proportional symbols supported comparison of aggregated counts between surveyed locations, while the distribution mode visualized individual observations as a geographic heatmap. Users could move from the complete survey area to a single island and filter the data by bird group, species, or subspecies. Human-versus-AI comparisons and two donut charts added complementary statistical views at both overall and island level.
Design & Data Visualization
The interface deliberately separated regional comparison from within-island distribution. Proportional circles were used for comparing population totals between locations, while a continuous density heatmap showed clusters generated by individual observations. Bird groups and species or subspecies were exposed through separate selectors, with aggregate views for all birds and all species. The accompanying donut charts provided categorical summaries alongside the geographic analysis, combining exploratory map interaction with compact explanatory views.
Technical Approach
The application was developed as a standalone HTML and JavaScript package using Mapbox GL JS for the interactive map and D3.js for the statistical charts, with Turf.js and Proj4 supporting the geospatial workflow. Source CSV data was parsed and transformed into GeoJSON features for visualization. Aggregated location data drove proportional symbols and charts, while the detailed survey dataset supplied the individual observations used by the heatmap. A geometry-processing issue discovered during development was corrected so that observation locations were positioned accurately.
Technologies
- Mapbox GL JS
- JavaScript
- D3.js
- Turf.js
- Proj4
- GeoJSON
- CSV
- HTML/CSS
- Bootstrap
Data Workflow
The visualization was built around a fully automated data workflow rather than a fixed dataset. Updated survey files following the established structure could feed the application and regenerate map layers, filters, statistics, distributions, and comparisons without rebuilding the interface manually. This allowed the same visualization system to accommodate additional observations and surveyed locations as the underlying dataset expanded.
Outcome
The finished application was used in the final conservation report, providing a single interactive environment for examining bird-survey data by overall survey, island, bird group, species or subspecies, spatial density, and human-versus-AI classification. The delivered source package could be hosted internally, while the automated structure allowed subsequent survey data to reuse the same visualization workflow.