
Commercial facilities / vendor network coverage and RFP analysis
Vendor Coverage Map & Regional Proximity Analysis
Overview
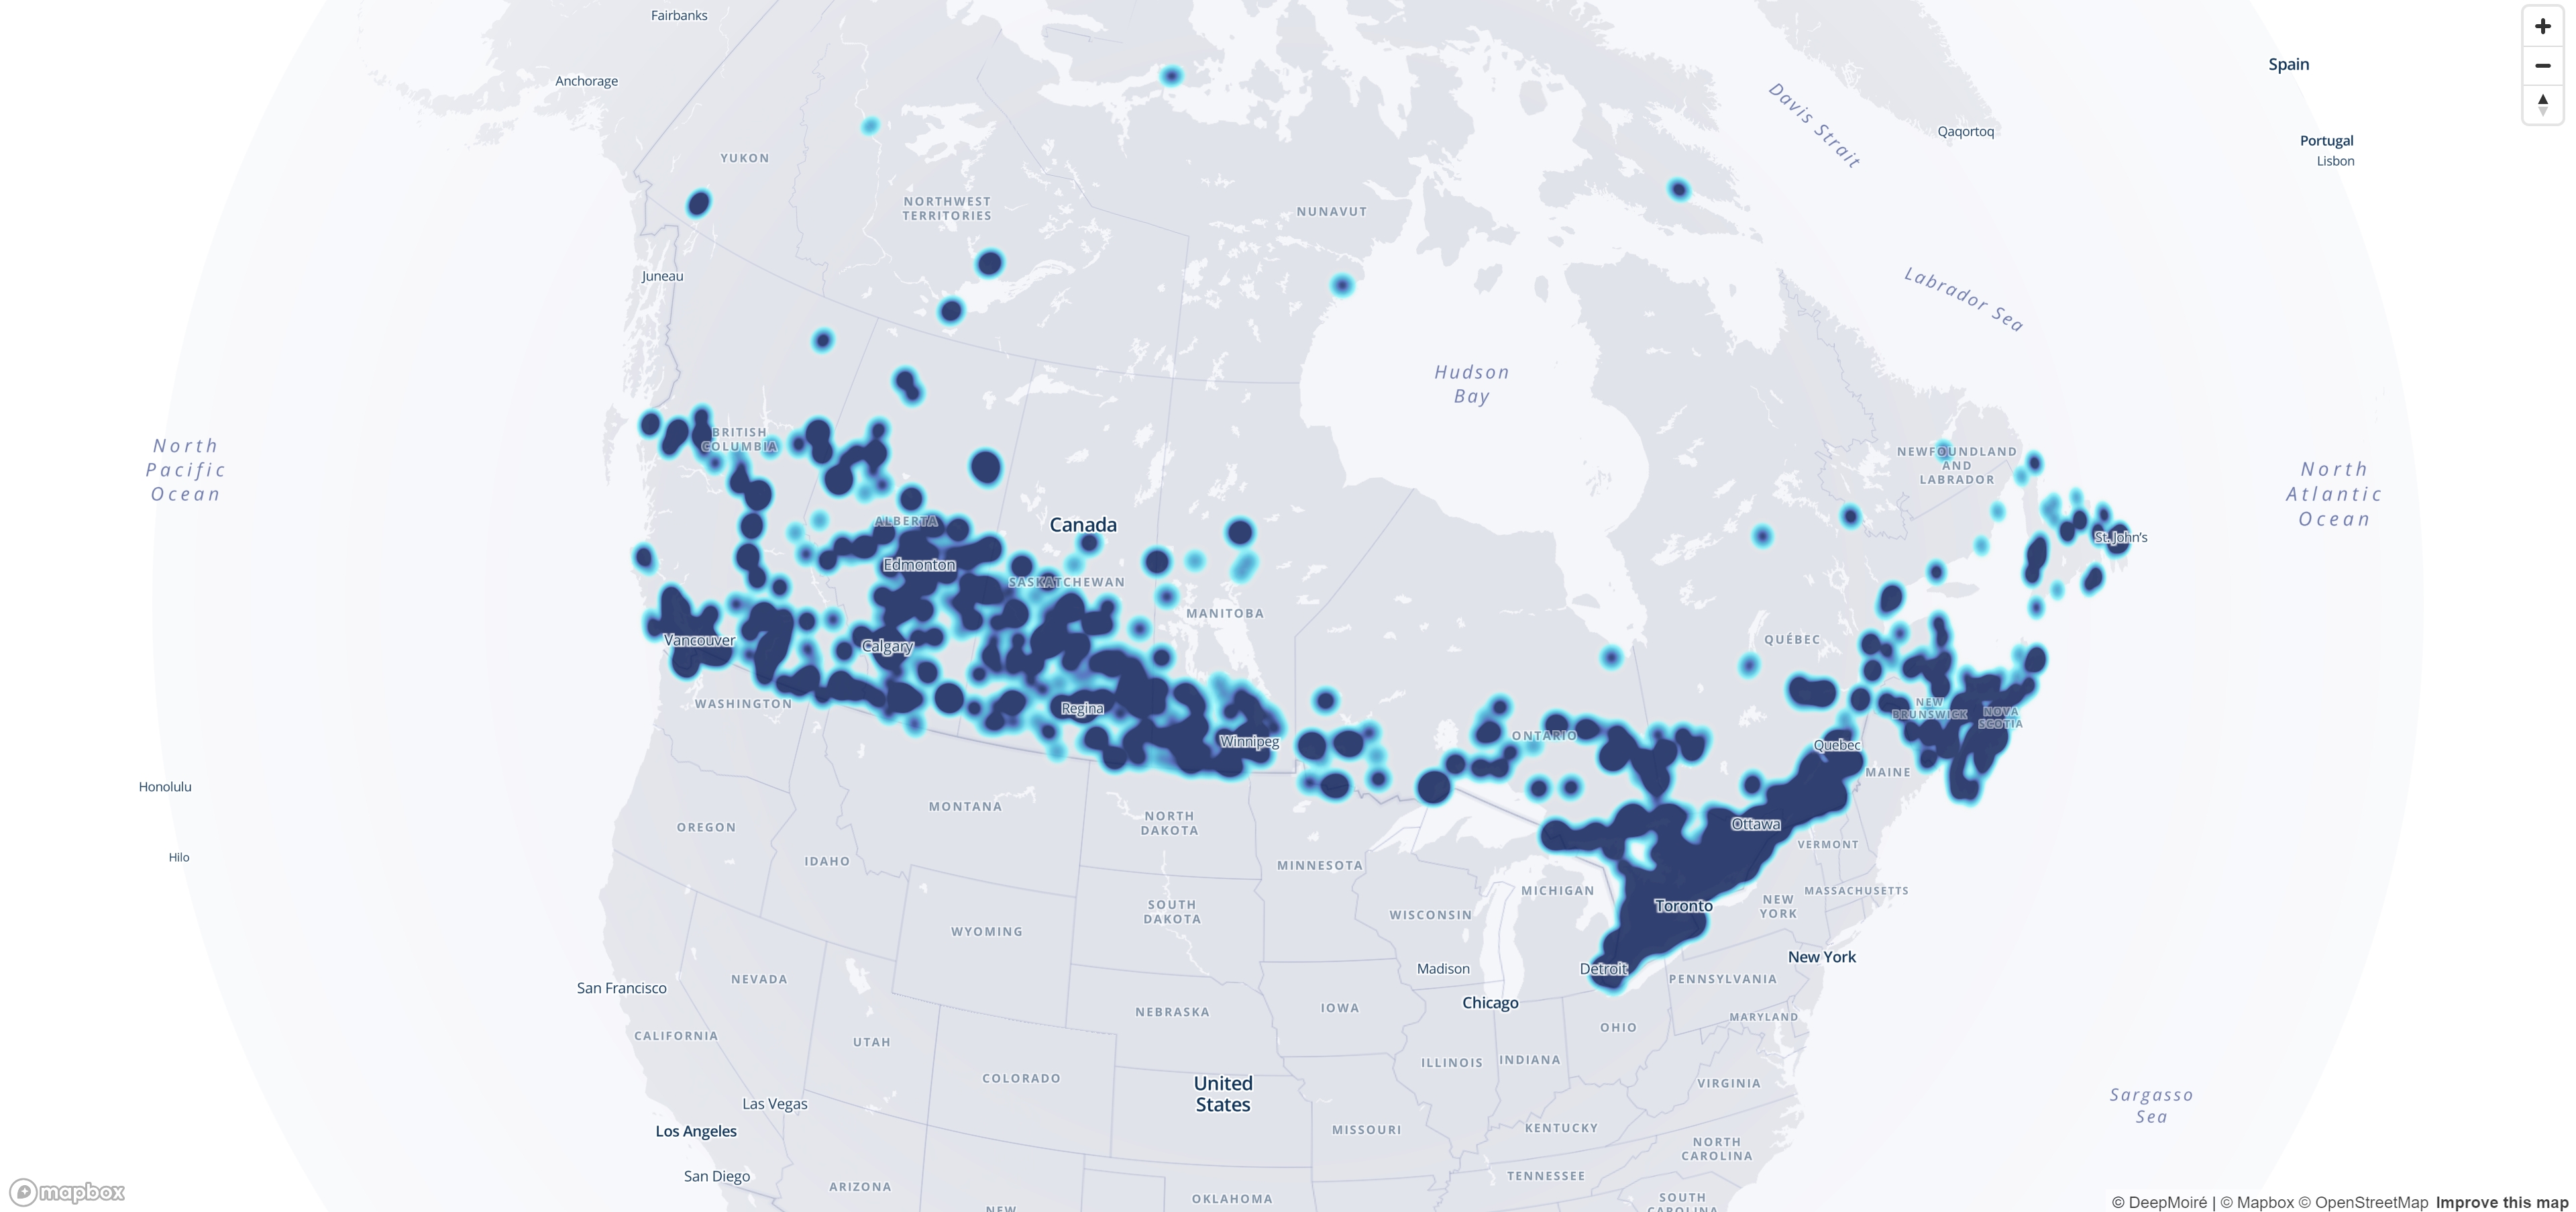
This project combined an interactive vendor coverage map with automated regional proximity analysis for a large commercial retail network. The application brought together 798 retail locations and 5,357 service-provider records across nine service categories, allowing vendor distribution and density to be assessed visually while also producing quantitative coverage data for an RFP submission. The mapping interface and reporting workflow were designed as parts of the same system, so the underlying datasets could support both presentation-ready map views and repeatable regional statistics.
Challenge
The project had two related requirements: communicate the geographic coverage of a large vendor network around hundreds of retail locations in a form suitable for presentation, and produce structured statistics showing how many vendors of each service type were available within 50 km of the locations belonging to each operational region. The source data consisted primarily of addresses rather than ready-to-use spatial datasets, so the locations first had to be geocoded and prepared for mapping. The vendor dataset contained 5,357 records divided among nine service categories, while the retail network contained 798 locations organized into six operational regions. The visual output also had to work as presentation material, making information hierarchy and custom styling important alongside the spatial analysis.
Solution
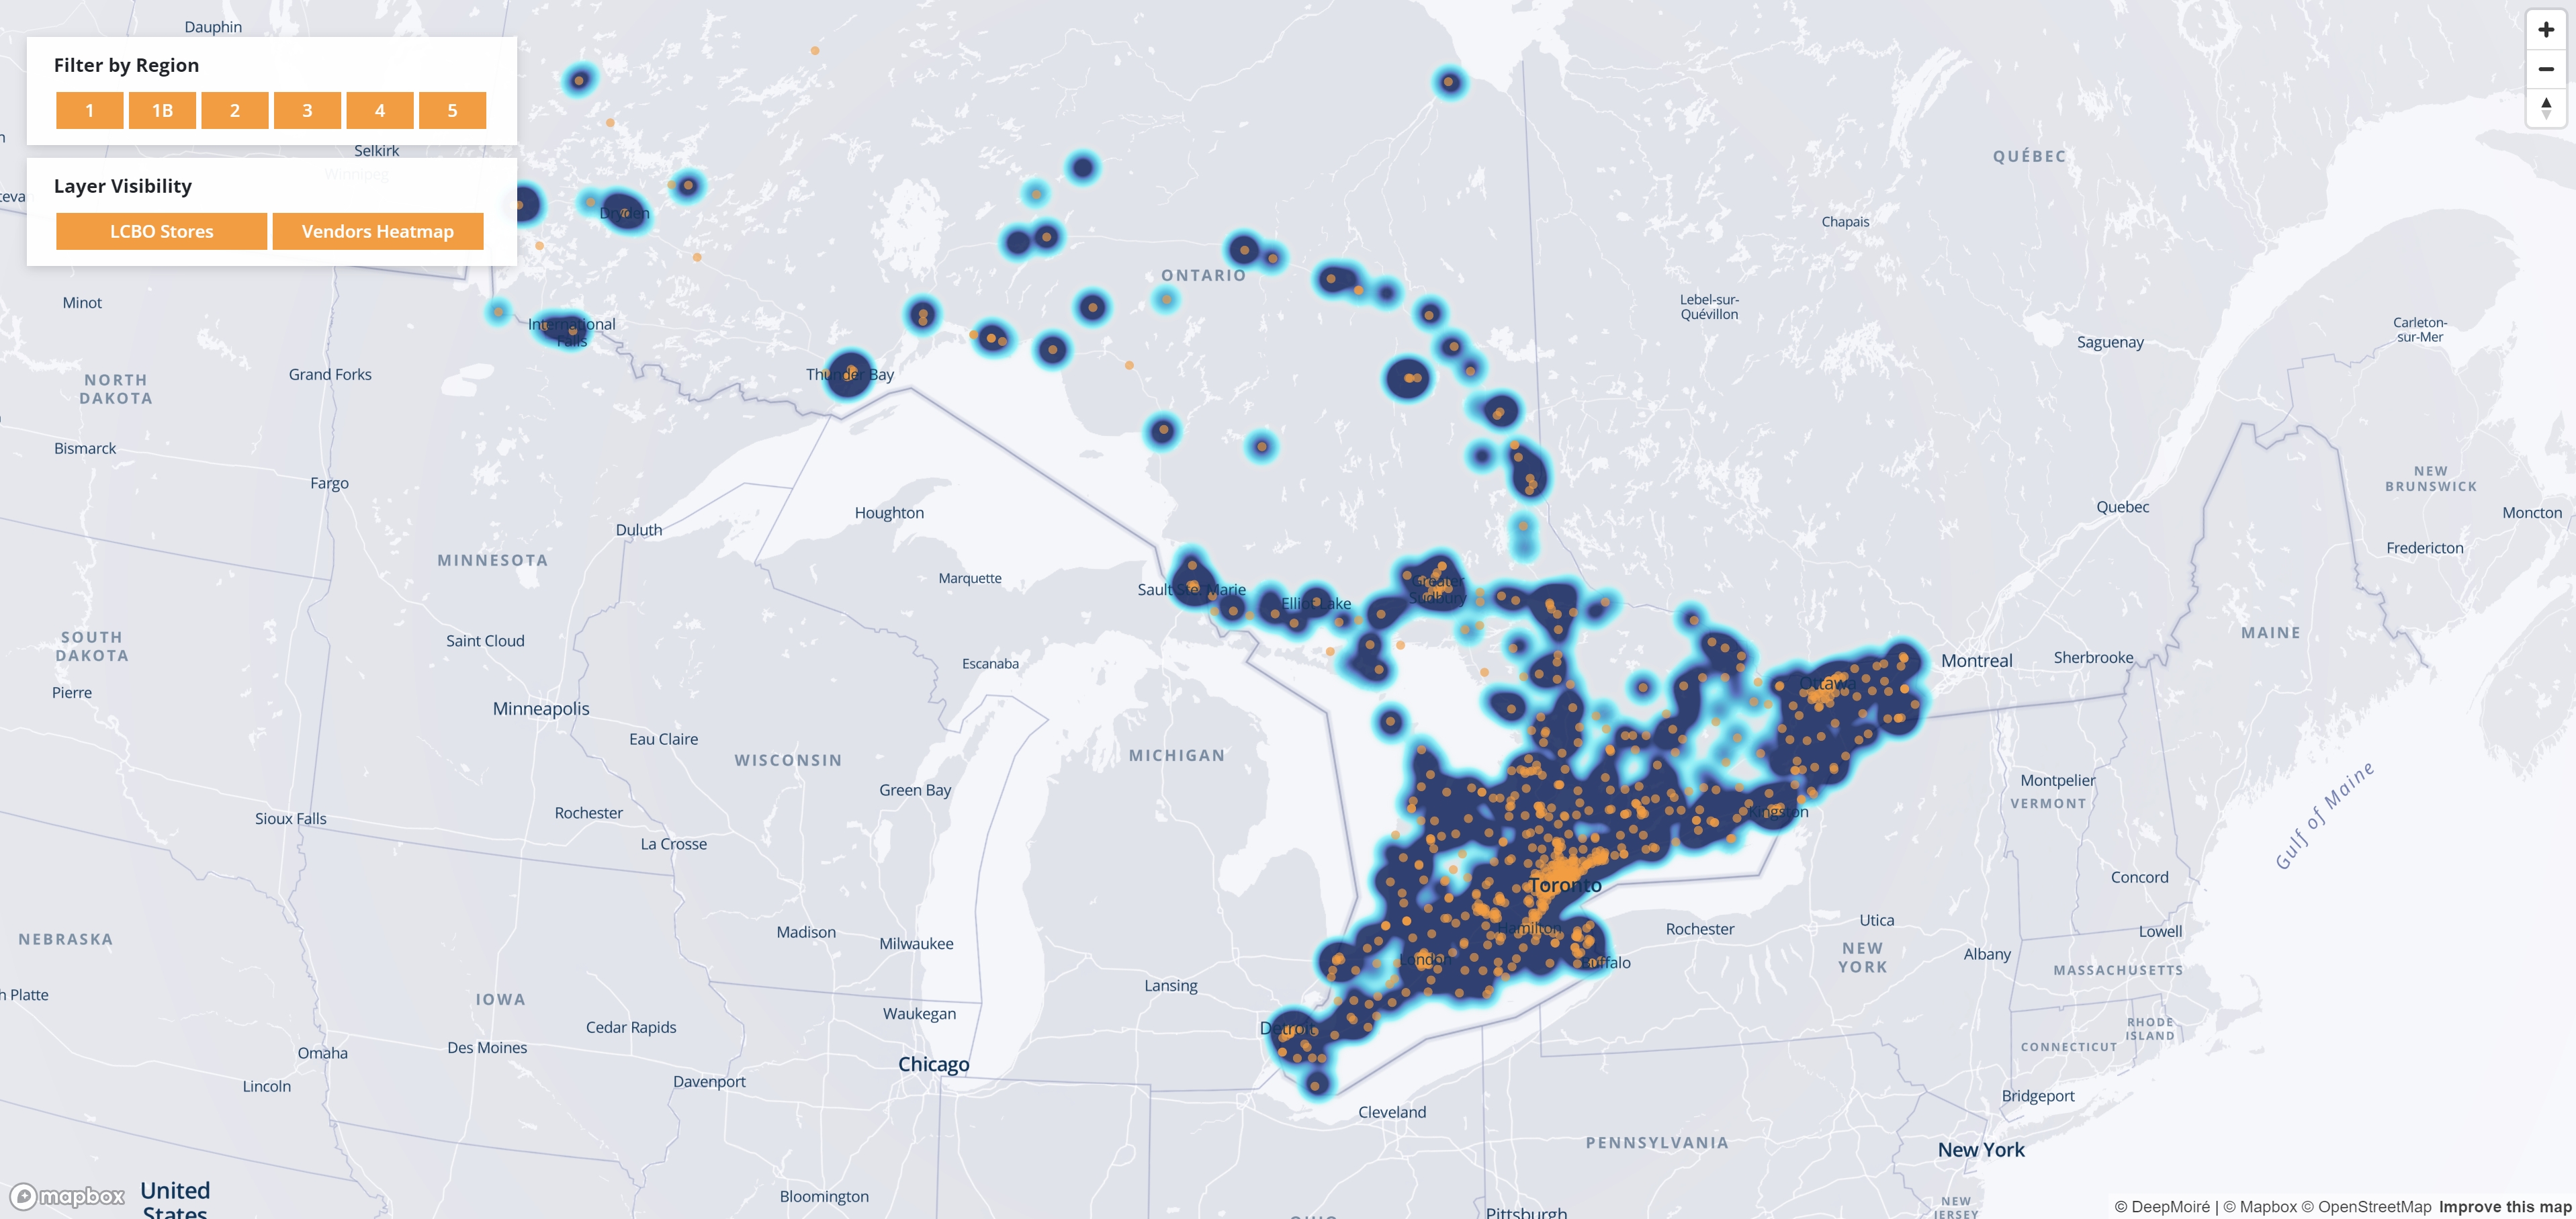
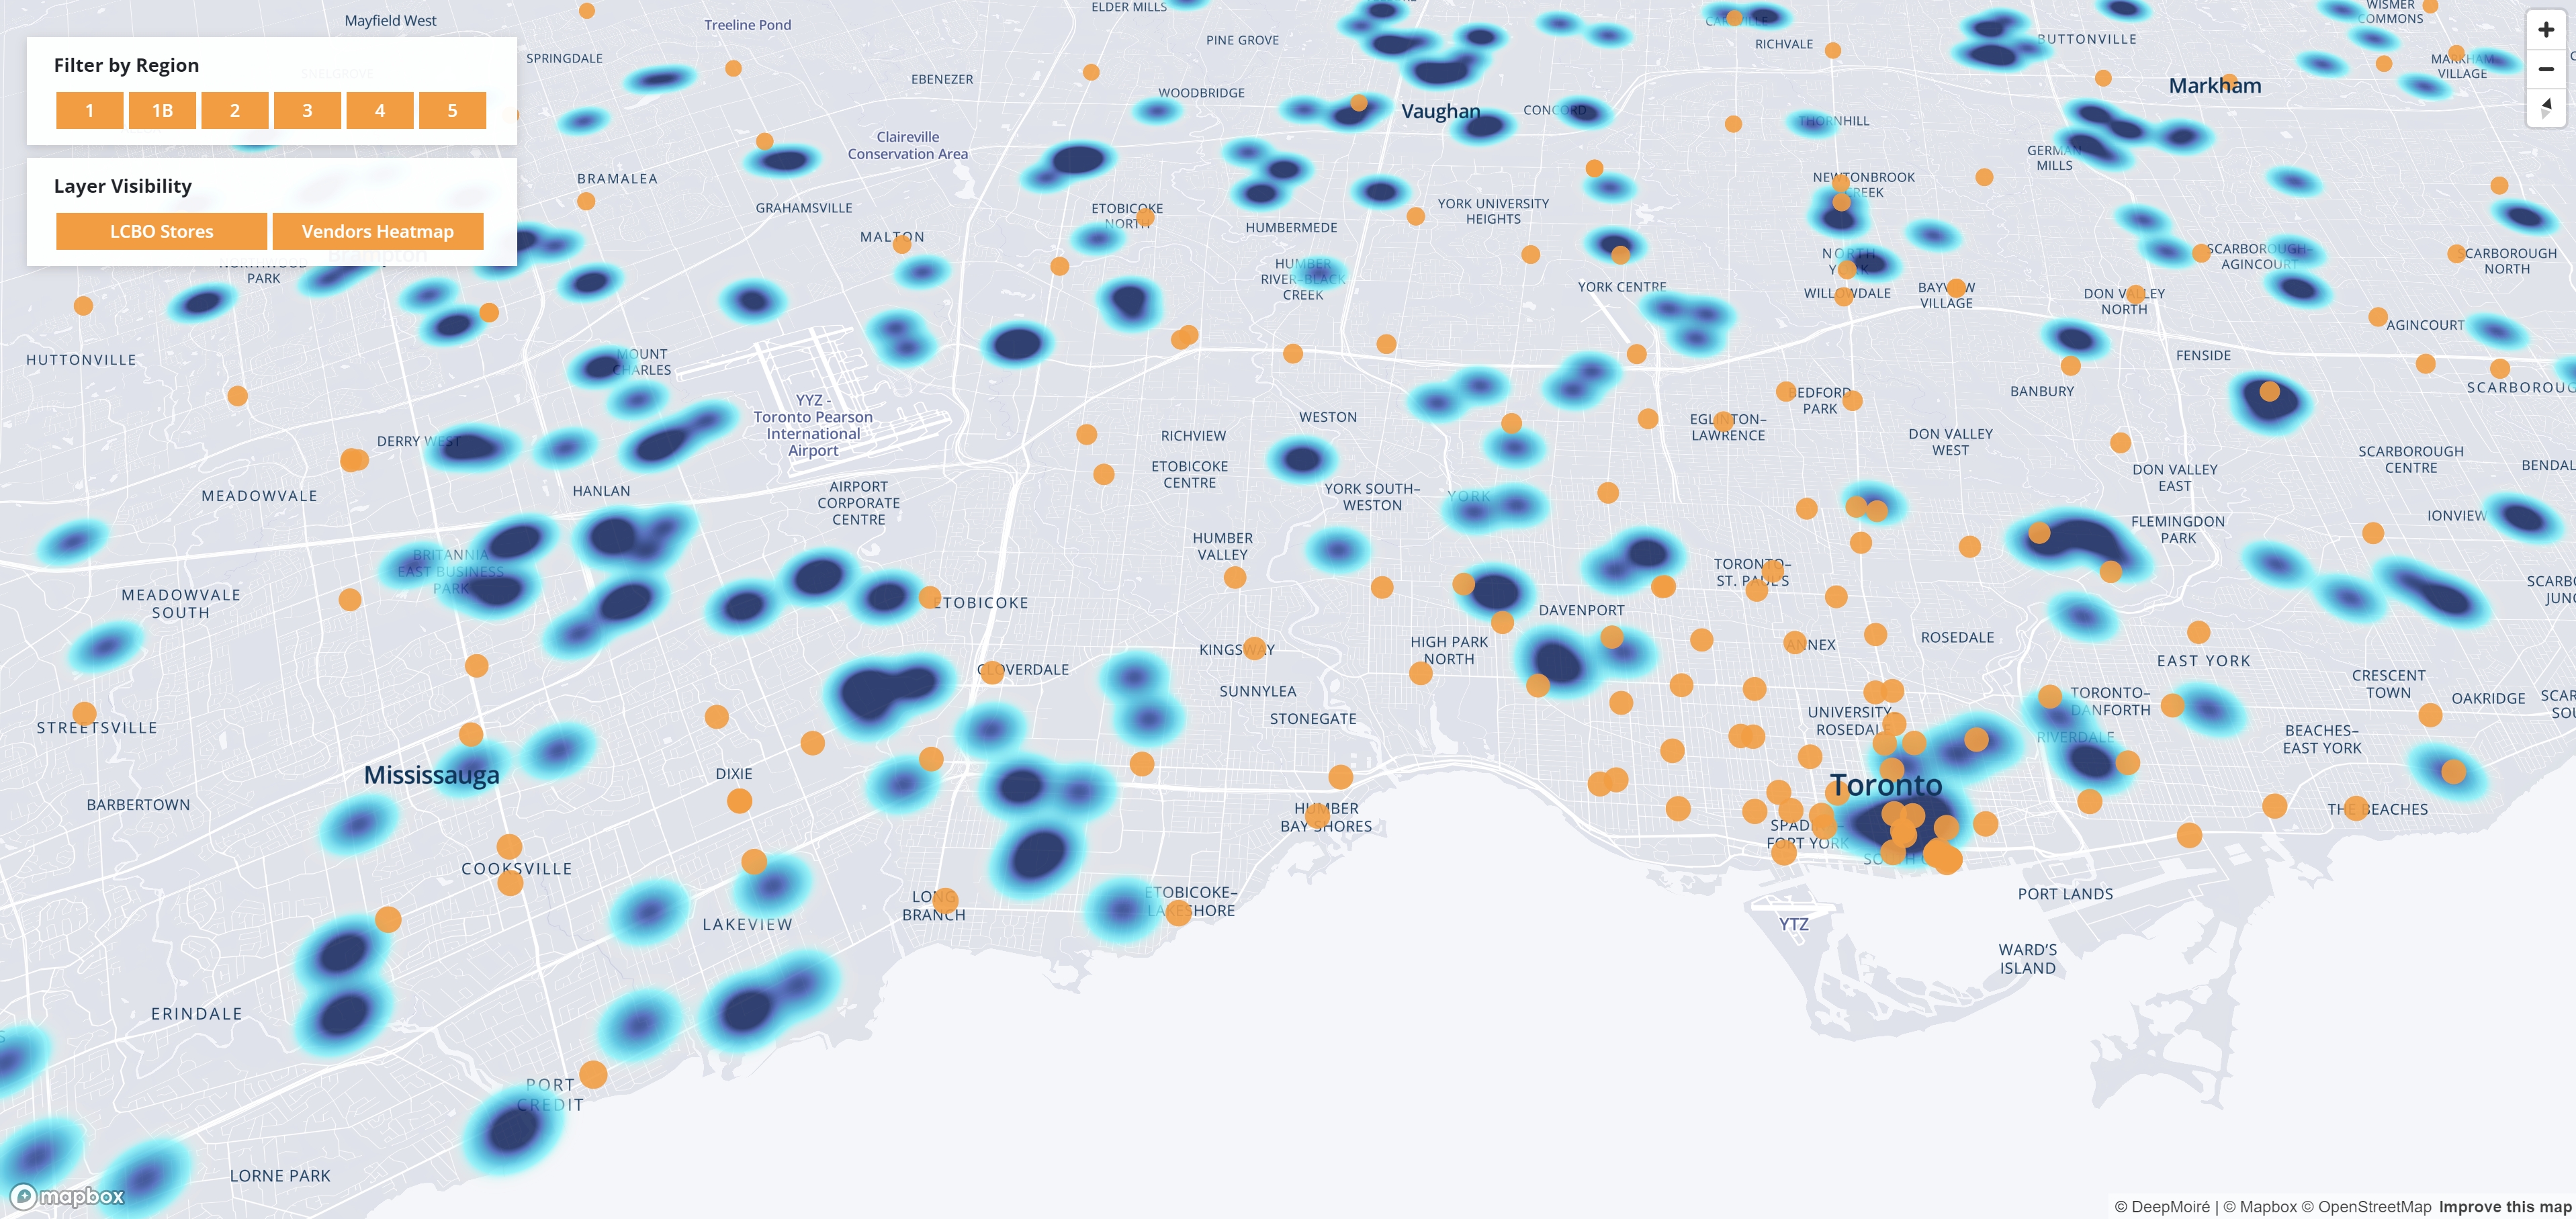
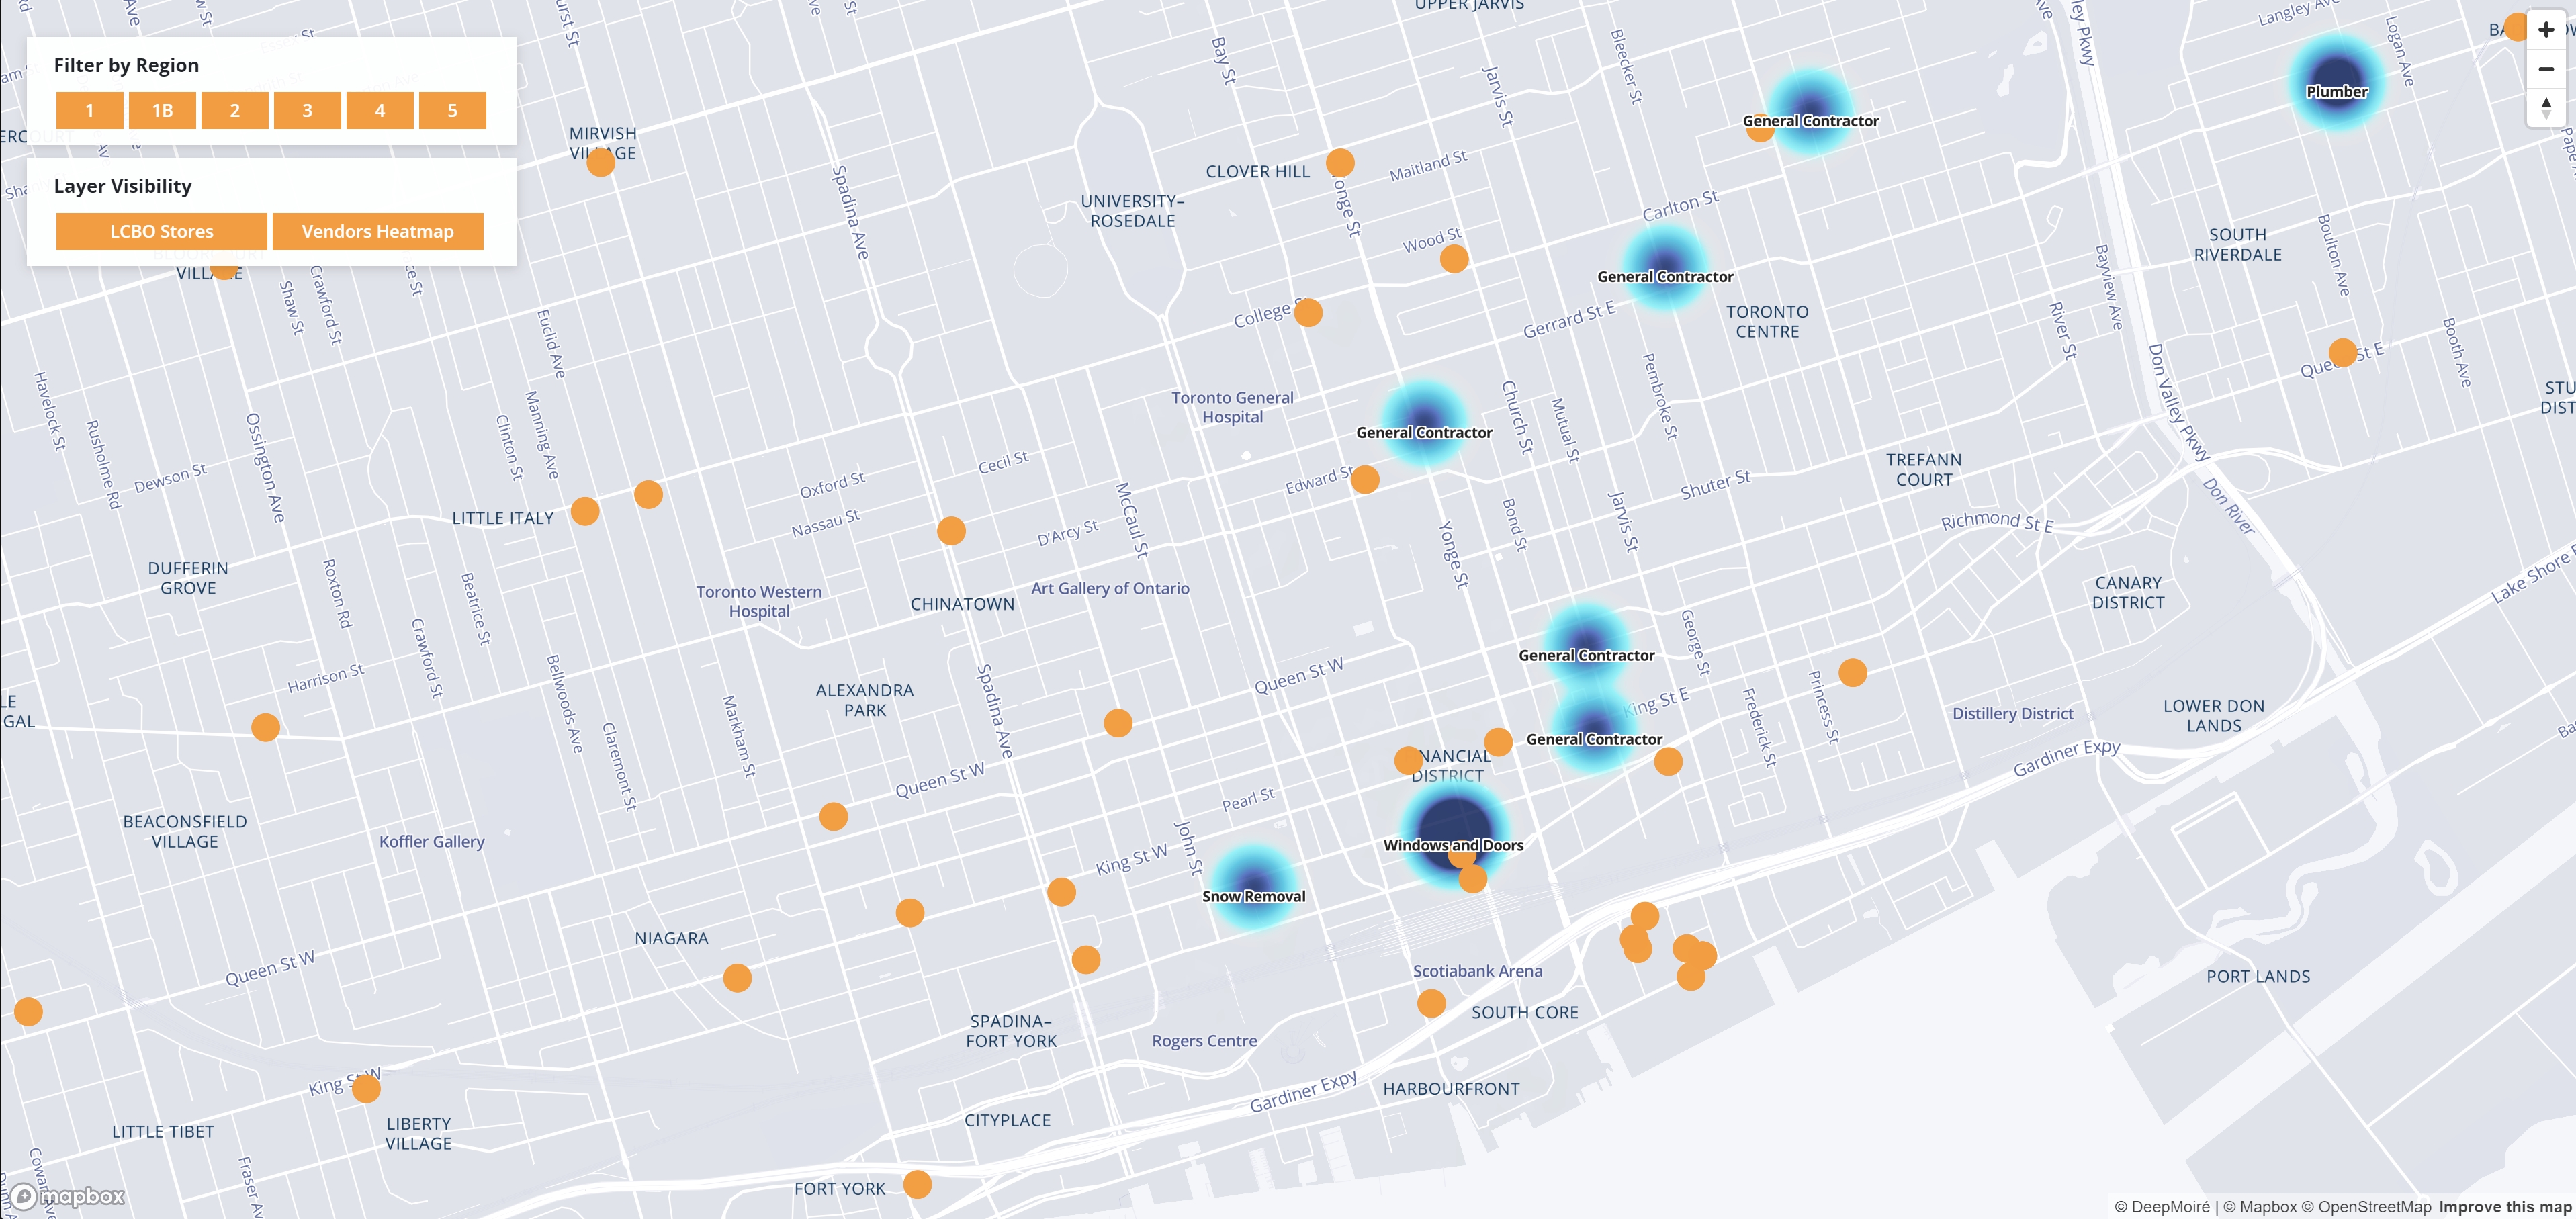
The final application used two complementary levels of vendor visualization. At wider map scales, service providers were represented as a heatmap to reveal variations in coverage density. As users zoomed further in, the density visualization transitioned to individual vendor points labelled by service type. Retail locations were displayed as a separate layer and organized into six operational regions. A region control allowed users to selectively show or hide retail locations belonging to each region, while a separate layer control managed the retail-location and vendor layers independently. The vendor heatmap remained a complete view of the provider network rather than being filtered by the selected retail region.
Design & Data Visualization
The map's visual language, including basemap styling, colors, typography, and data-layer treatment, was designed specifically for the project to complement the supplied brand identity and produce clear presentation-ready views. Rather than using a single representation at every scale, the interface separated two reading tasks: the heatmap emphasized overall vendor density at regional scale, while individual vendor points and service categories became visible at closer scales. Retail locations used a distinct visual treatment so they remained legible against the density surface.
Technical Approach
The interactive map was developed in JavaScript with Mapbox GL JS and a custom Mapbox style. CSV datasets were loaded in the browser and converted into GeoJSON point features using their latitude and longitude fields, with separate sources and layers for retail locations and service providers. Vendor density was represented through a Mapbox heatmap layer at broader zoom levels and an individual symbol layer at closer zoom levels. Zoom-dependent opacity, radius, and layer visibility managed the transition between aggregate and individual representations. Regional filtering was applied specifically to the retail-location layer through each location's region code, while vendor and retail layers could be independently toggled.
Technologies
- Mapbox GL JS
- JavaScript
- HTML/CSS
- CSV
- GeoJSON
- address geocoding
- Haversine distance calculation
Data Workflow
Both the retail-location and vendor address datasets were geocoded and transformed into coordinate-based spatial data before being used by the application. For every operational region, the application grouped its retail locations and calculated whether each vendor was located within 50 km of at least one location in that region using the Haversine formula. The process was repeated independently for each service category, producing a region-by-category coverage table that could be downloaded directly as CSV. Embedding the calculation in the application created a reusable reporting workflow so future datasets following the same structure could generate updated regional statistics without manually rebuilding the proximity analysis.
Outcome
The completed system provided both a visual and quantitative description of vendor coverage around a large retail network. Users could inspect provider density, move from regional patterns to individual service-provider locations, isolate retail locations by operational region, and control the main information layers independently. At the same time, the application generated the region-level vendor counts required for the RFP directly from the spatial datasets, linking the interactive map and statistical deliverable through one repeatable workflow and reducing the need for manual recalculation when the underlying data changed.