
Institutional research / humanitarian resilience / programme evaluation
Interactive Research Map & Geospatial Dashboard for Syria
Overview
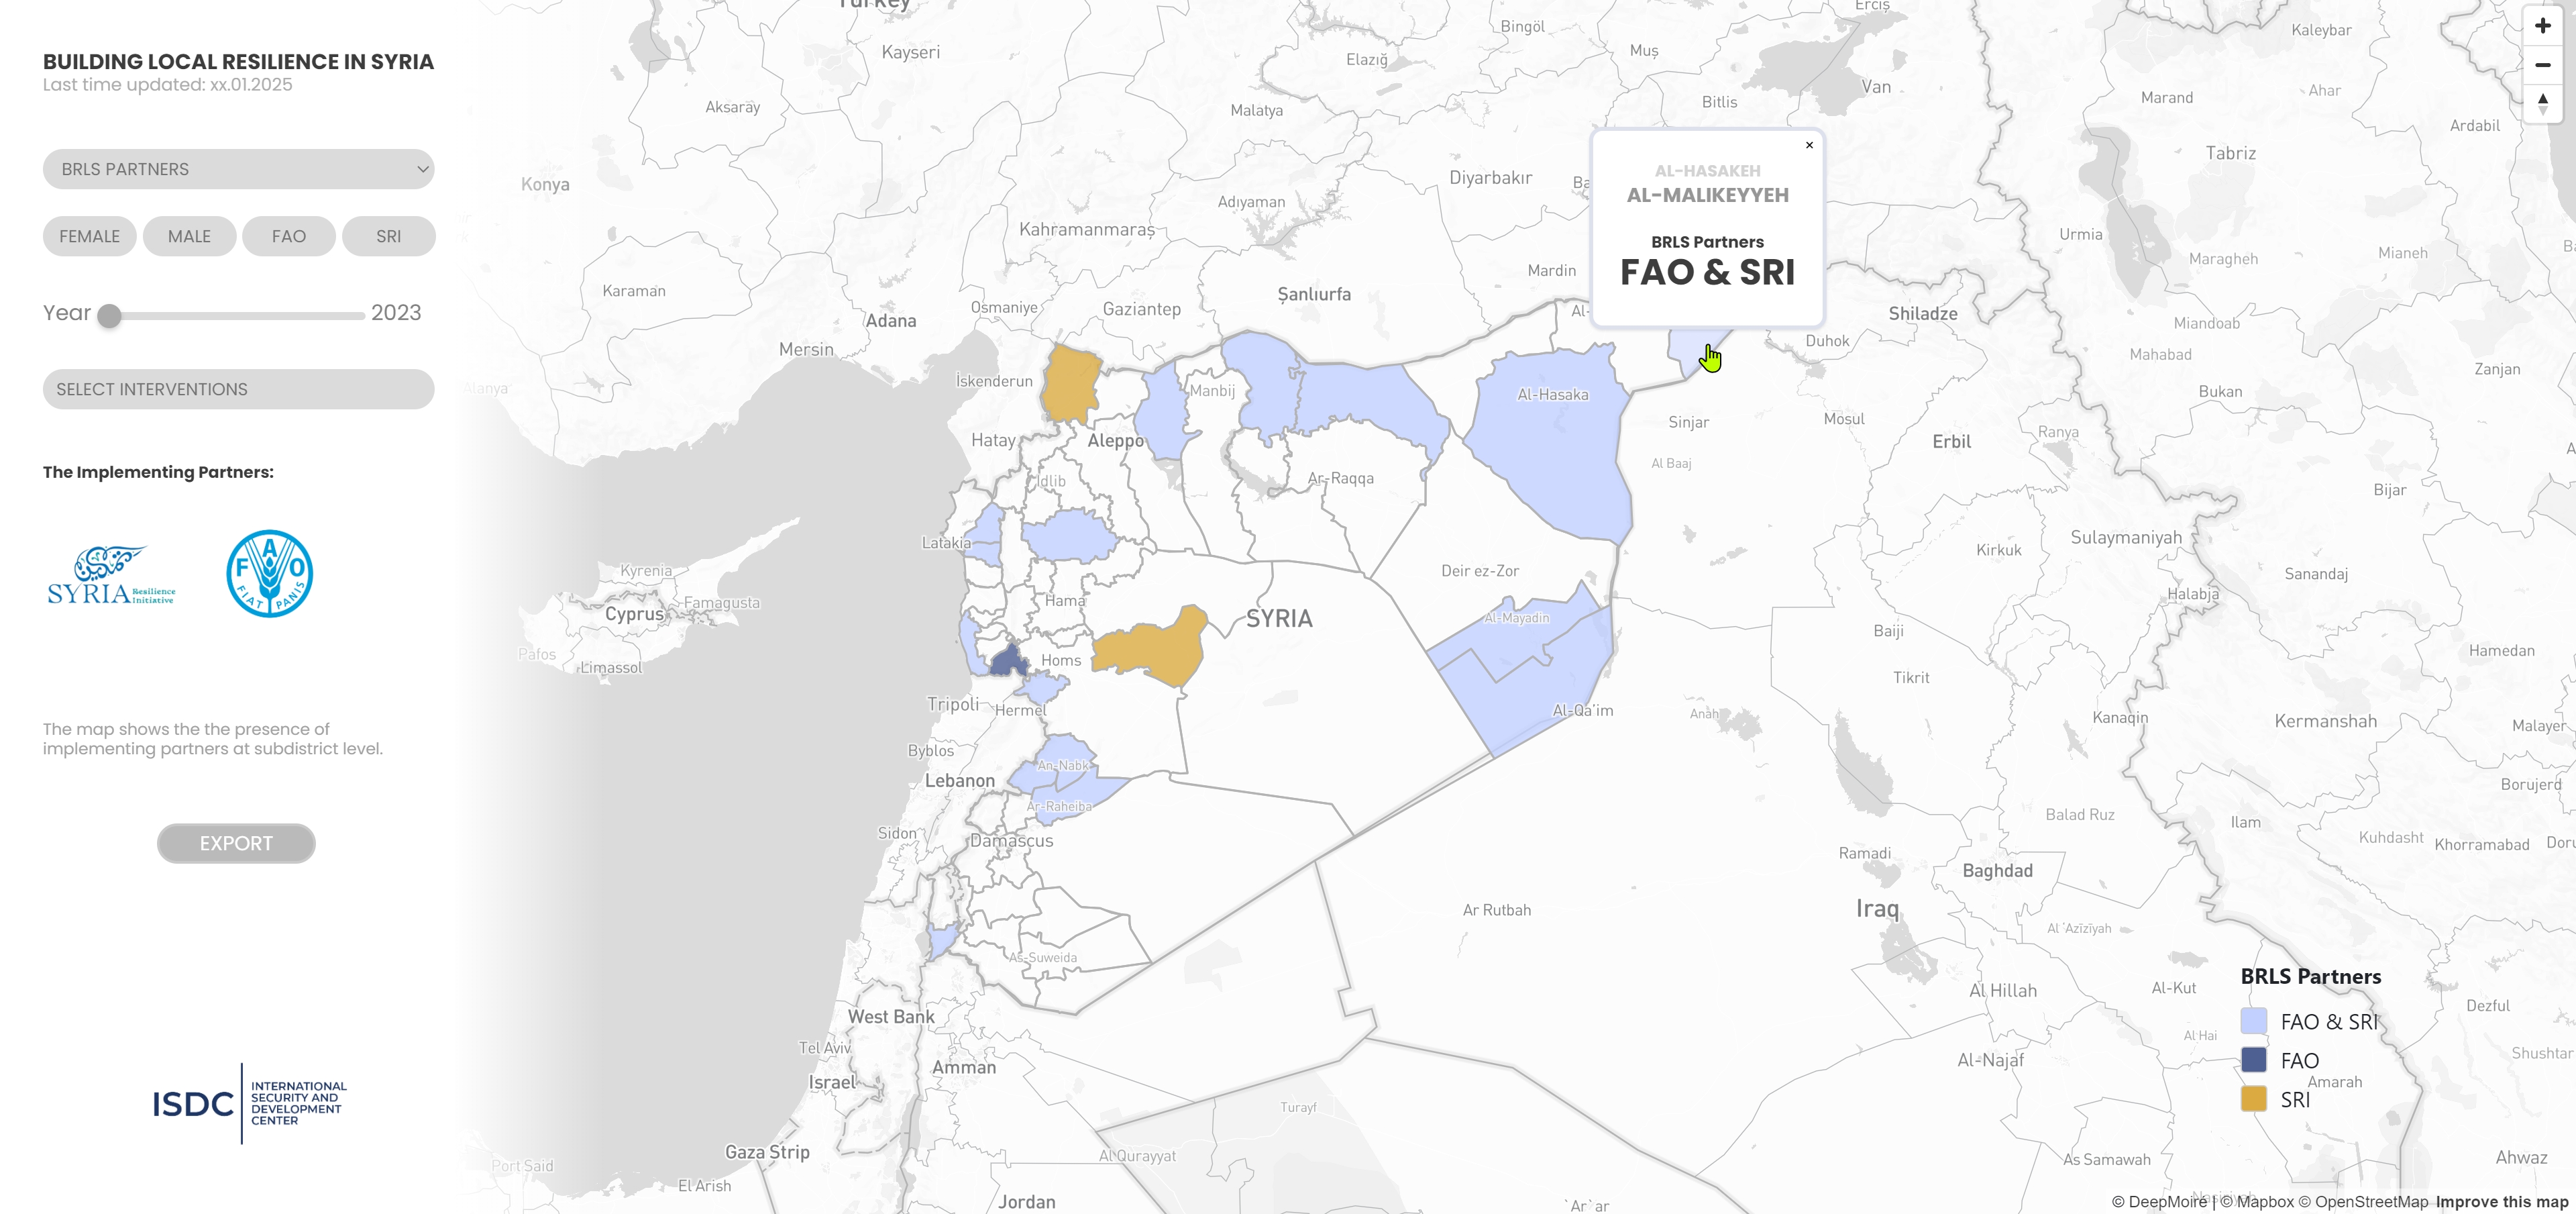
This project involved the end-to-end design and development of a React-based geospatial dashboard for an institutional resilience and research programme in Syria. Starting from a simple reference prototype, I designed and built a complete interactive map application combining Mapbox, D3.js visualizations, dynamic filters, calculated indicators, contextual information, and multiple analytical views. The interface was designed for institutional and research use, where the map needed to support exploration of programme activity and research findings rather than function as a static geographic display.
Challenge
The source data combined different analytical levels and several types of information. The research dataset contained more than 7,000 observations and approximately 30 variables, including administrative geography, household survey information, programme interventions, food-security indicators, conflict fatalities, and survey responses related to violence against women and girls. Some information existed at household level while other variables described entire districts, and updated datasets could contain multiple records for the same administrative area. The application therefore needed consistent aggregation logic while allowing users to switch between different analytical questions and filters without separating the data into multiple tools.
Solution
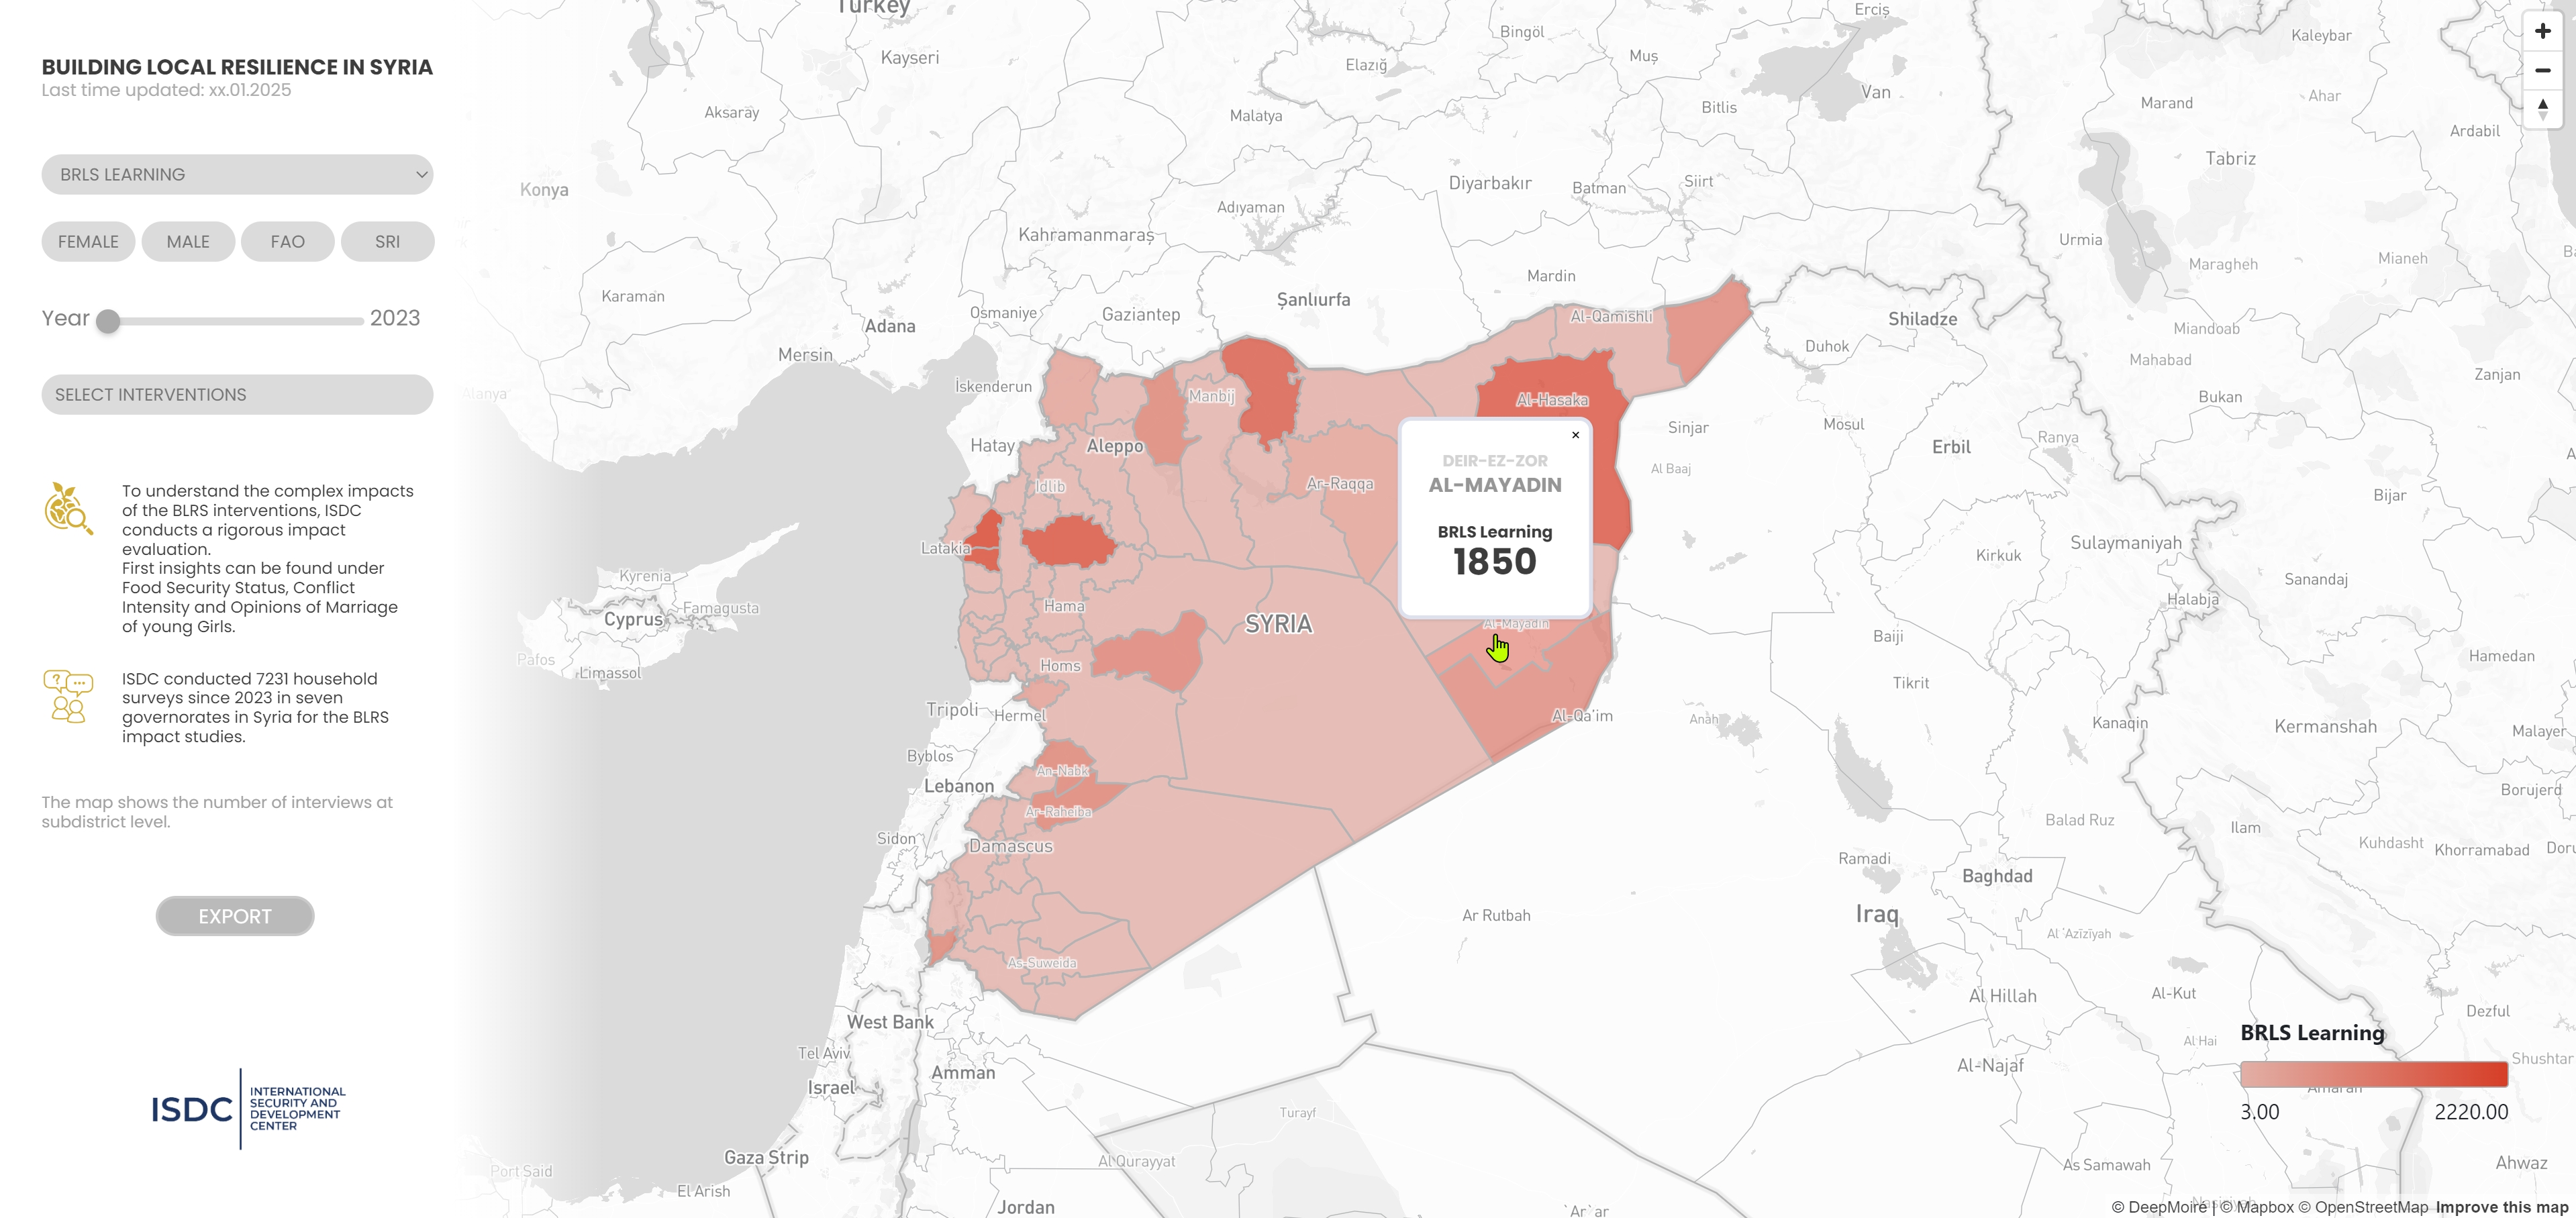
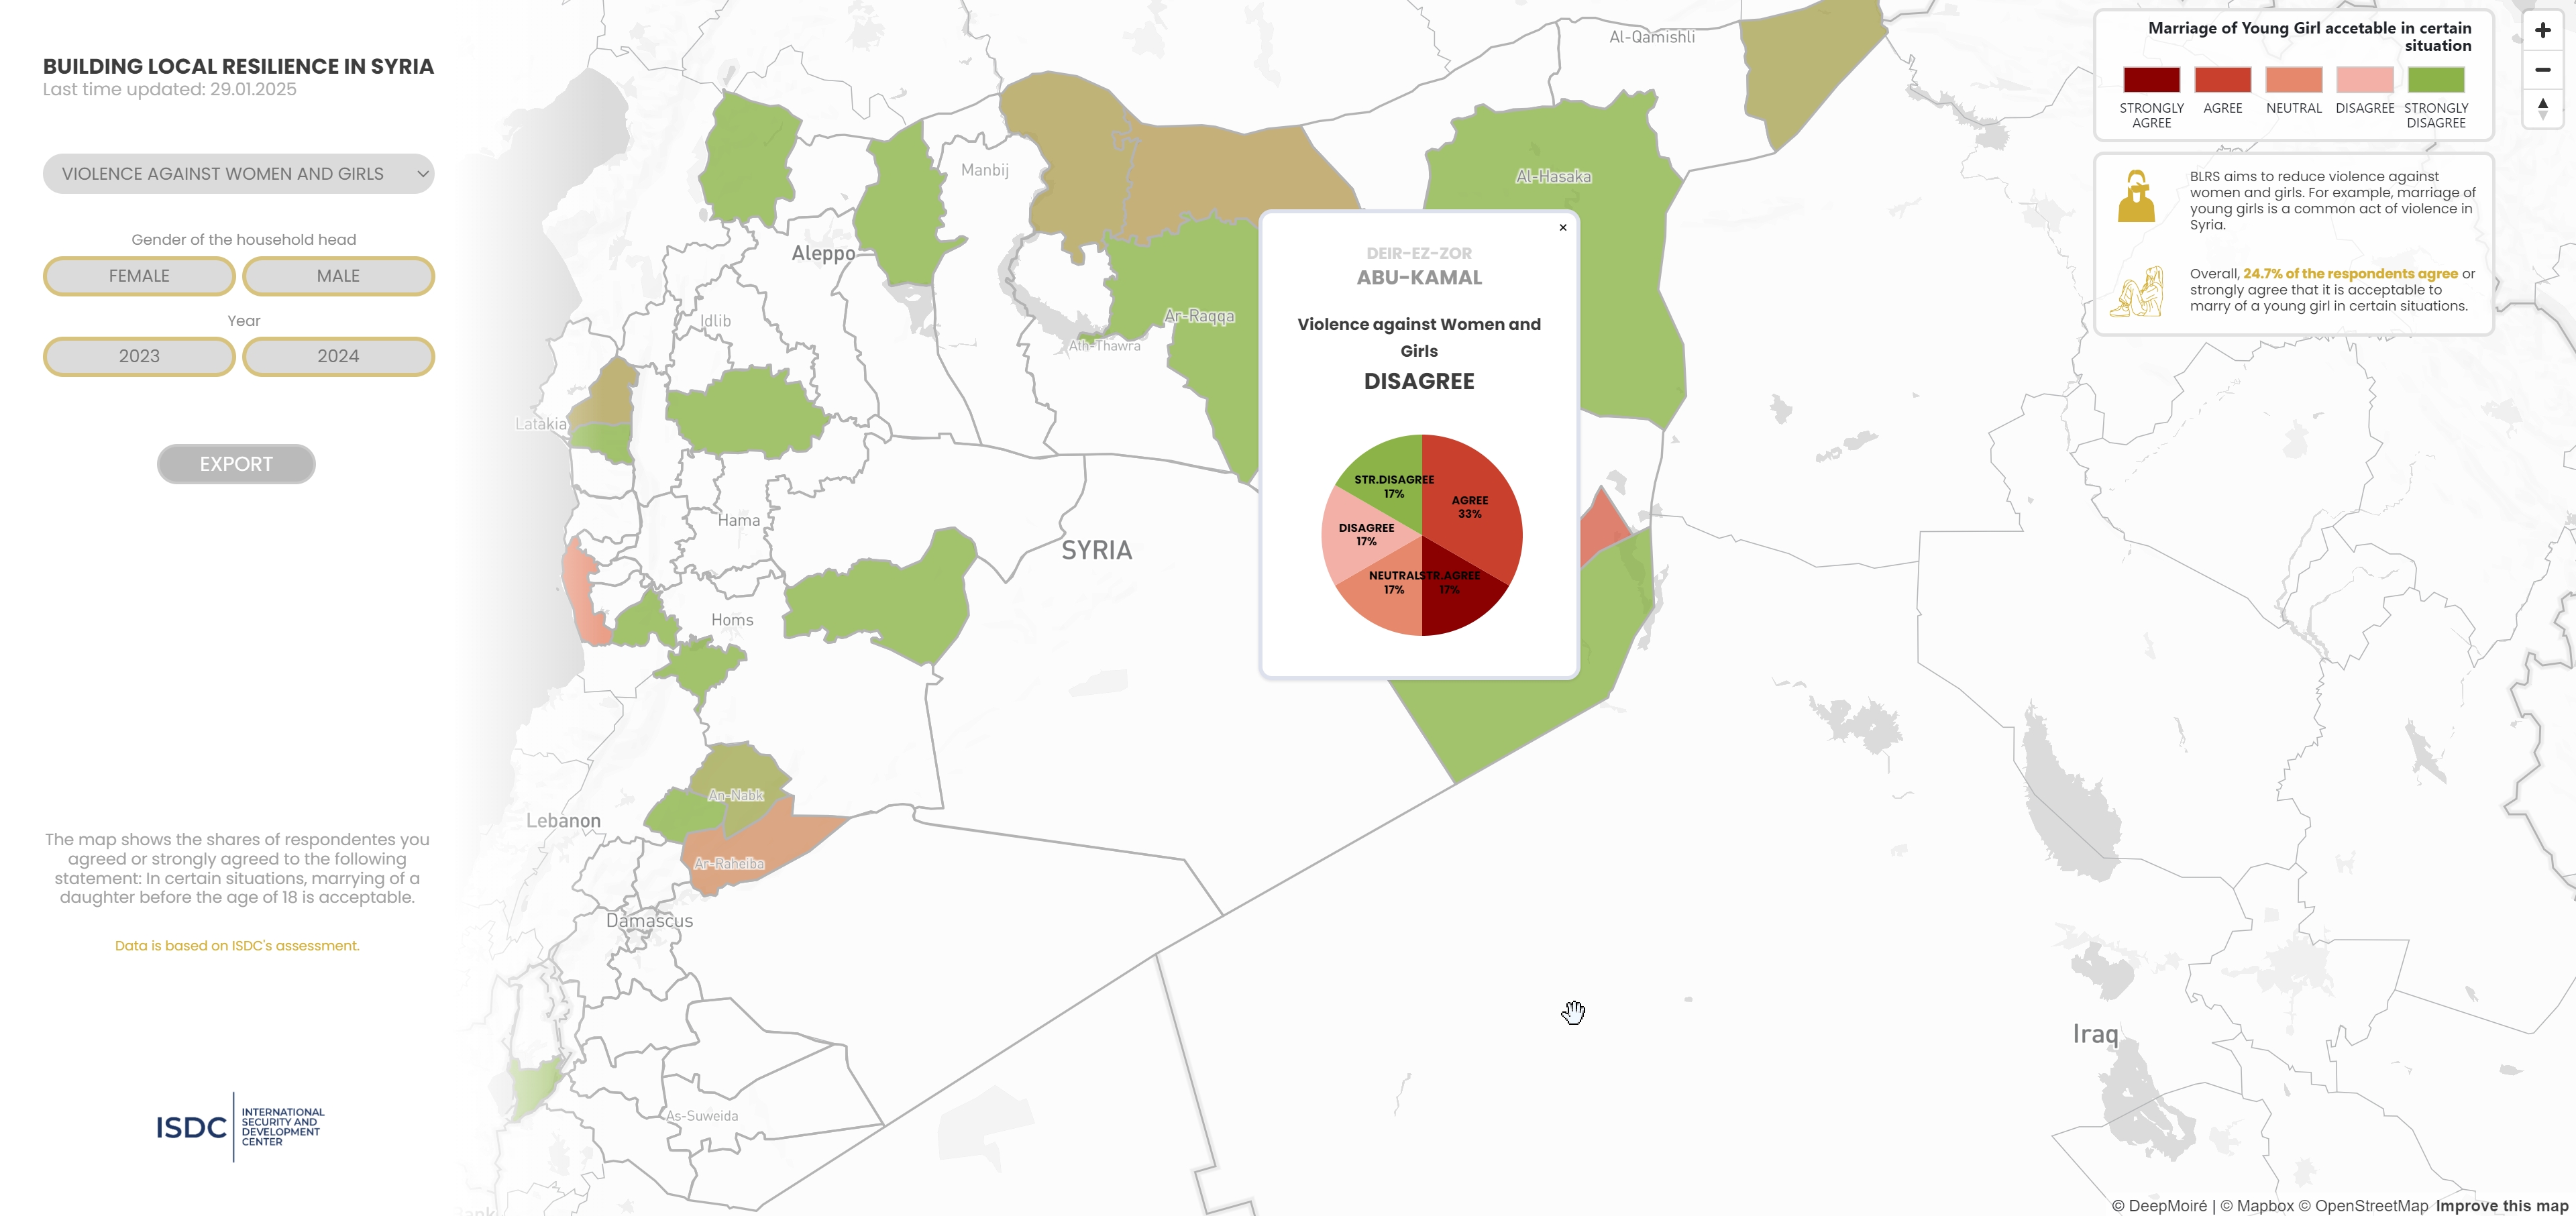
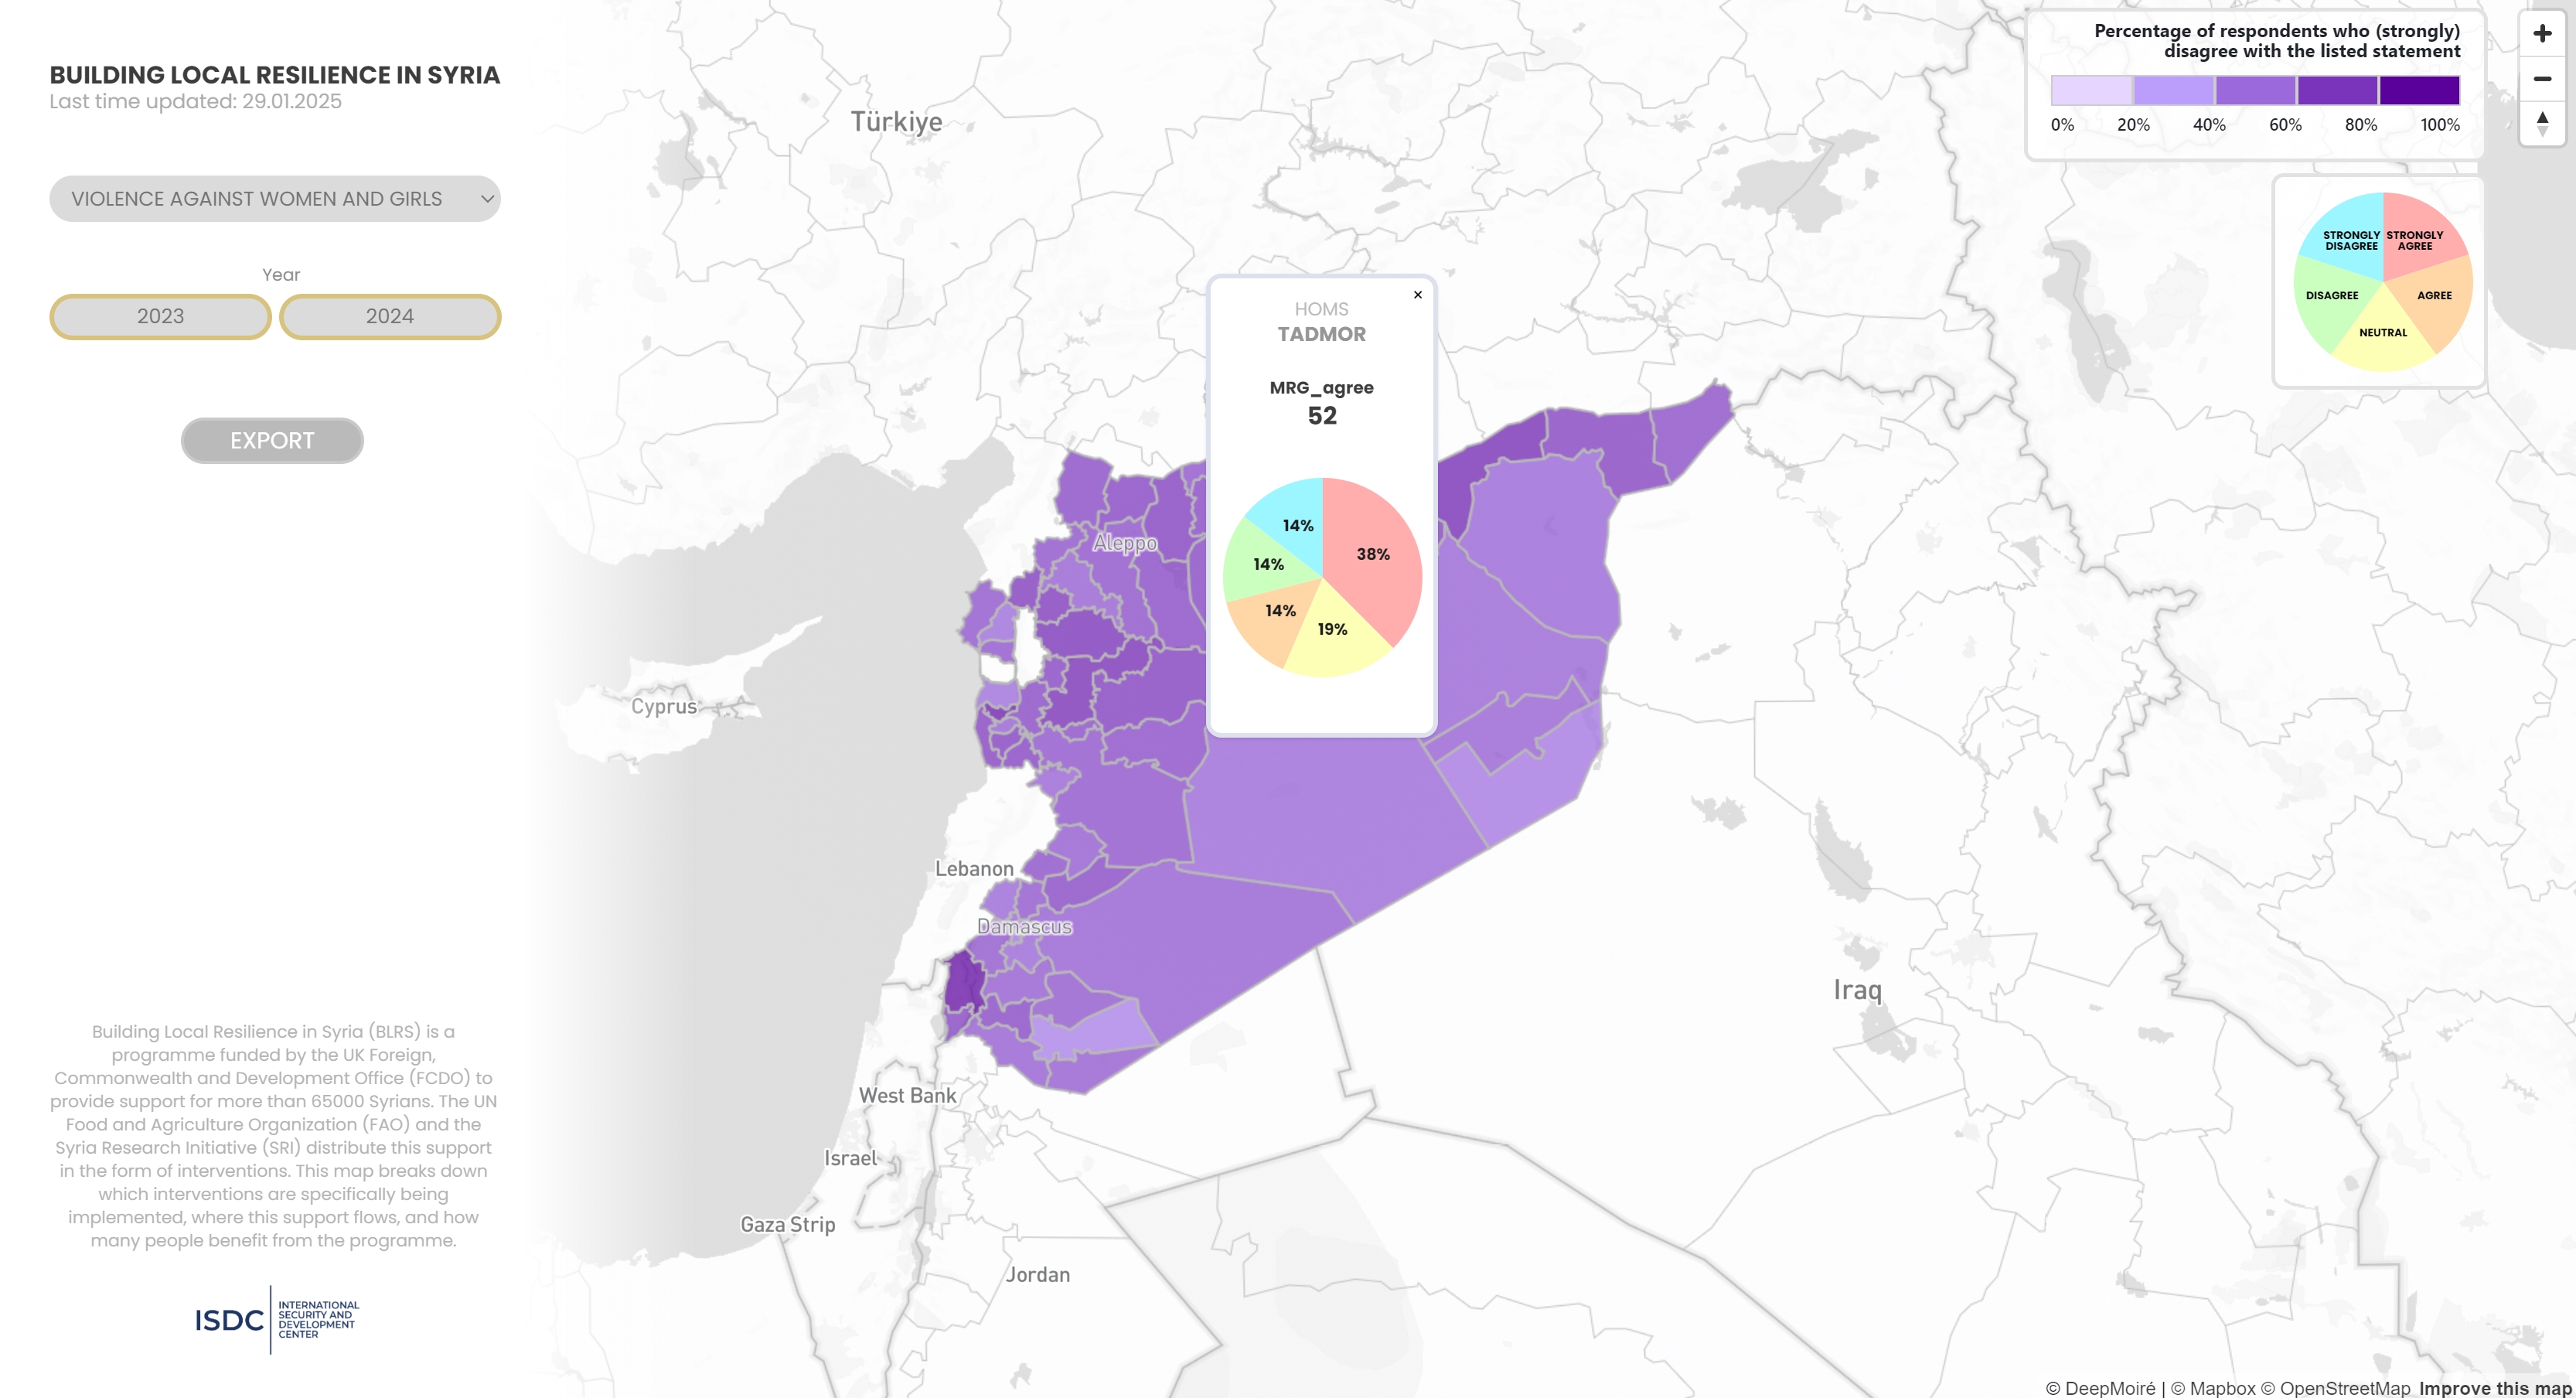
I rebuilt the initial concept as a custom React application centered on an interactive Mapbox district-level map of Syria. Users can move between programme interventions, programme learning and research, food security status, conflict intensity, indicators related to violence against women and girls, and programme partner coverage. Each mode has its own calculation and visualization logic. Intervention views recalculate beneficiary values according to active year and programme filters; food-security and survey views combine choropleth mapping with D3.js distributions in popups; conflict intensity uses district-level fatality counts; and contextual panels, legends, explanatory text, and calculated summaries update with the active analytical view.

Design & Data Visualization
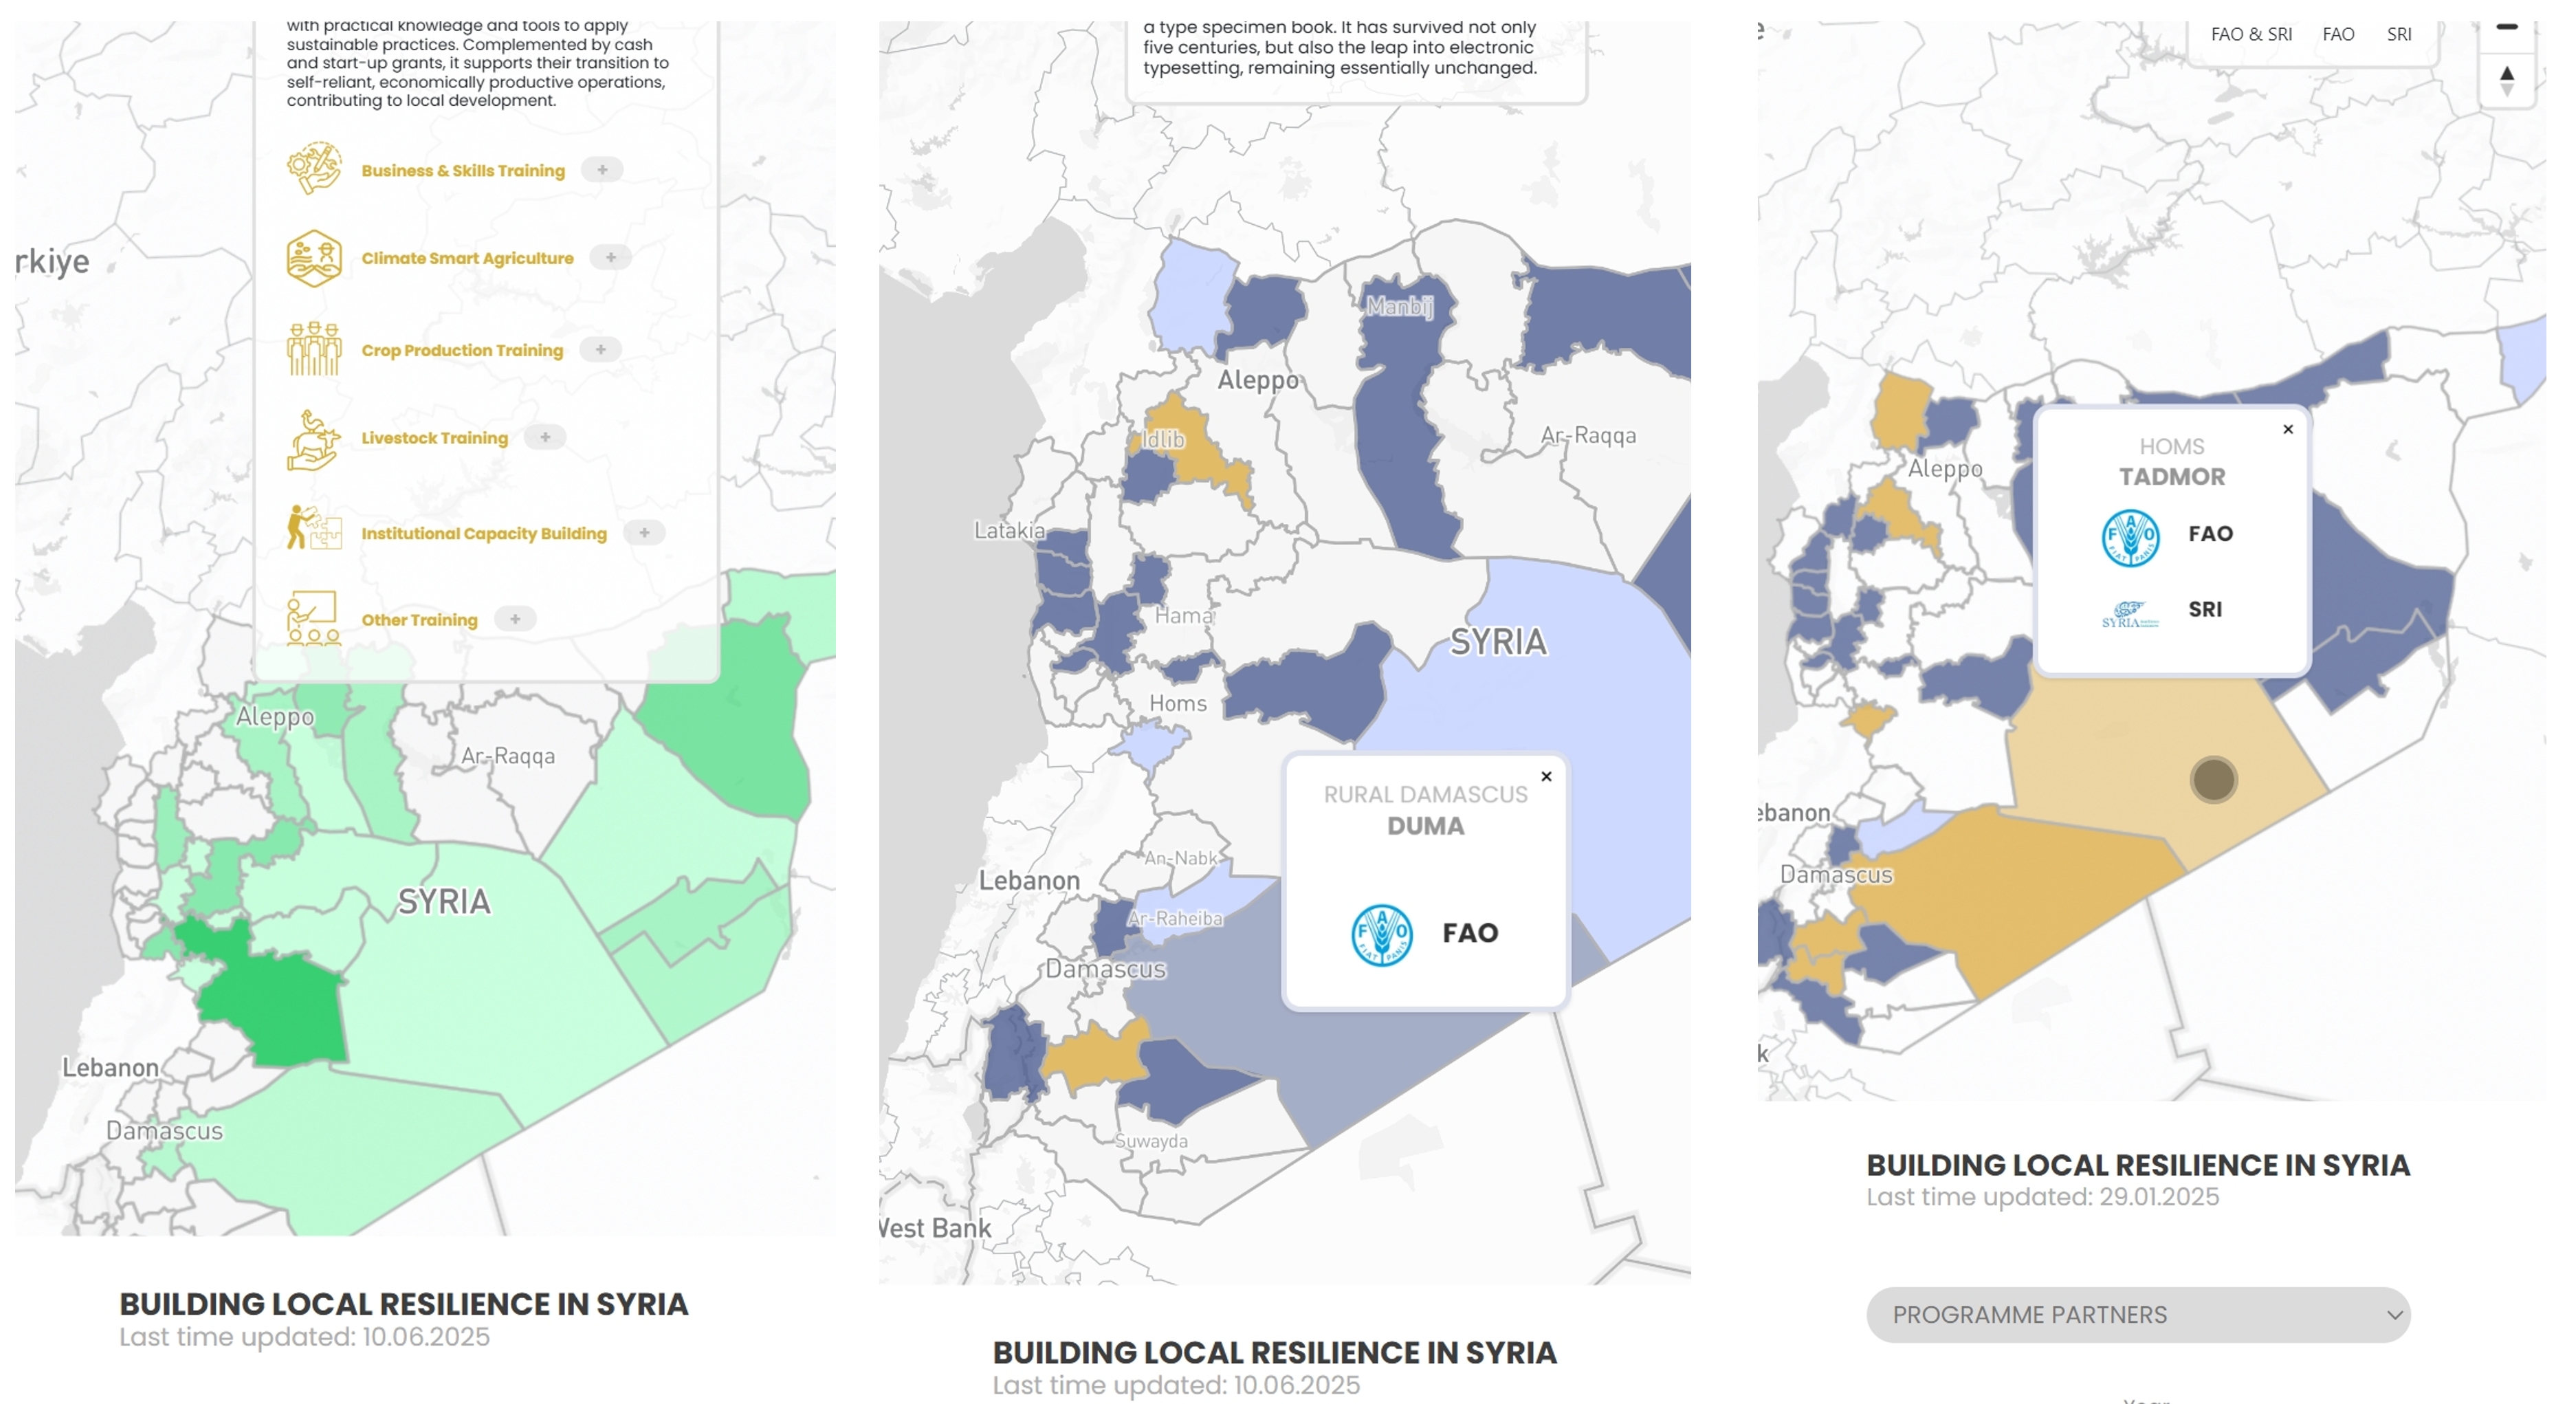
The visualization strategy changes according to the meaning of each indicator rather than applying one generic choropleth treatment. Food-security values use a percentage scale with a green-to-yellow-to-red progression and popup charts separating poor, borderline, and acceptable categories. Conflict intensity uses a continuous scale based on fatalities. Survey indicators combine mapped percentages with five-category response distributions rendered with D3.js. Programme intervention views use beneficiary-based map values and contextual information tied to the selected intervention. The interface also includes responsive adaptations for smaller screens so information panels and controls do not overwhelm the map.
Technical Approach
The frontend was implemented in React, with Mapbox GL JS managing the geographic layers and D3.js handling complementary data visualizations. GeoJSON provides the district geometry while CSV-based datasets supply programme and research variables. Client-side logic applies active filters, calculates derived indicators, aggregates values by geography, updates map styling and legends, and changes contextual interface content according to the selected analytical mode. Year configuration and recurring calculations were structured so additional periods can be incorporated without rebuilding the visualization logic for each year. The delivered application also includes image export of the configured map view.
Technologies
- React
- Mapbox GL JS
- D3.js
- JavaScript
- HTML/CSS
- GeoJSON
- CSV
Data Workflow
A dedicated preprocessing backend was used during the initial data-management stage to inspect, reorganize, normalize, and aggregate the supplied datasets, particularly where updated files introduced multiple rows for the same administrative district. After this initial processing work, recurring calculations were optimized and implemented directly in the React frontend so the browser can derive totals and indicator values from the active year, programme, and analytical selections. This reduced dependence on precomputed total columns and created a more maintainable workflow for future yearly data updates.
Outcome
The finished geospatial dashboard transformed a simple prototype into a multi-layer institutional research interface. Users can explore programme and research indicators through one geographic application, switch between analytical themes, filter the underlying data, compare districts, inspect calculated values and response distributions, and understand how programme activity and selected socioeconomic indicators vary spatially. The reusable calculation and data-update structure also reduces the amount of redevelopment required when additional yearly datasets are introduced.