
Education data / school-performance decision support
School Performance Decision-Support Map & Geospatial Web Application
Overview
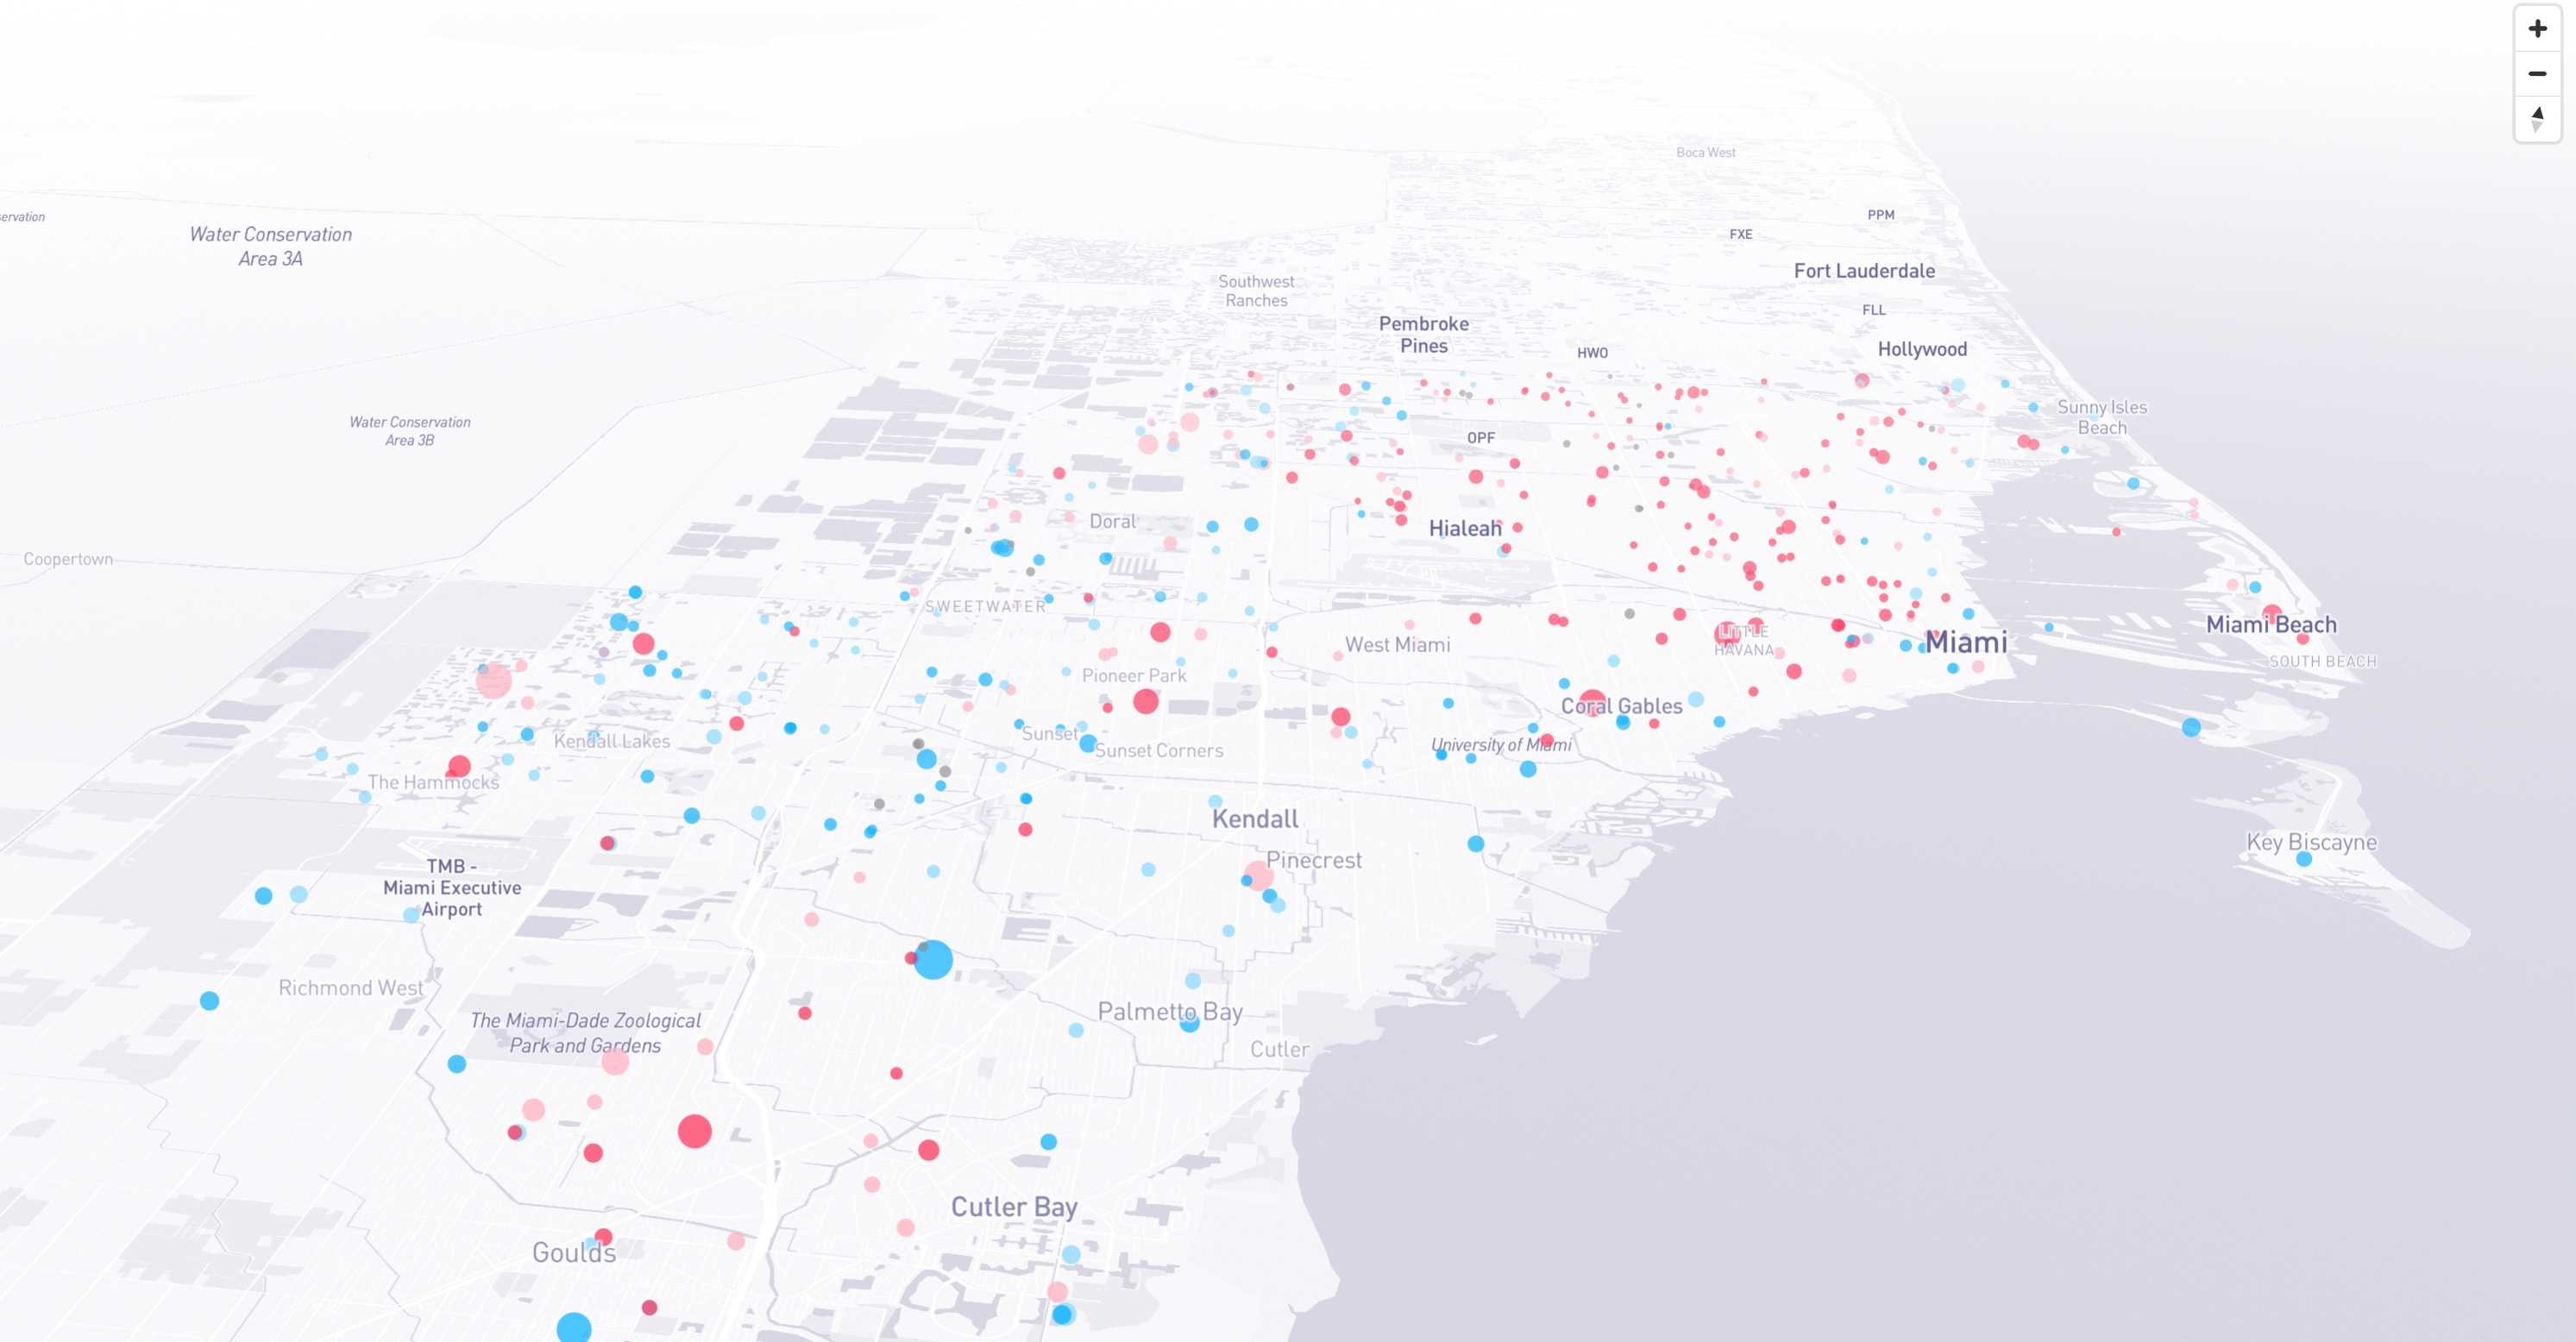
I designed and developed a custom geospatial web application for exploring performance and operational data across more than 500 district-managed and charter public schools.
Built initially for board-level decision-making, the interactive map brings together school achievement, enrollment, utilization, cost per student, school type, district geography, and additional indicators within a single analytical interface.
The finished application was used as a decision-support tool during high-level meetings and continued to serve as an internal analytical resource after its initial deployment.
Challenge
The central challenge was turning a large school-level dataset into an interface that could support both geographic comparison and detailed analytical exploration.
Users needed to identify where stronger- and lower-performing schools were concentrated, compare district-managed and charter schools, explore geographic disparities, and examine how variables such as achievement, enrollment, utilization, and cost per pupil related to one another.
The interface also needed to remain accessible to non-technical users. Rather than exposing the dataset as a dense collection of tables, the application had to provide a clear geographic overview while still allowing users to search for individual schools and progressively isolate relevant subsets of the data.
The scope evolved through several reviewed iterations, adding more advanced search, filtering, and data-maintenance capabilities after the initial working prototype.
Solution
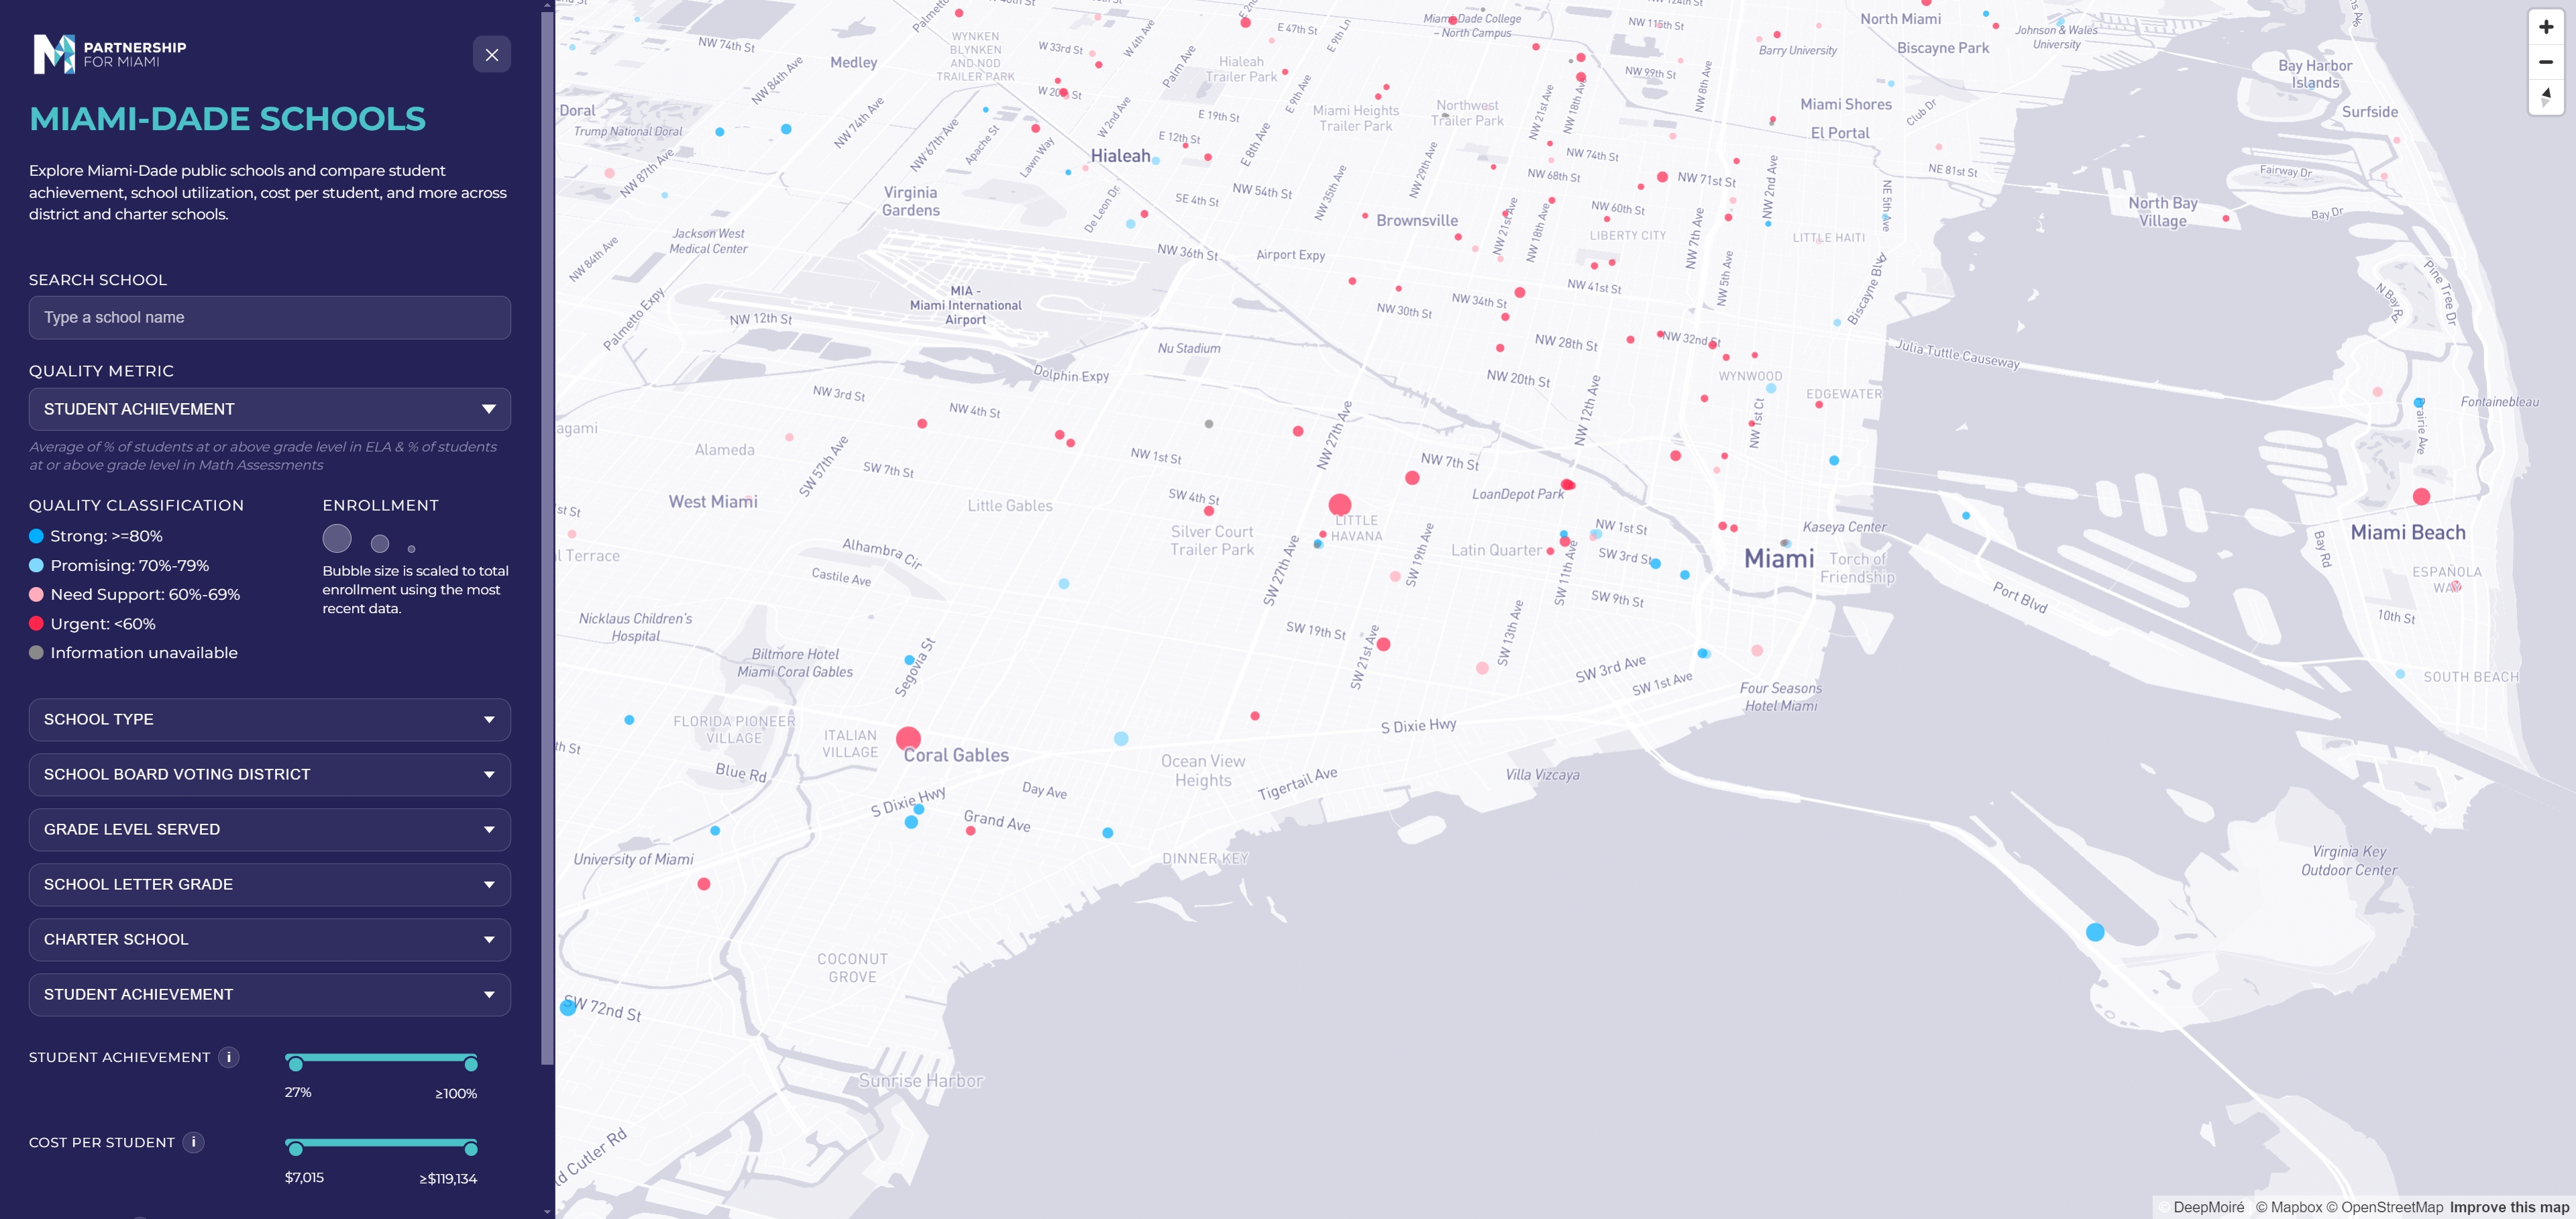
The final application uses a custom Mapbox interface to represent every school geographically and provide several complementary ways of exploring the data.
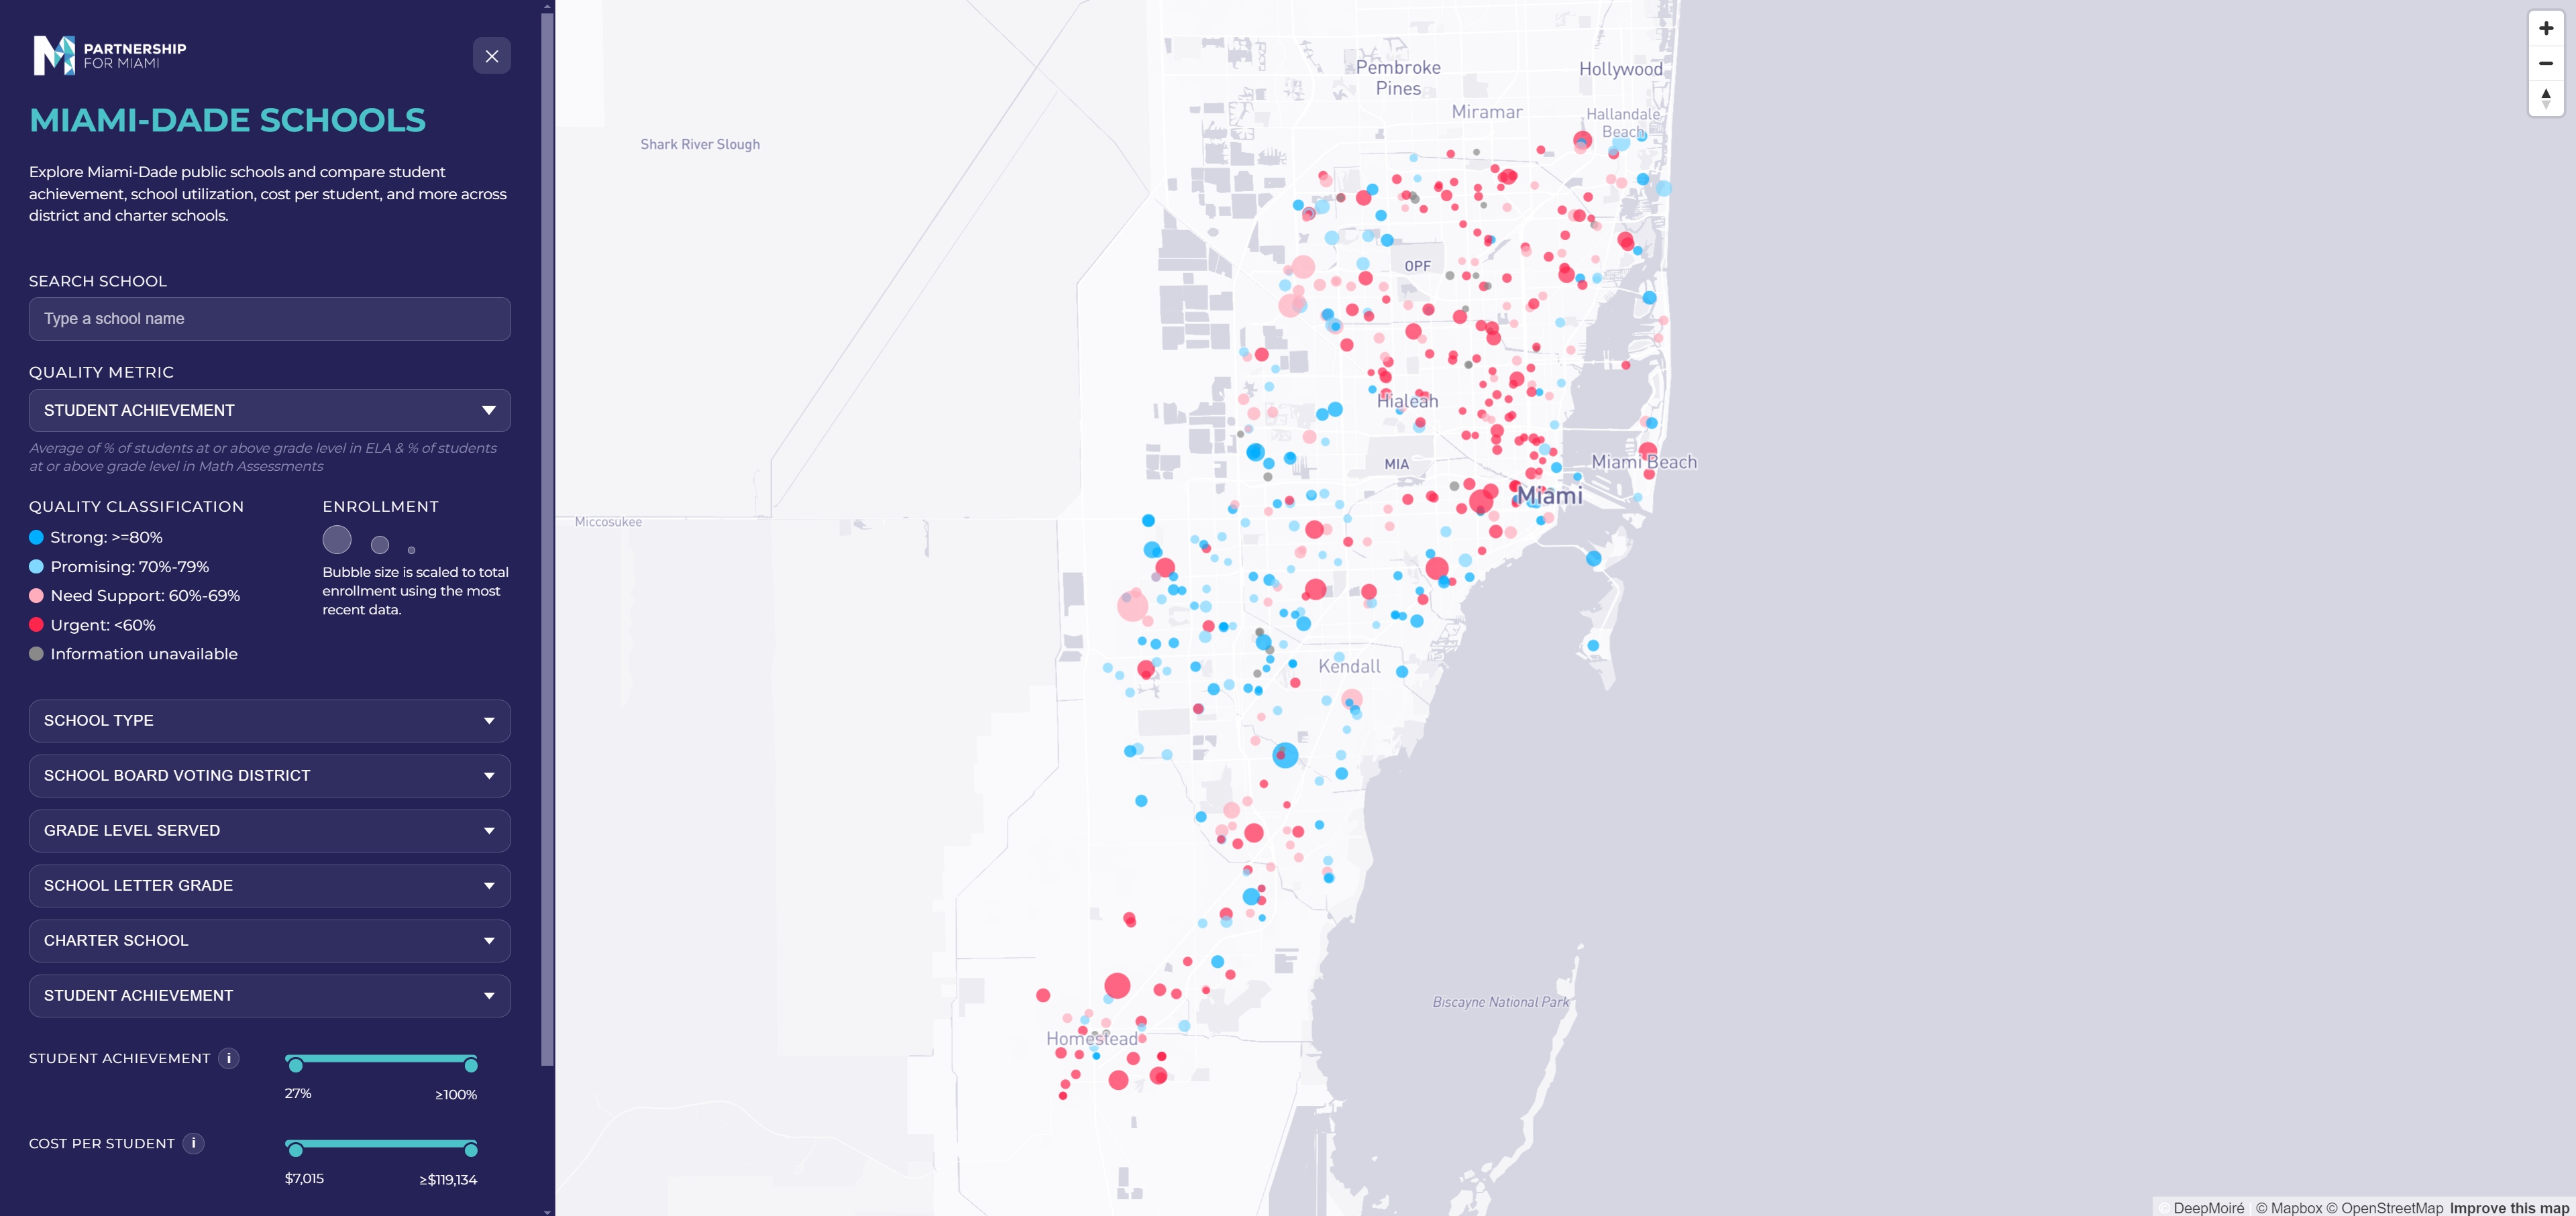
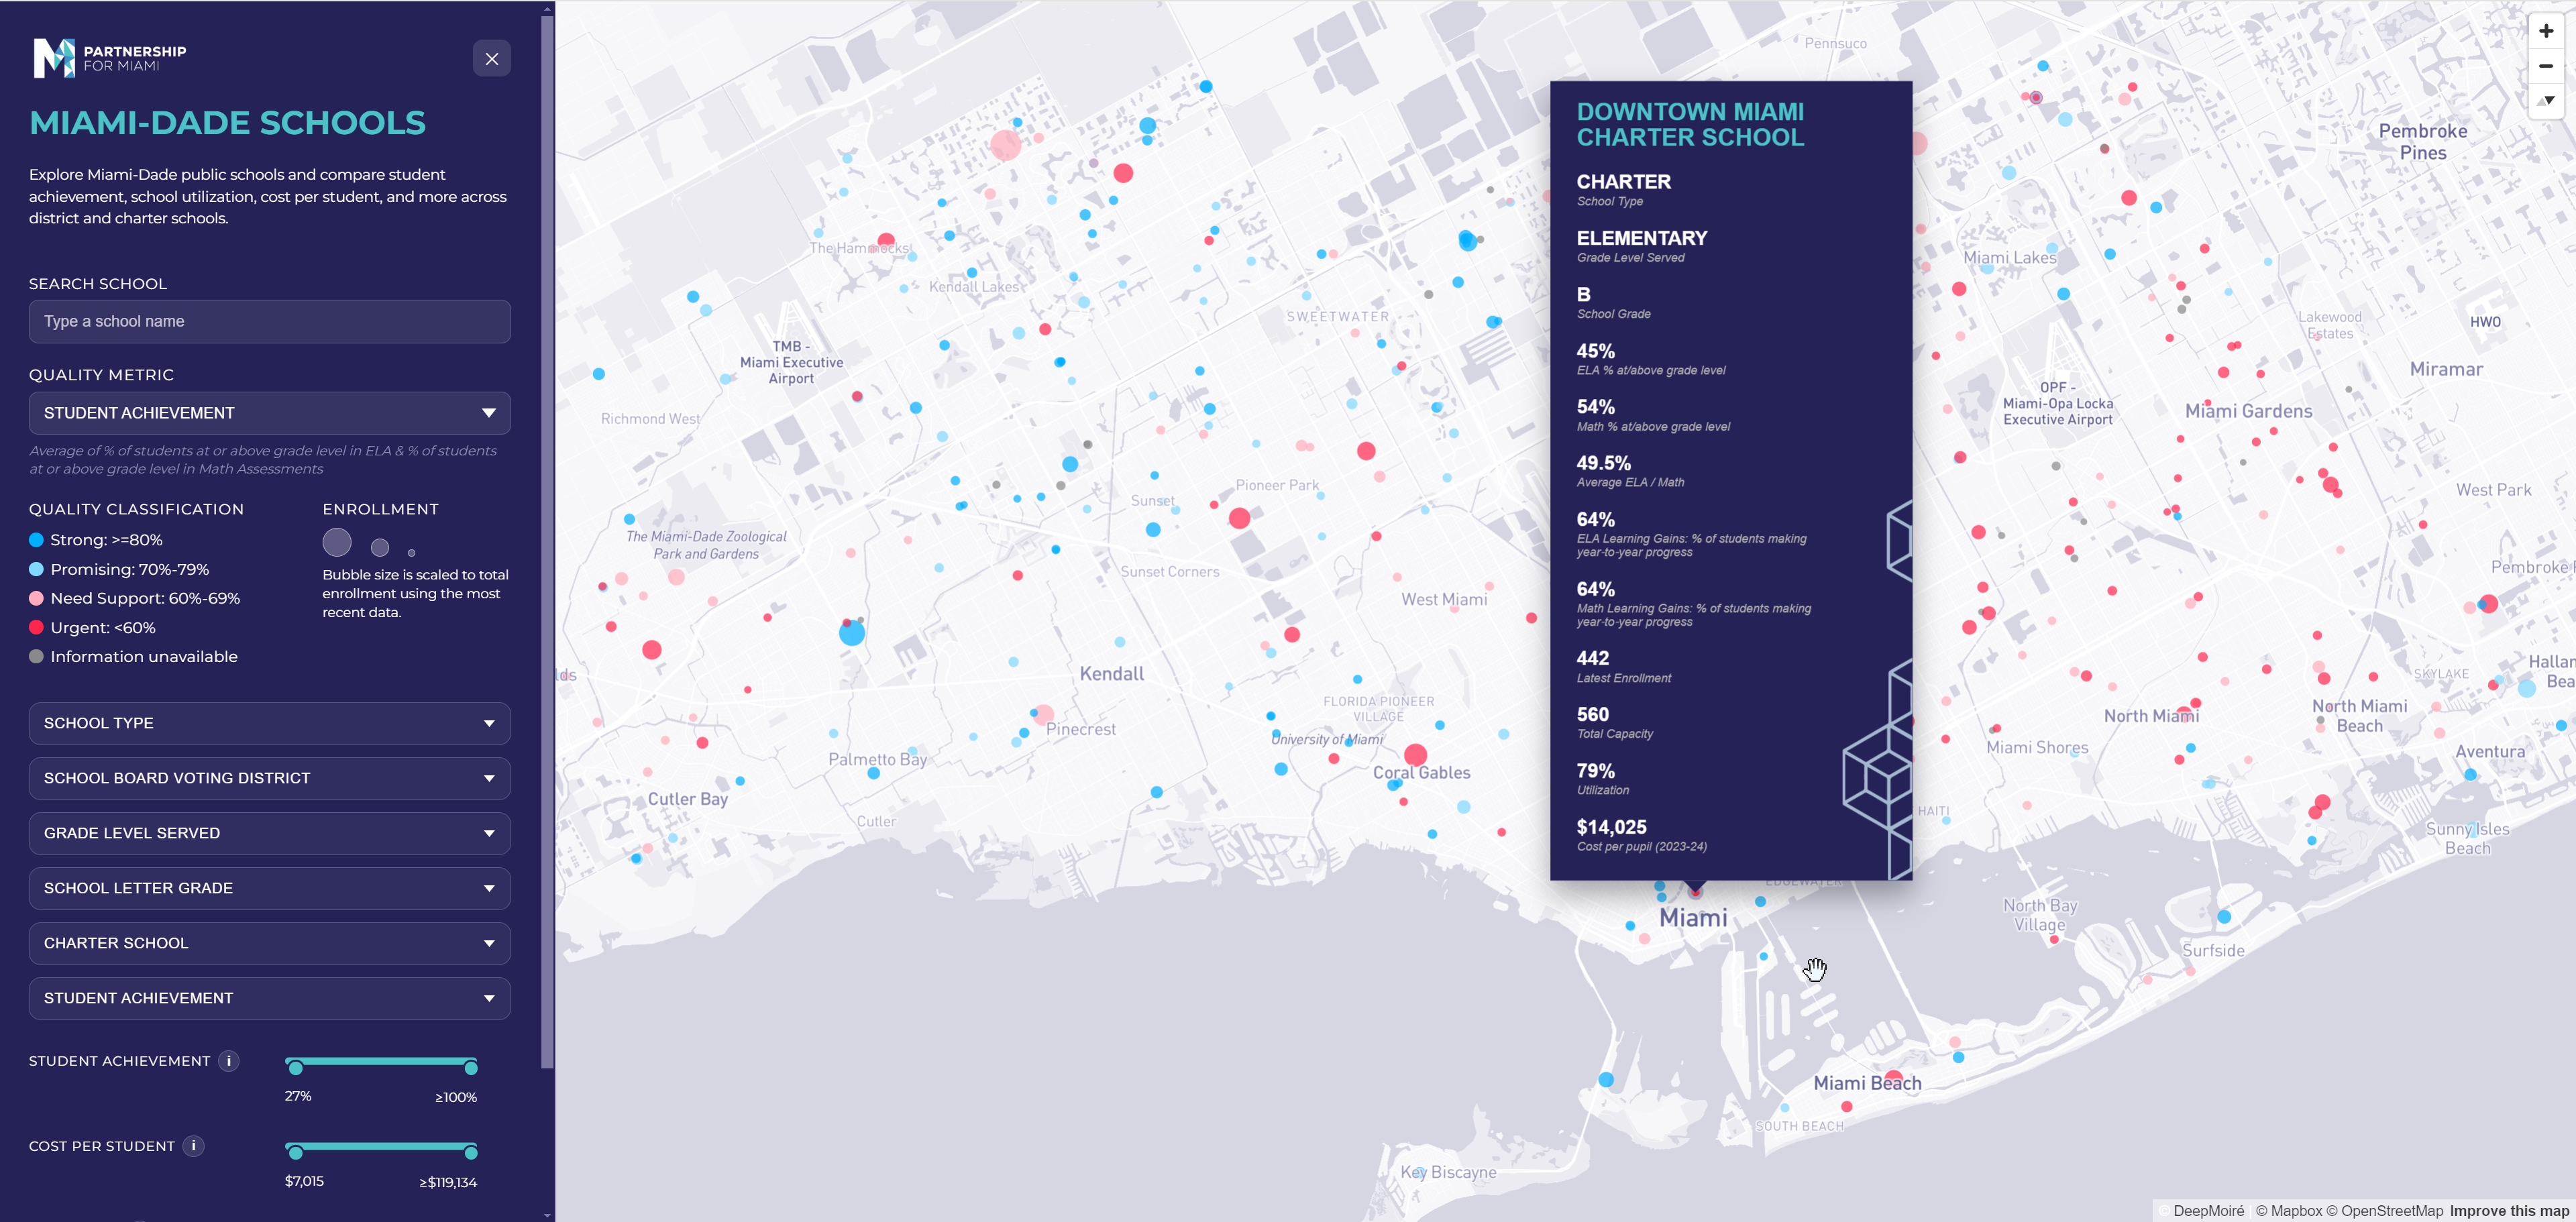
School circles are colored according to student-achievement classification and scaled according to the most recent enrollment data. Users can switch the underlying achievement metric between combined ELA and Math performance, ELA achievement, and Math achievement.
The interface includes categorical filters for school type, school-board voting district, grade level served, school letter grade, charter status, and achievement tier. Continuous range filters allow schools to be further isolated according to achievement, cost per pupil, and utilization.
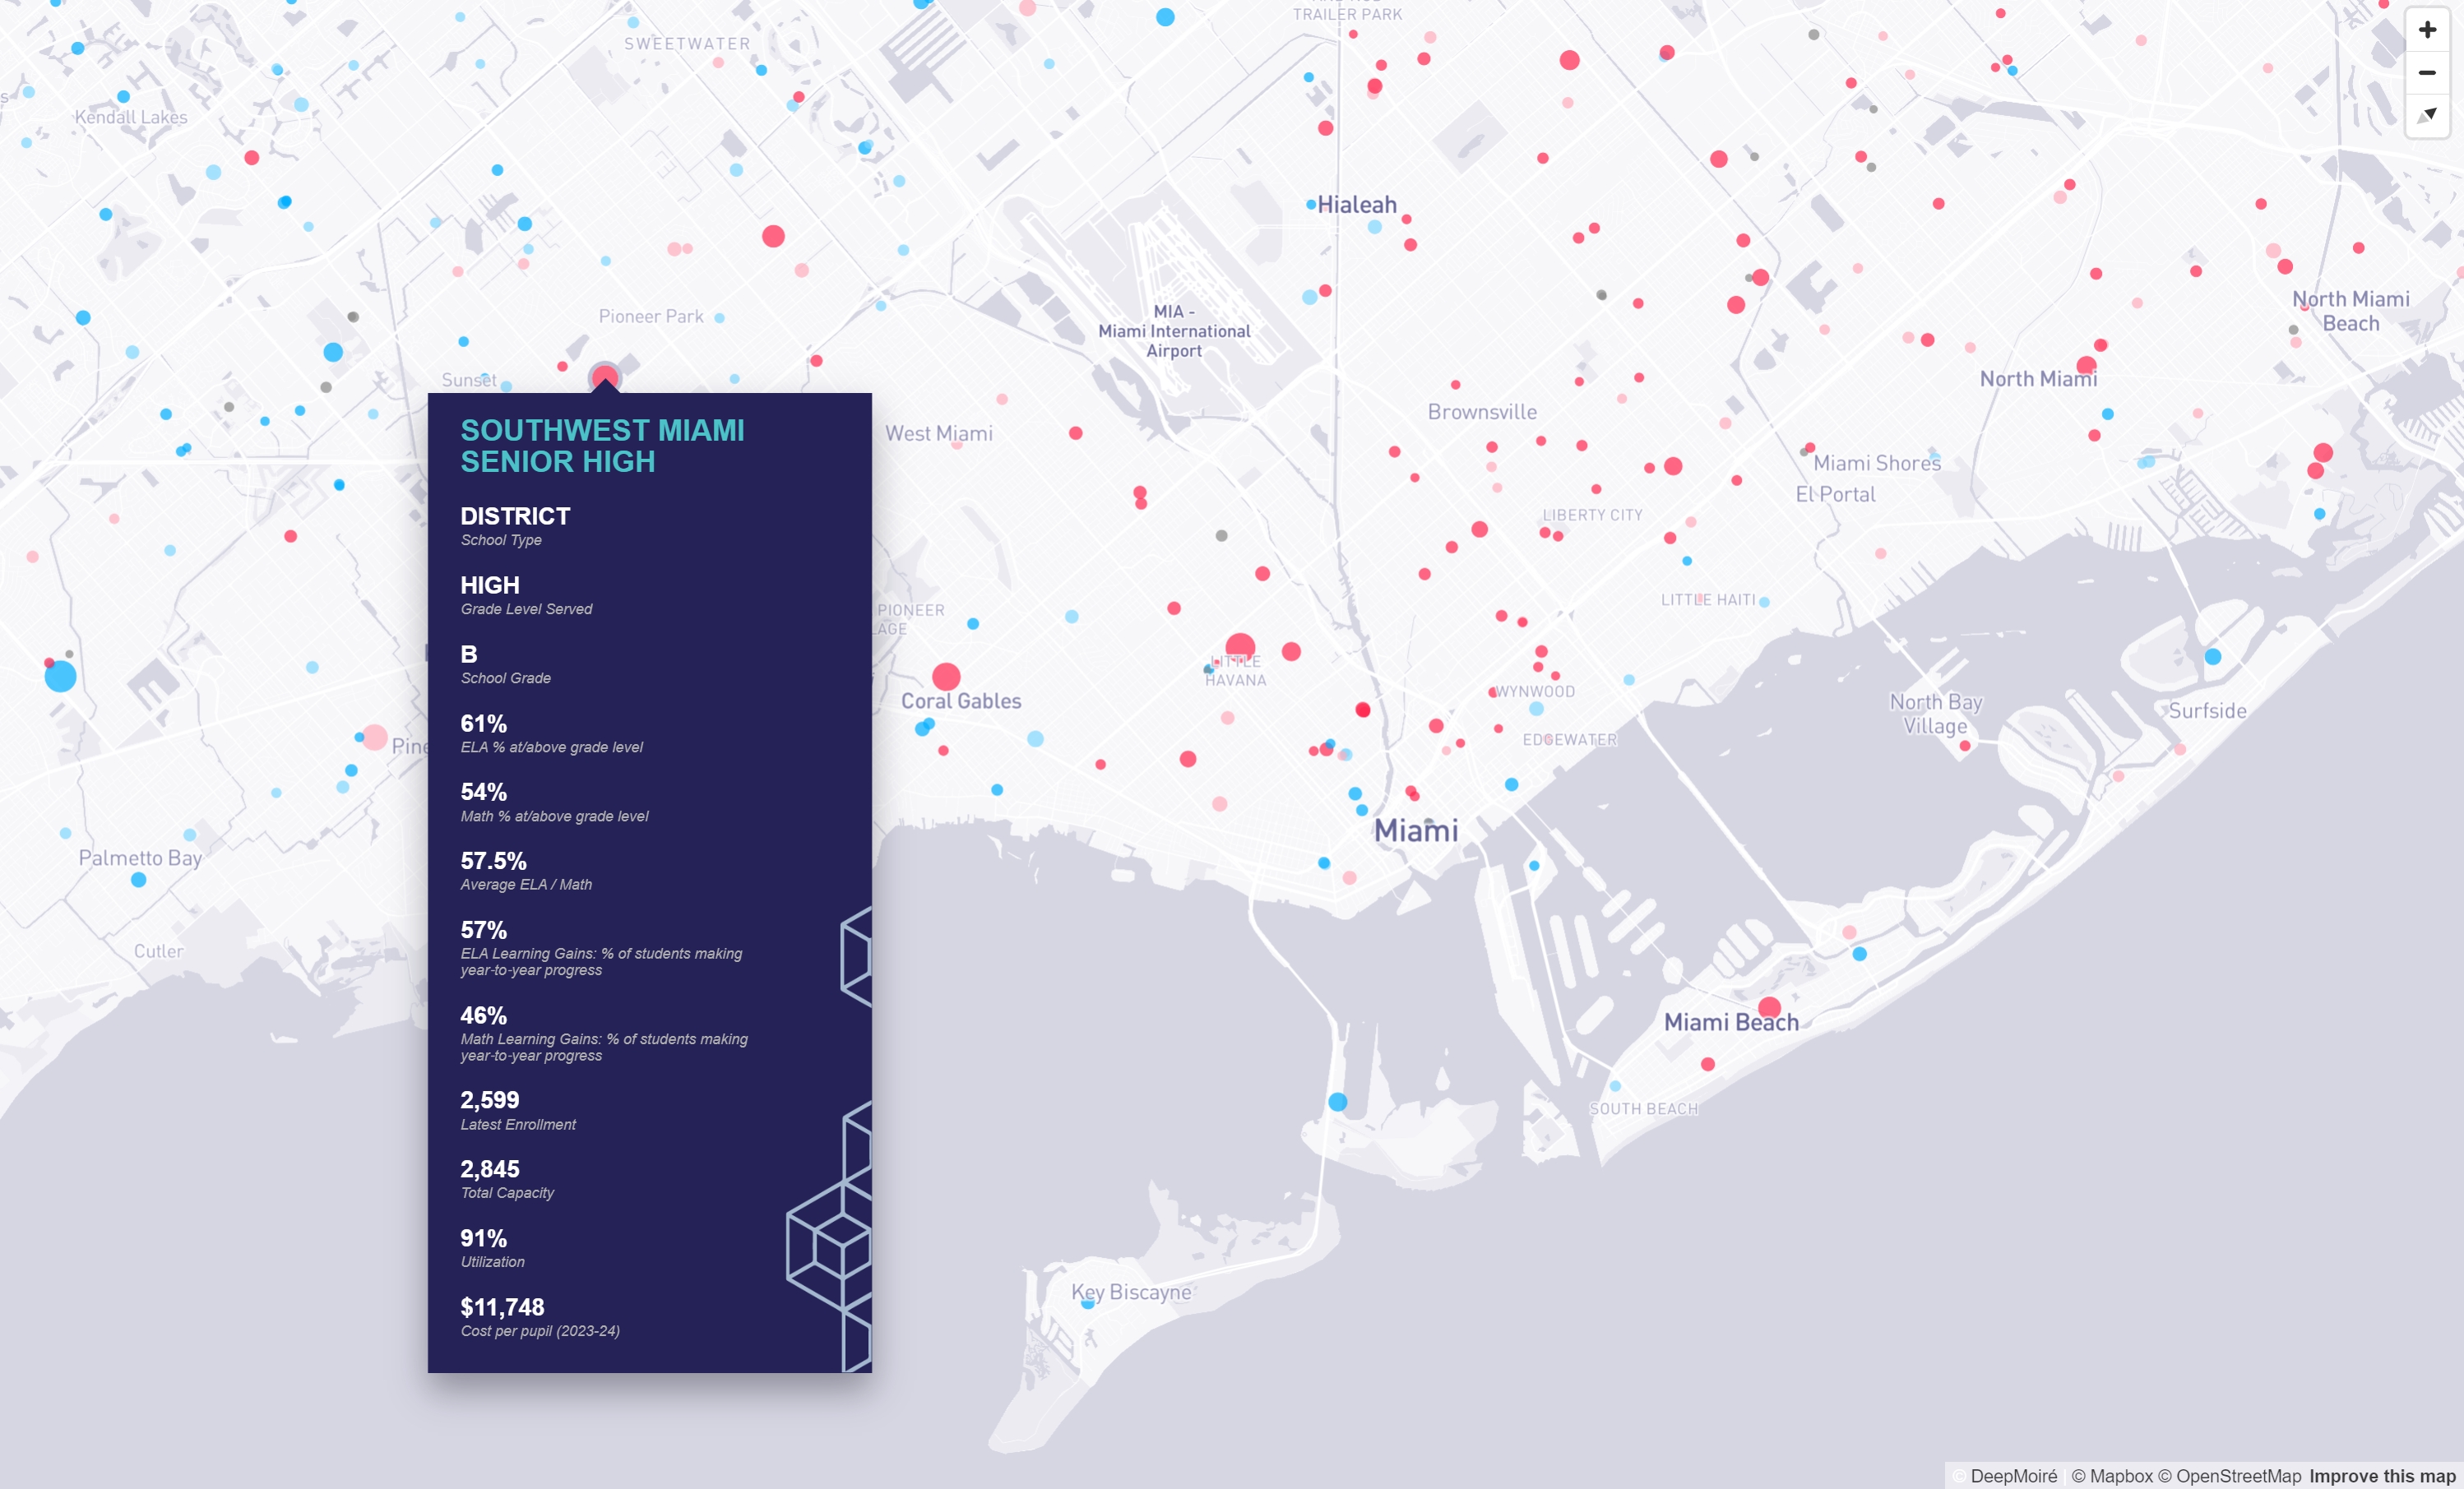
A dedicated search interface provides direct access to individual schools. Selecting a school opens a detailed information panel containing school type, grade level, school grade, ELA and Math achievement, learning gains, latest enrollment, capacity, utilization, and cost-per-pupil data.
School-board district polygons can also be displayed as an additional geographic layer, while custom program highlighting allows selected subsets of schools to be visually identified independently from the main performance classification.
Design & Data Visualization
The visualization strategy separates the variables that need to be immediately visible from those better handled through interaction.
Student achievement forms the main color classification, divided into four performance tiers plus an unavailable-data category. Enrollment is represented through proportional circle size, allowing performance and school scale to be read together directly from the map.
Additional indicators such as utilization and cost per pupil are not simultaneously encoded into the school symbols. Instead, they remain available through range filters and detailed school information, reducing visual density while preserving analytical depth.
The custom side panel brings together school search, metric selection, legends, categorical controls, continuous filters, geographic layers, and additional highlighting functions within a single interface.
The complete map interface, information hierarchy, cartographic treatment, controls, interaction patterns, and responsive layout were designed specifically for the project.
Technical Approach
The application was developed as a standalone HTML, CSS, and JavaScript implementation centered on Mapbox GL JS.
School records are retrieved from the external data source, parsed with Papa Parse, validated, and converted into GeoJSON point features in the browser. Mapbox expressions control dynamic symbol colors, proportional sizing, filtering, selection states, and custom highlights.
School-board districts are loaded separately as GeoJSON polygon data and synchronized with the corresponding filter controls.
Additional JavaScript logic manages school search, dynamically generated filter options, range filtering, achievement-metric switching, responsive legends, overlapping-coordinate adjustment, selected-school states, automatic annual-field detection, and externally maintained district information.
The application was packaged as an independent browser-based tool that could also be incorporated into a wider web environment.
Technologies
- Mapbox GL JS
- JavaScript
- HTML/CSS
- Papa Parse
- GeoJSON
- Google Sheets
- CSV
Data Workflow
A key part of the application was designing the map around a maintainable external data source rather than a fixed project export.
The school dataset is maintained through Google Sheets and retrieved by the application as CSV. The browser processes the incoming records and converts valid schools into geographic features used by the Mapbox visualization.
For fields that change annually—including enrollment, ELA achievement, Math achievement, combined achievement, learning gains, and utilization—the application automatically detects the most recent reporting year from the column names.
As a result, new yearly information can be added to the established spreadsheet structure and automatically become the active dataset without requiring corresponding changes to the JavaScript application.
A separate externally maintained table controls school-board member information, allowing those values to be updated independently from the district boundary geometries.
This data architecture reduced the need for ongoing code intervention and allowed routine updates to remain under the control of the team maintaining the source data.
Outcome
The completed geospatial web application was used as a decision-support tool in board-level discussions and continued to function as an internal analytical resource afterwards.
Users can move from a system-wide geographic overview to individual school records, search for specific institutions, combine multiple categorical and numerical filters, compare achievement measures, inspect district geography, and investigate detailed school indicators without moving between separate spreadsheets or static reports.
The maintainable data workflow also extends the useful life of the application beyond the dataset available at launch. New annual information can be introduced through the existing source-data structure and automatically recognized by the application without requiring routine redevelopment.