
Energy consulting / global power-generation analysis
PostGIS Power Plant Database & Vector Tile WebGIS
Overview
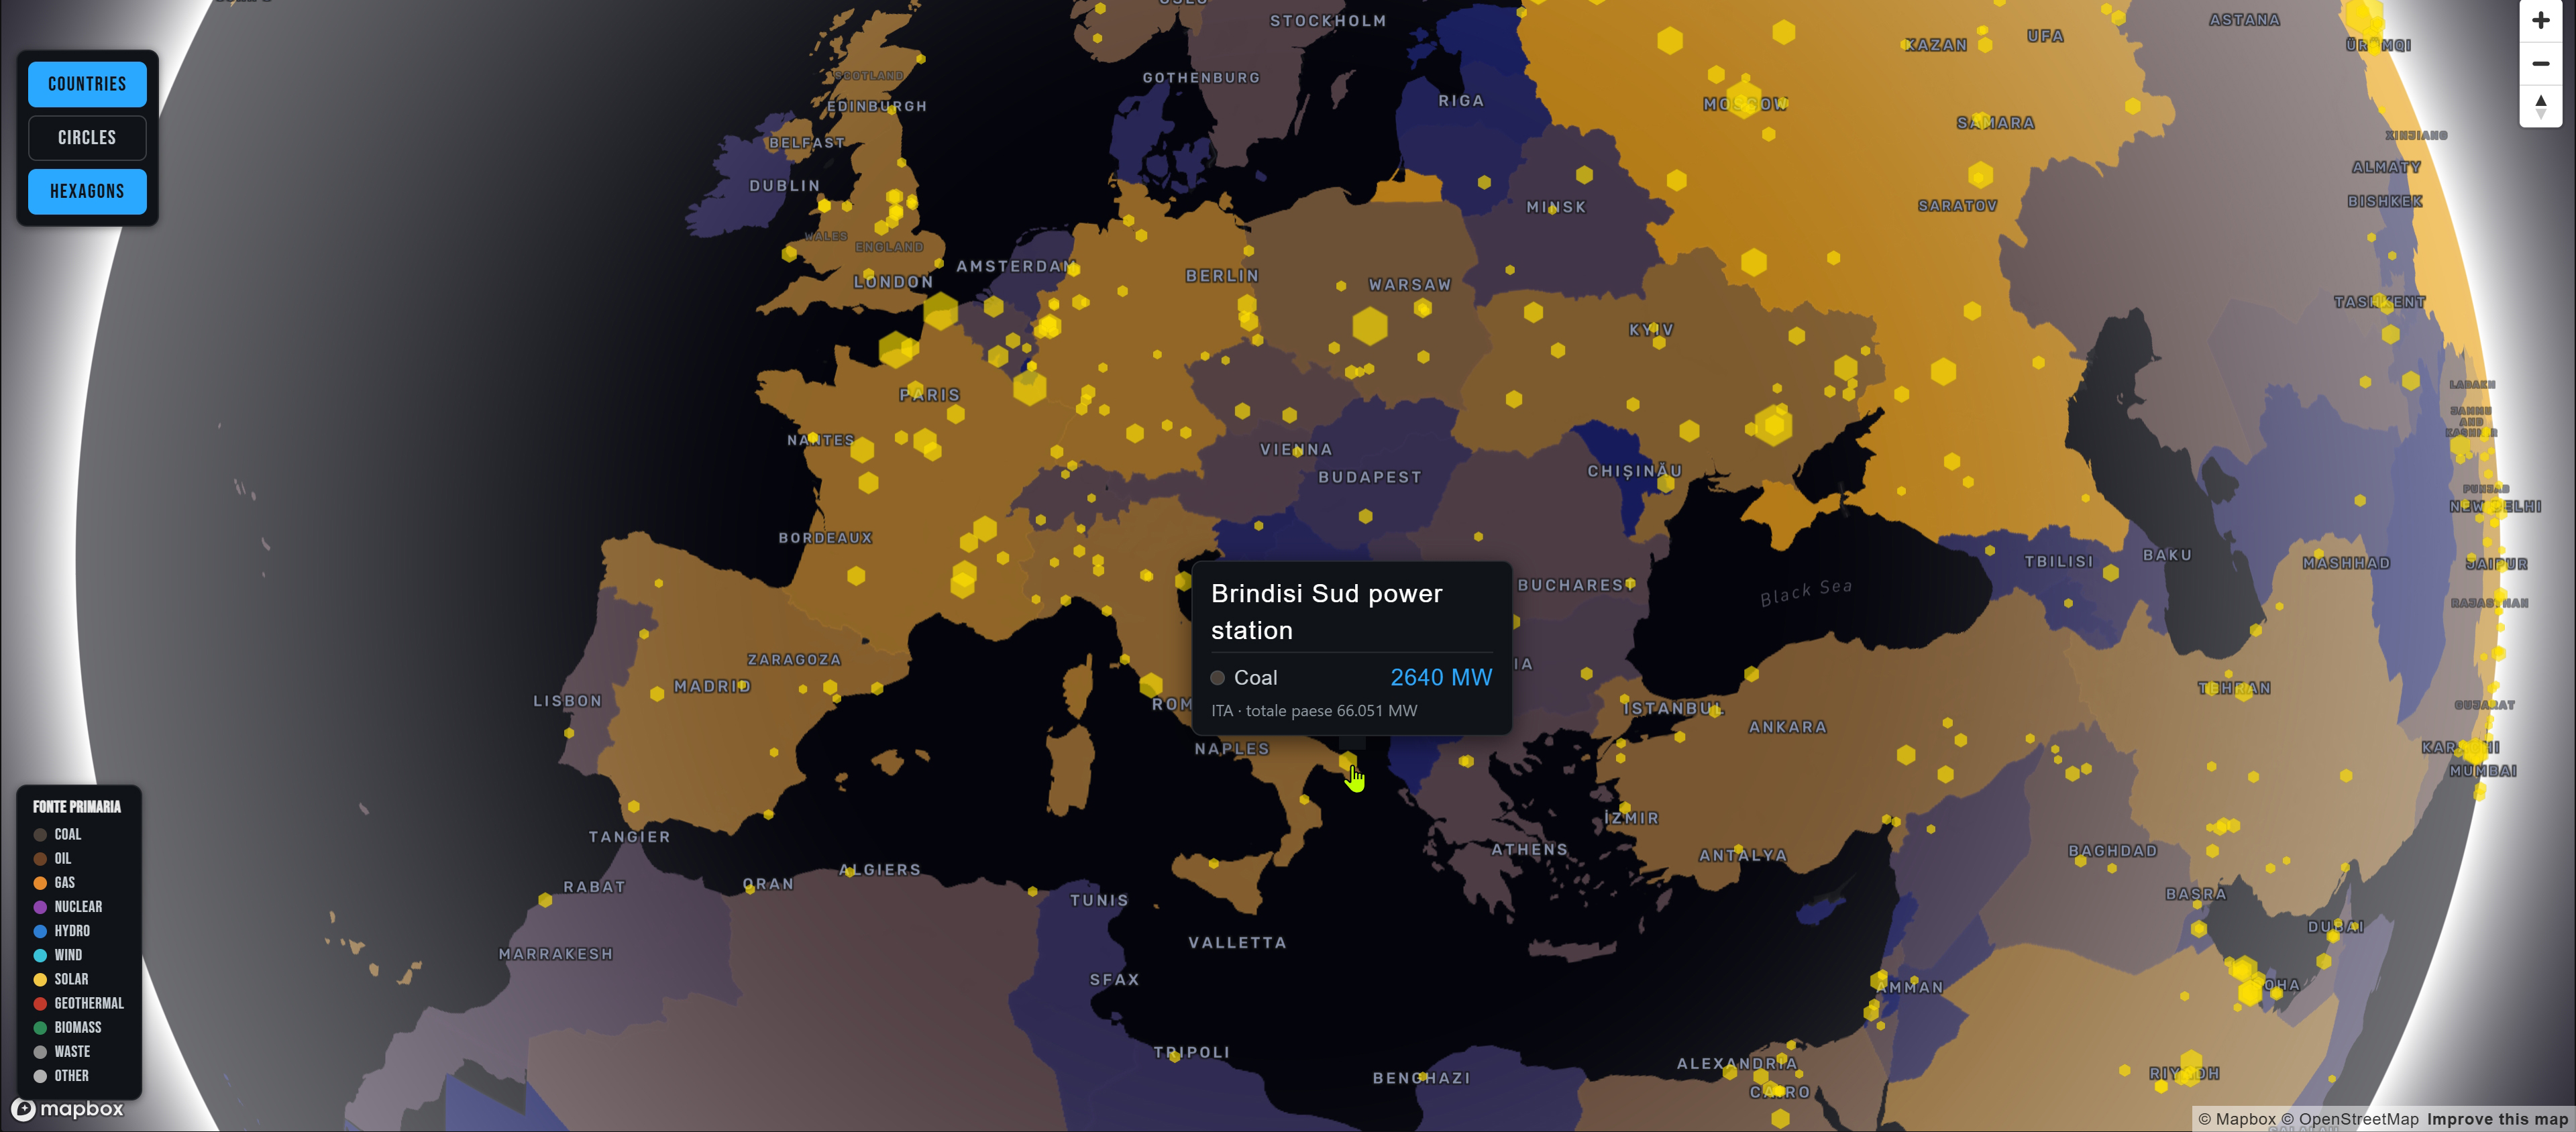
I developed a PostGIS spatial database and WebGIS application for an Italian energy consulting company to analyze the global distribution and characteristics of power-generation infrastructure. The system transformed a public dataset of 34,936 power plants into a PostgreSQL and PostGIS database, combined it with national boundaries, calculated country-level statistics, and exposed the results through a React and Mapbox GL JS interactive map.
The project established the technical and analytical baseline for a broader platform in which the existing power-generation landscape could later be compared with the company's own projects and development opportunities.
Challenge
The source dataset was a 36-column CSV containing coordinates, generating capacity, primary fuel, commissioning year, ownership information, and historical generation attributes. Although every facility included a textual country code, the data had no spatial database structure and could not support geometric validation, indexed spatial queries, or server-side geographic aggregation.
The application also had to operate at two geographic levels. Individual power plants needed to remain available as point features, while the same records had to be aggregated by country to provide plant counts, total installed capacity, and commissioning-year ranges. Sending the entire dataset to the browser as GeoJSON would have transferred data processing and density management to the frontend instead of using the spatial database.
Solution
I created a managed PostgreSQL database in Supabase and enabled PostGIS to add geometry types, spatial functions, and geographic indexing. The source records were loaded into a table in which longitude and latitude values were converted into geometry(Point, 4326) features. A second indexed table stored 242 Natural Earth country boundaries as normalized MultiPolygon geometries.
The datasets were connected through an ST_Intersects point-in-polygon spatial join. This produced a geometrically derived country assignment for each plant and supported comparisons with the country codes in the original CSV. Country-level plant counts, installed capacity, and commissioning-year ranges were stored in a materialized view.
Two PostGIS functions then generated Mapbox Vector Tiles dynamically: one for individual power plants and another for country polygons with aggregated statistics. A FastAPI service exposed the functions through z/x/y tile endpoints, while the React frontend consumed the resulting vector sources.
Design & Data Visualization
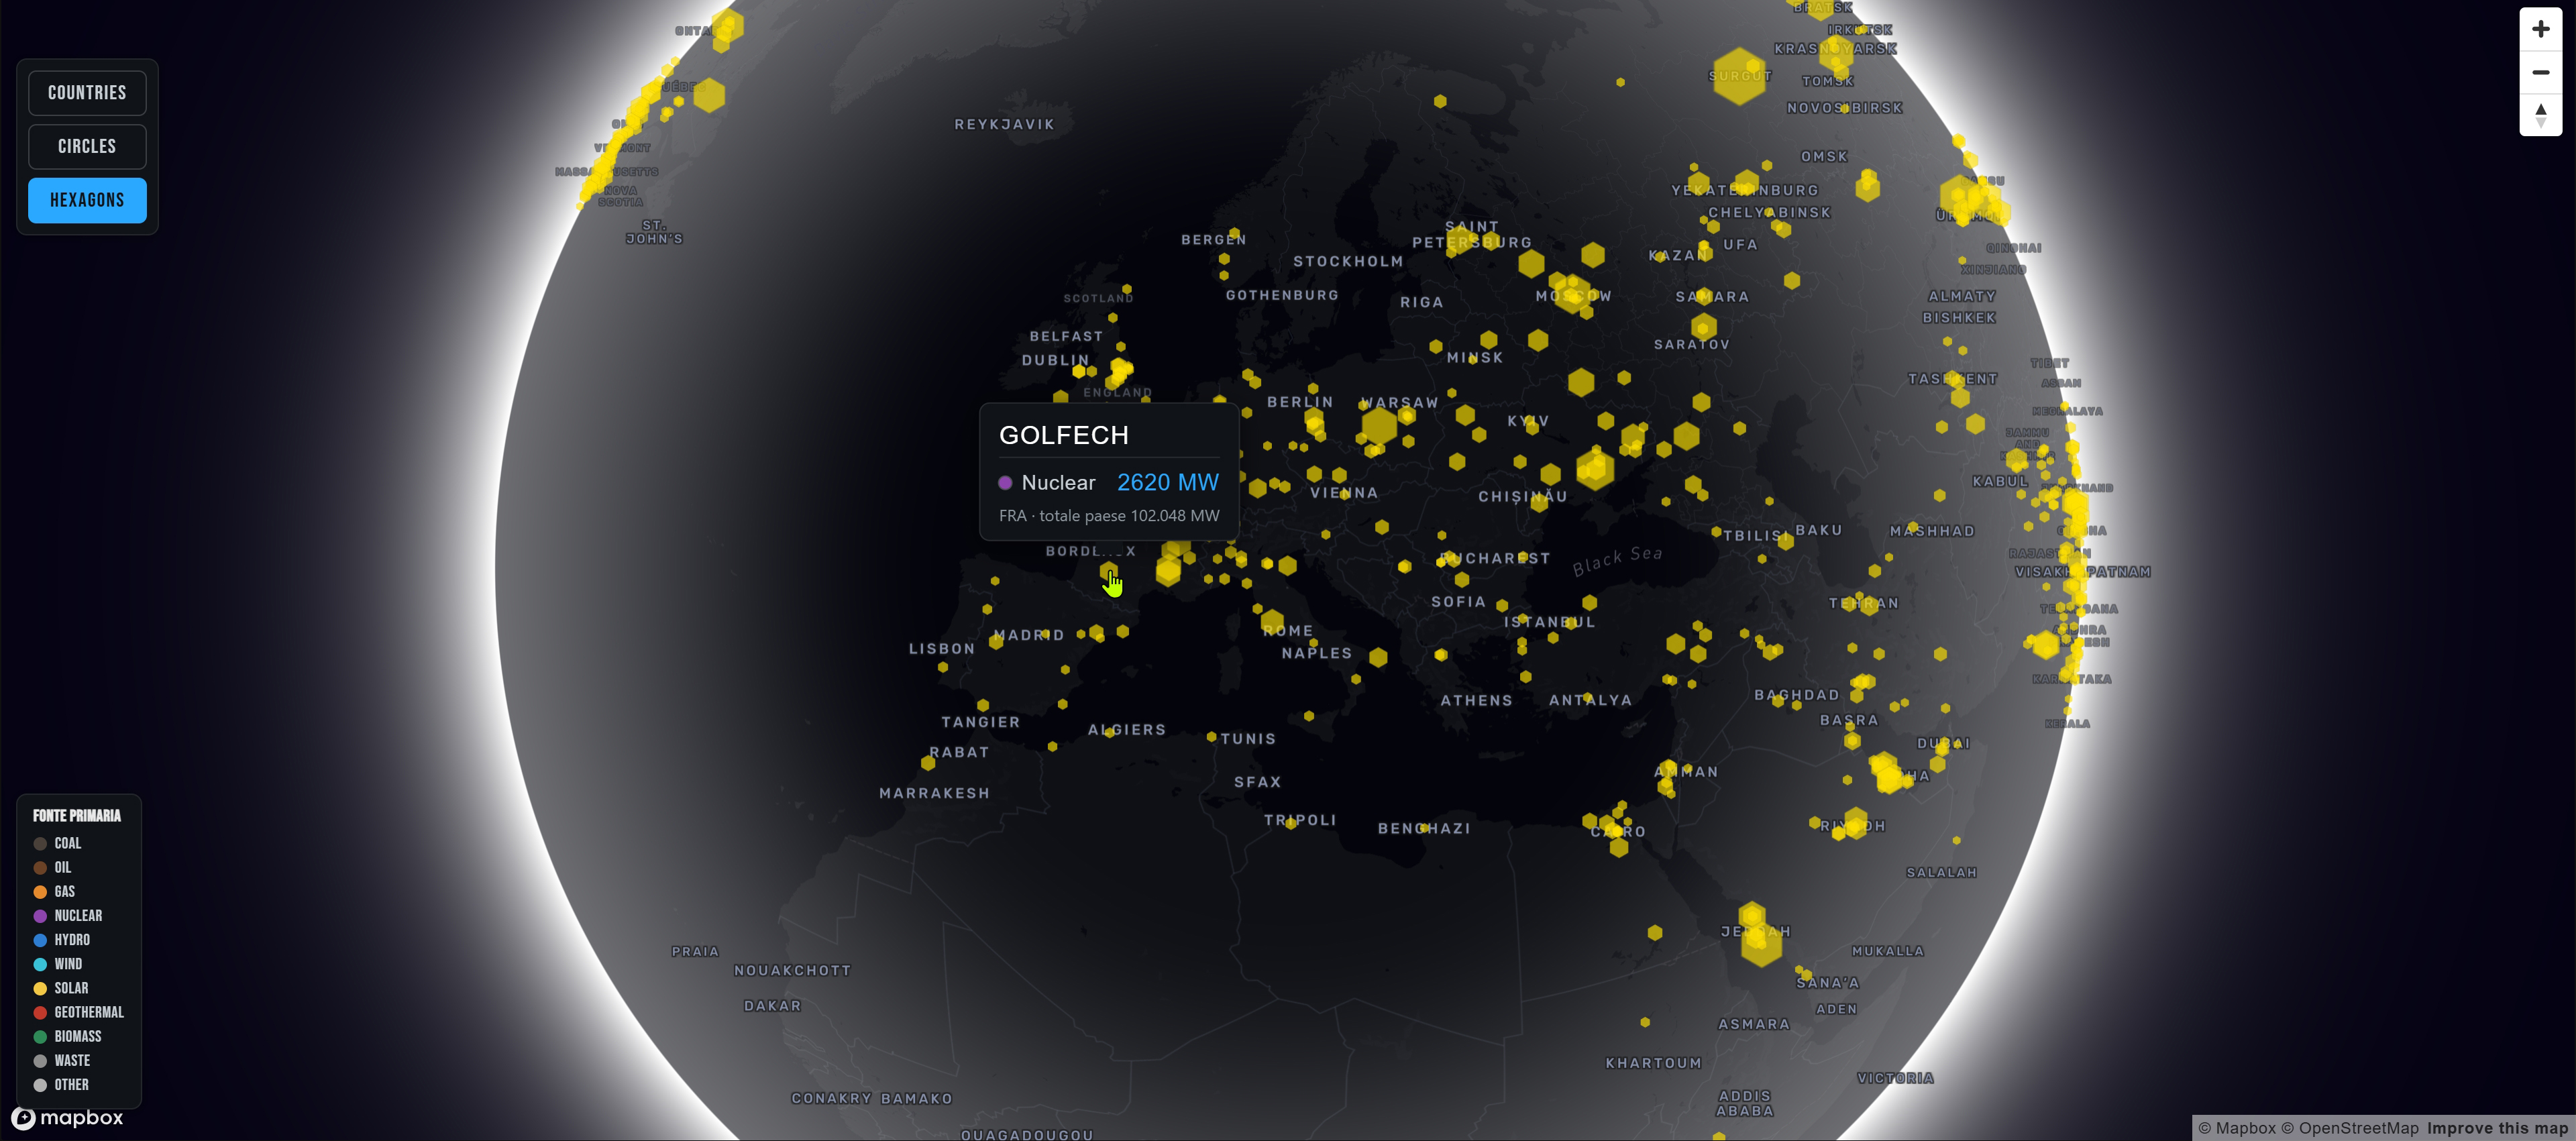
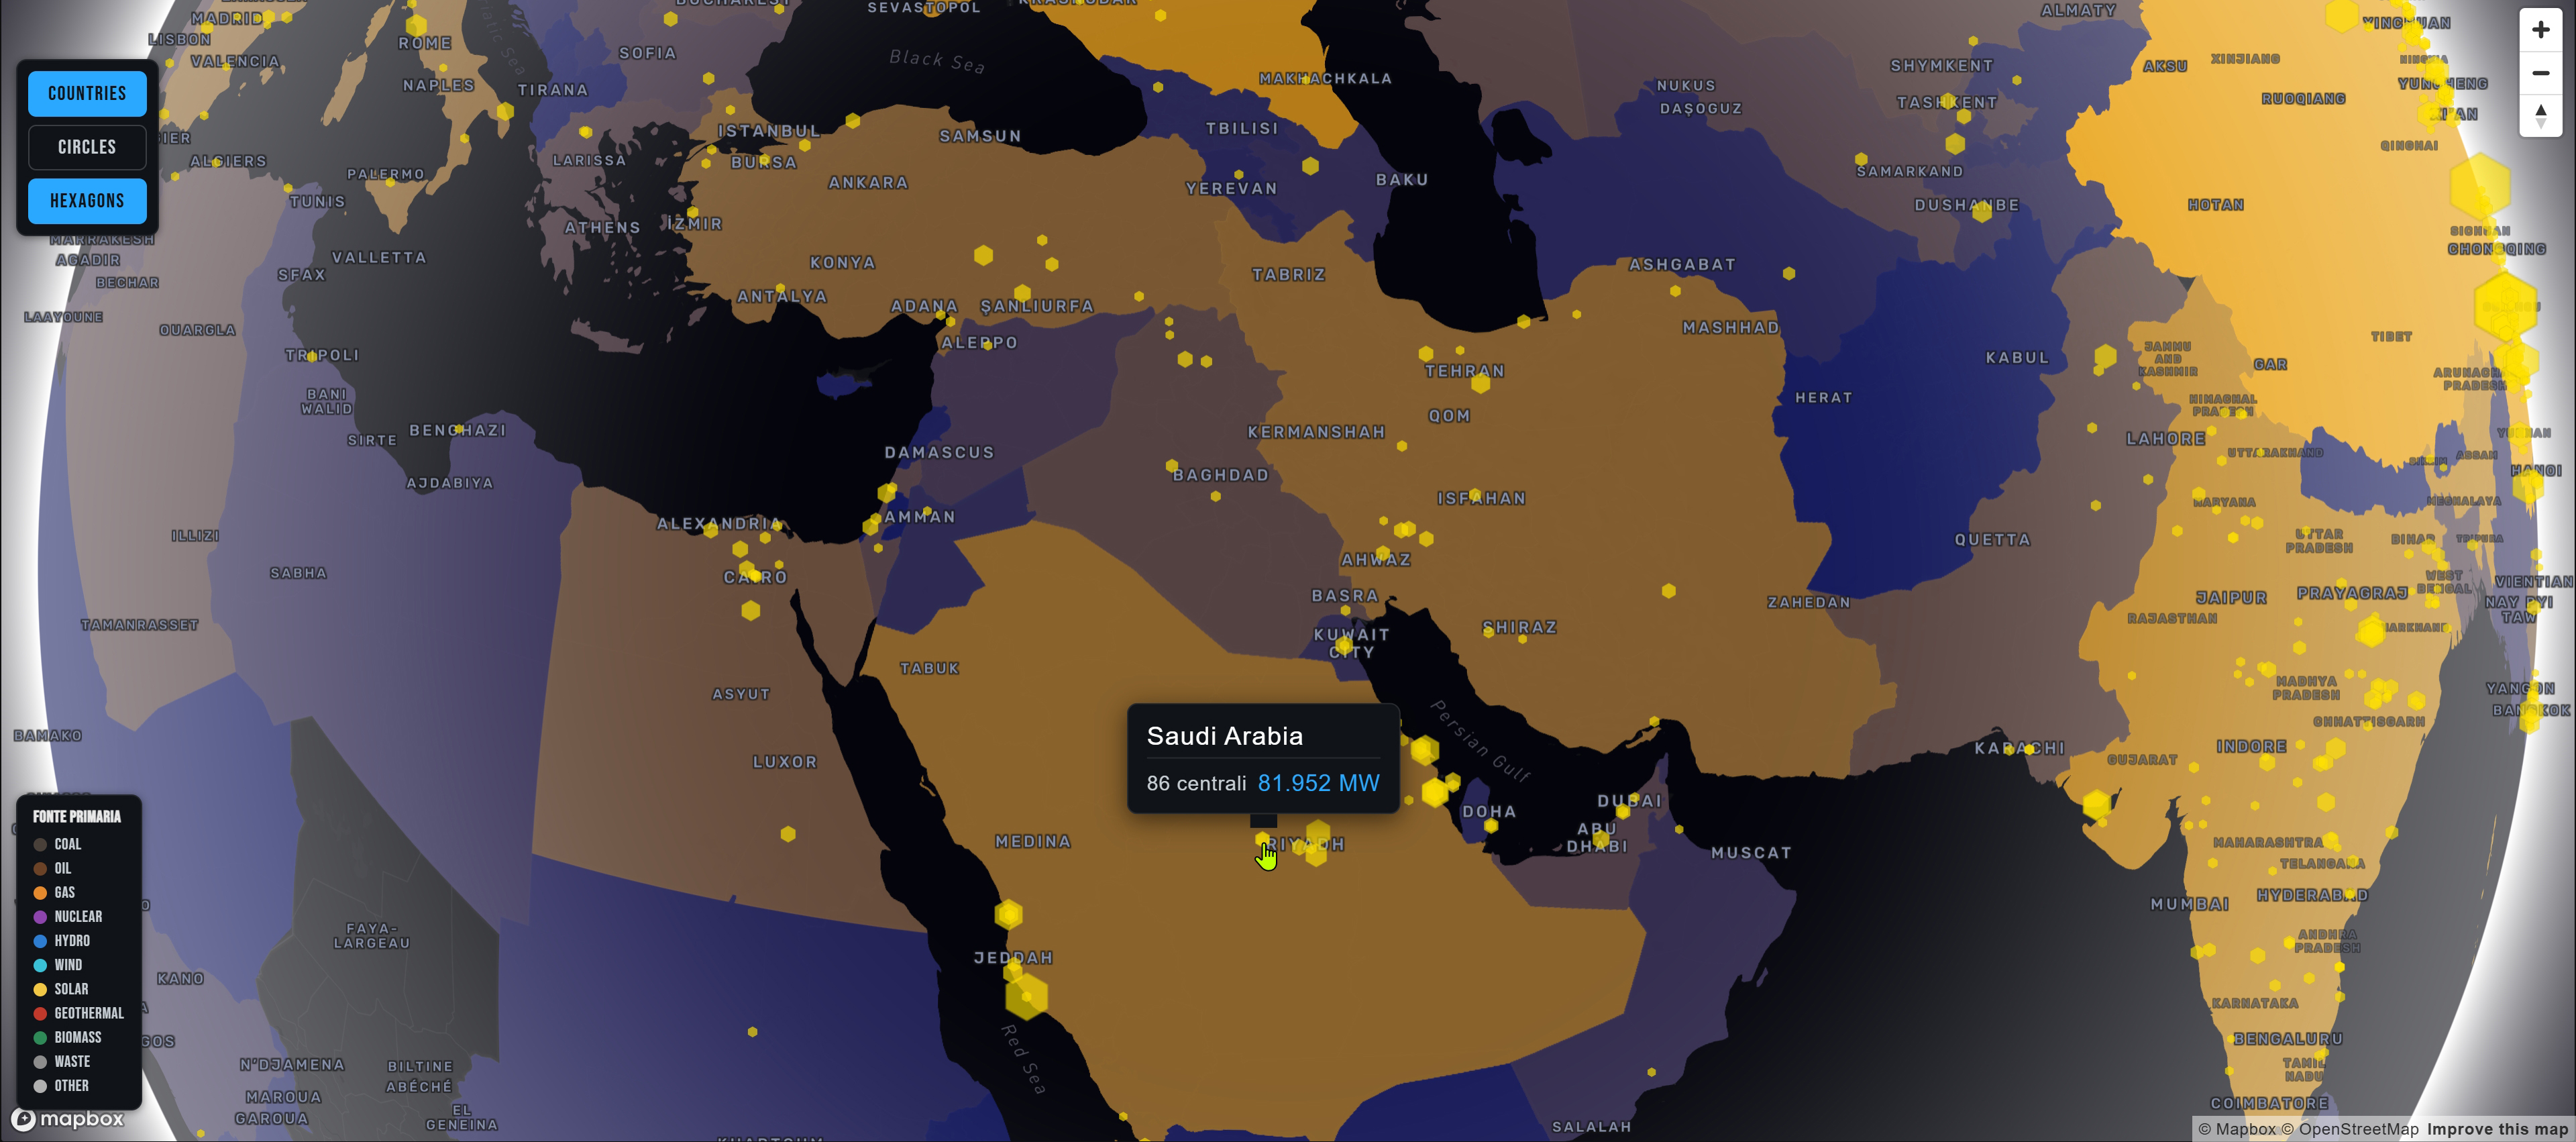
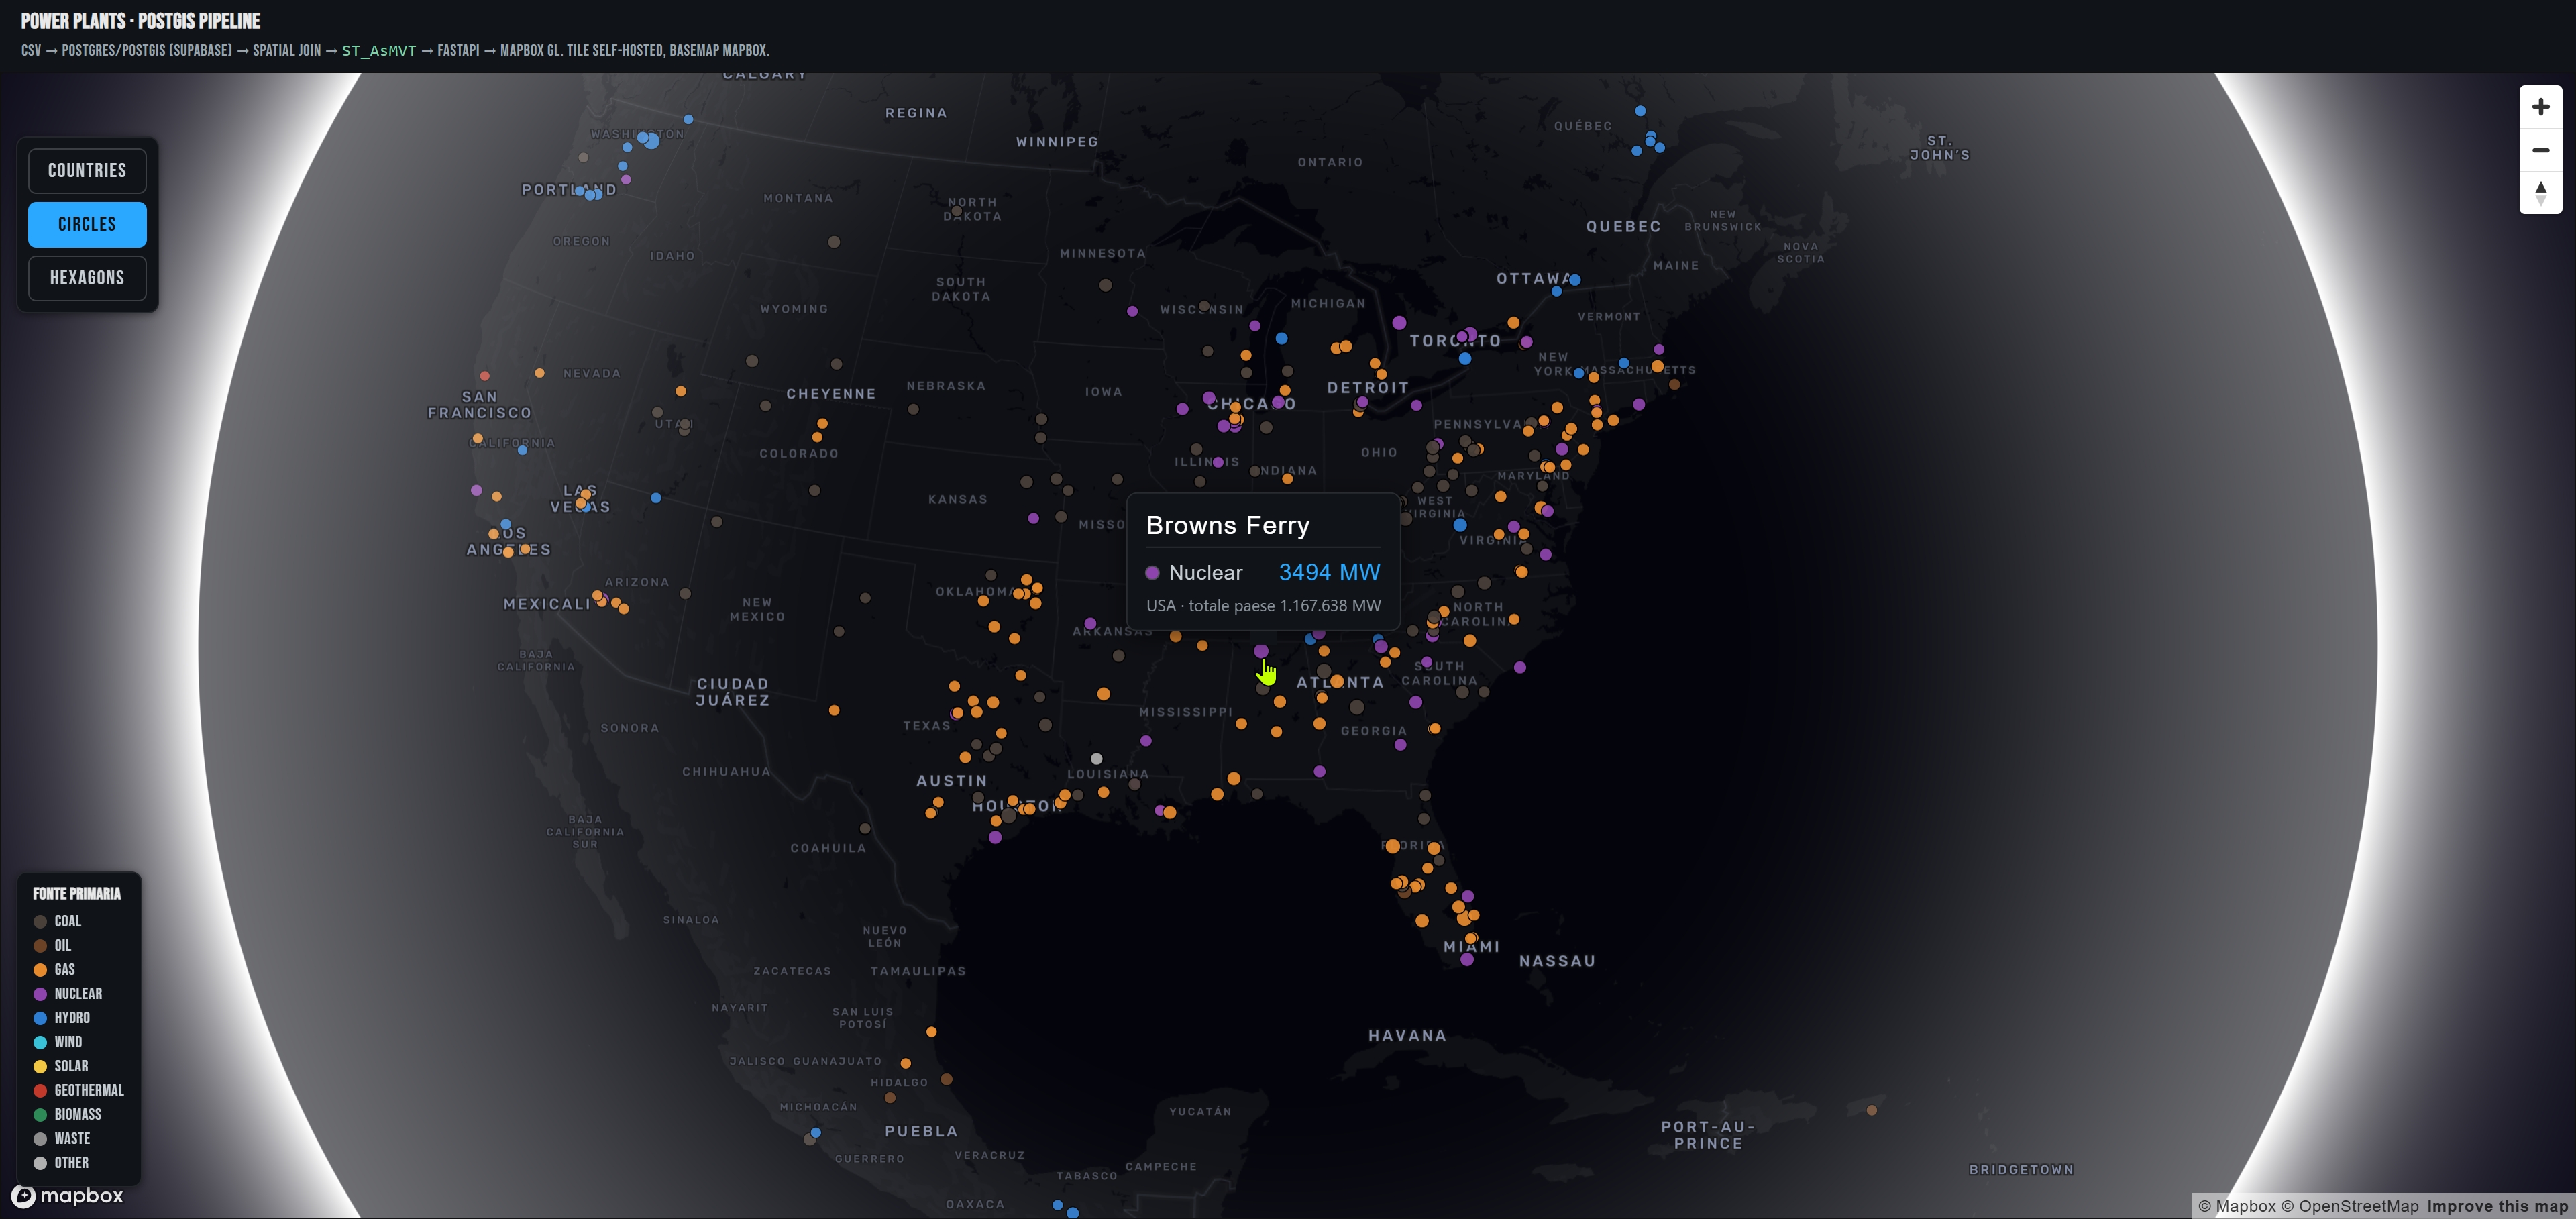
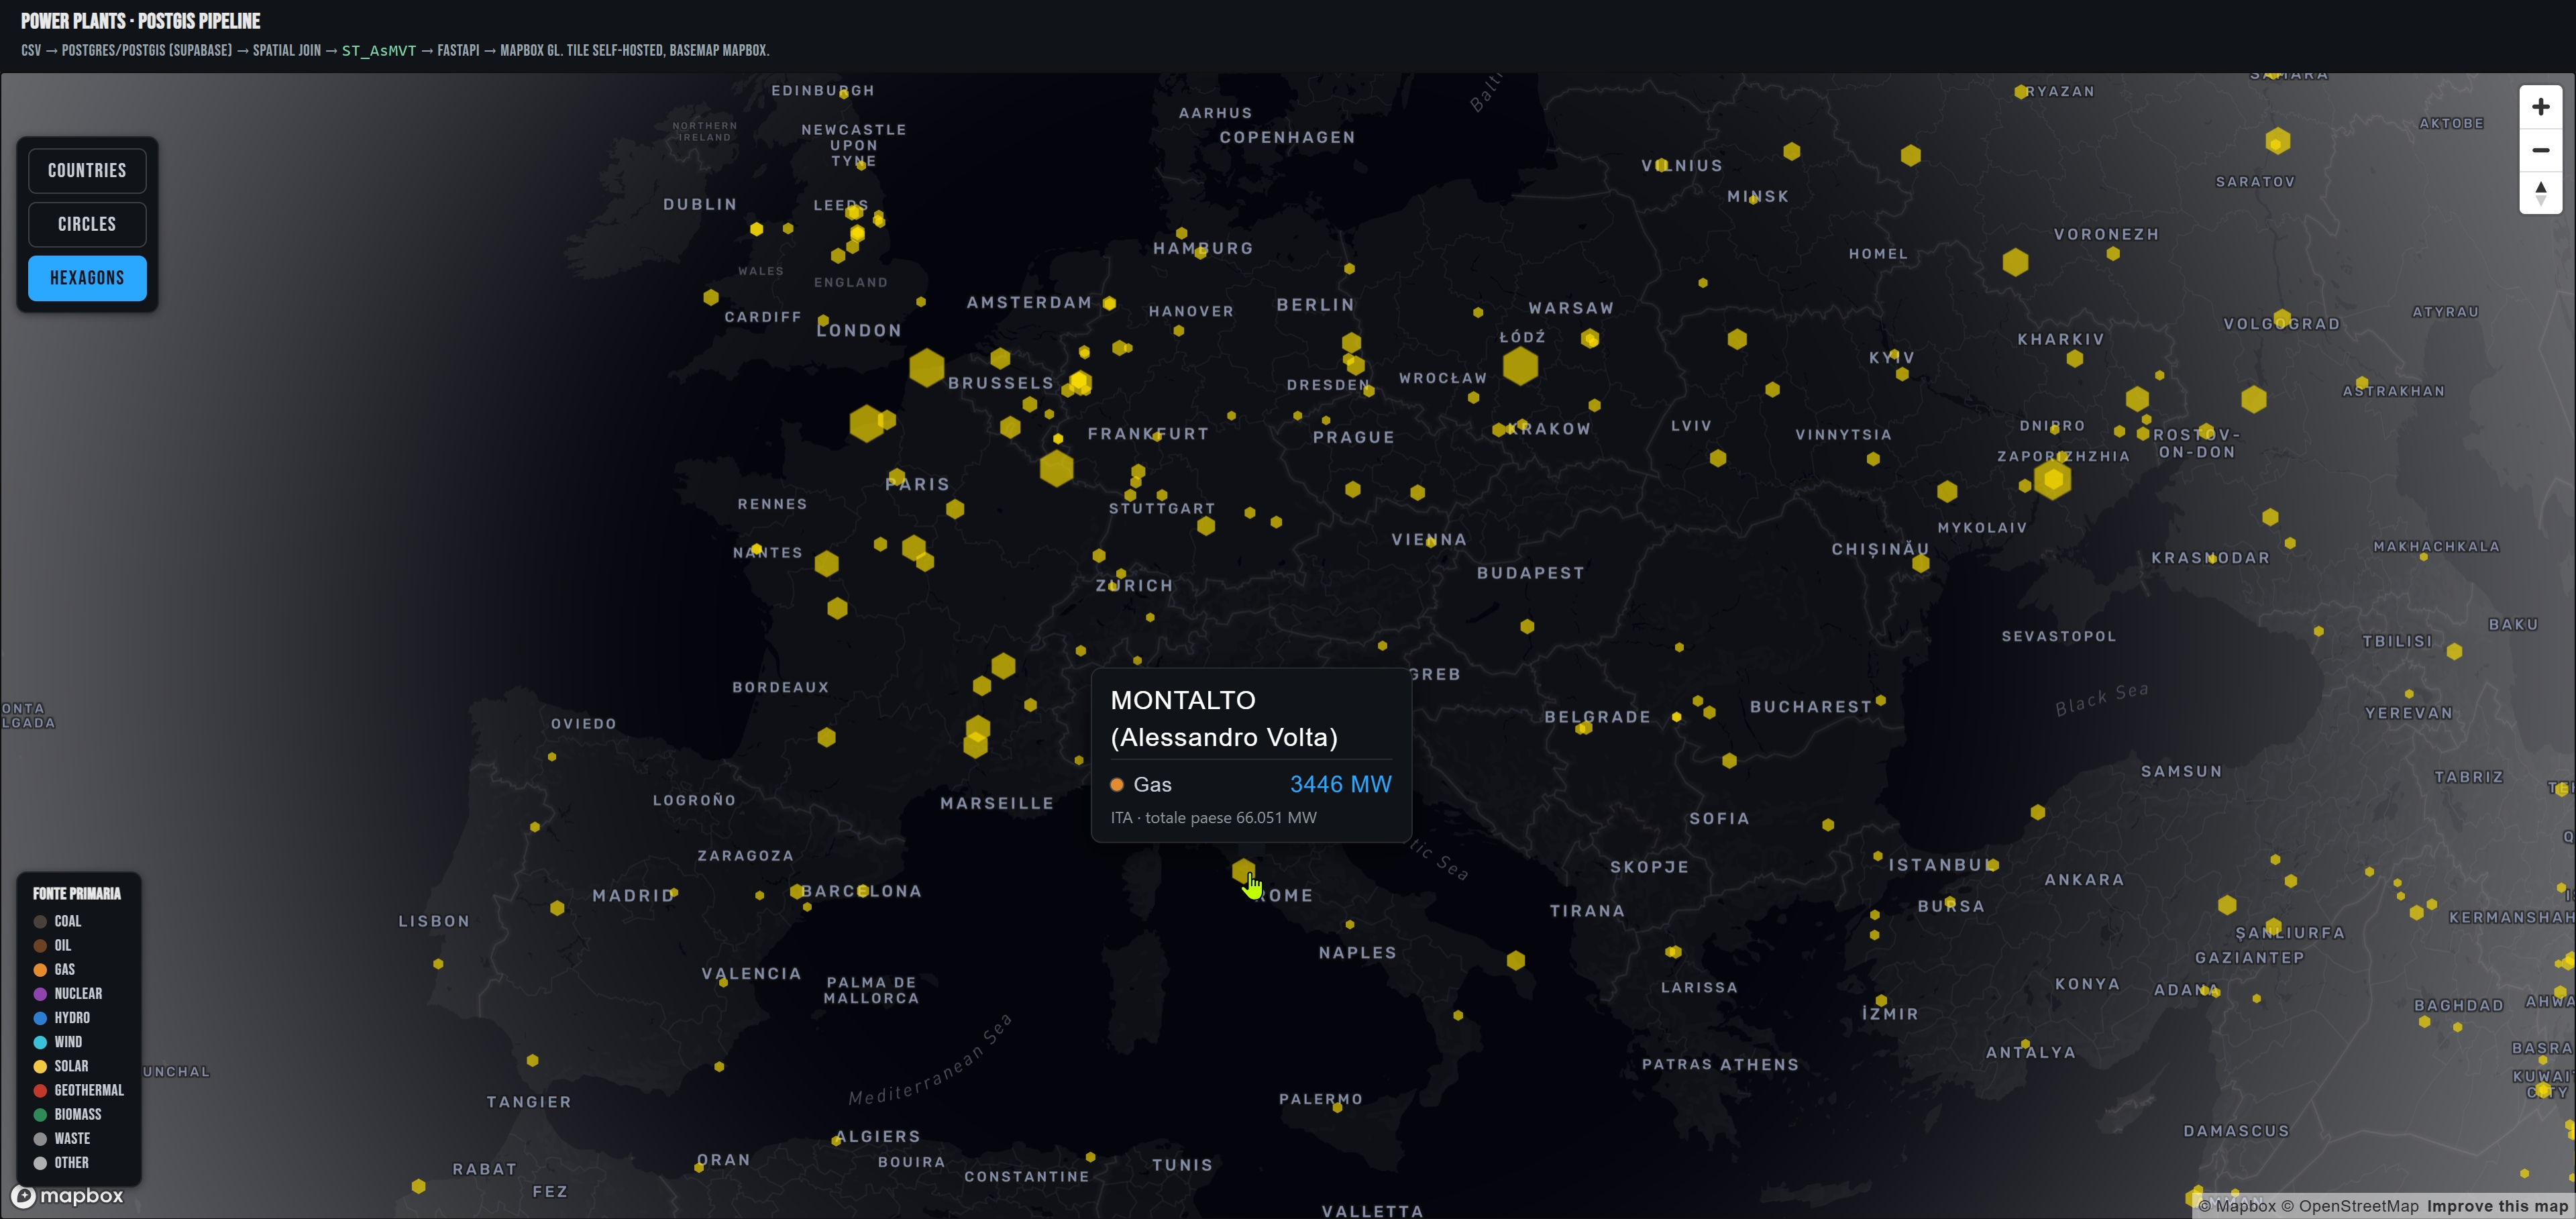
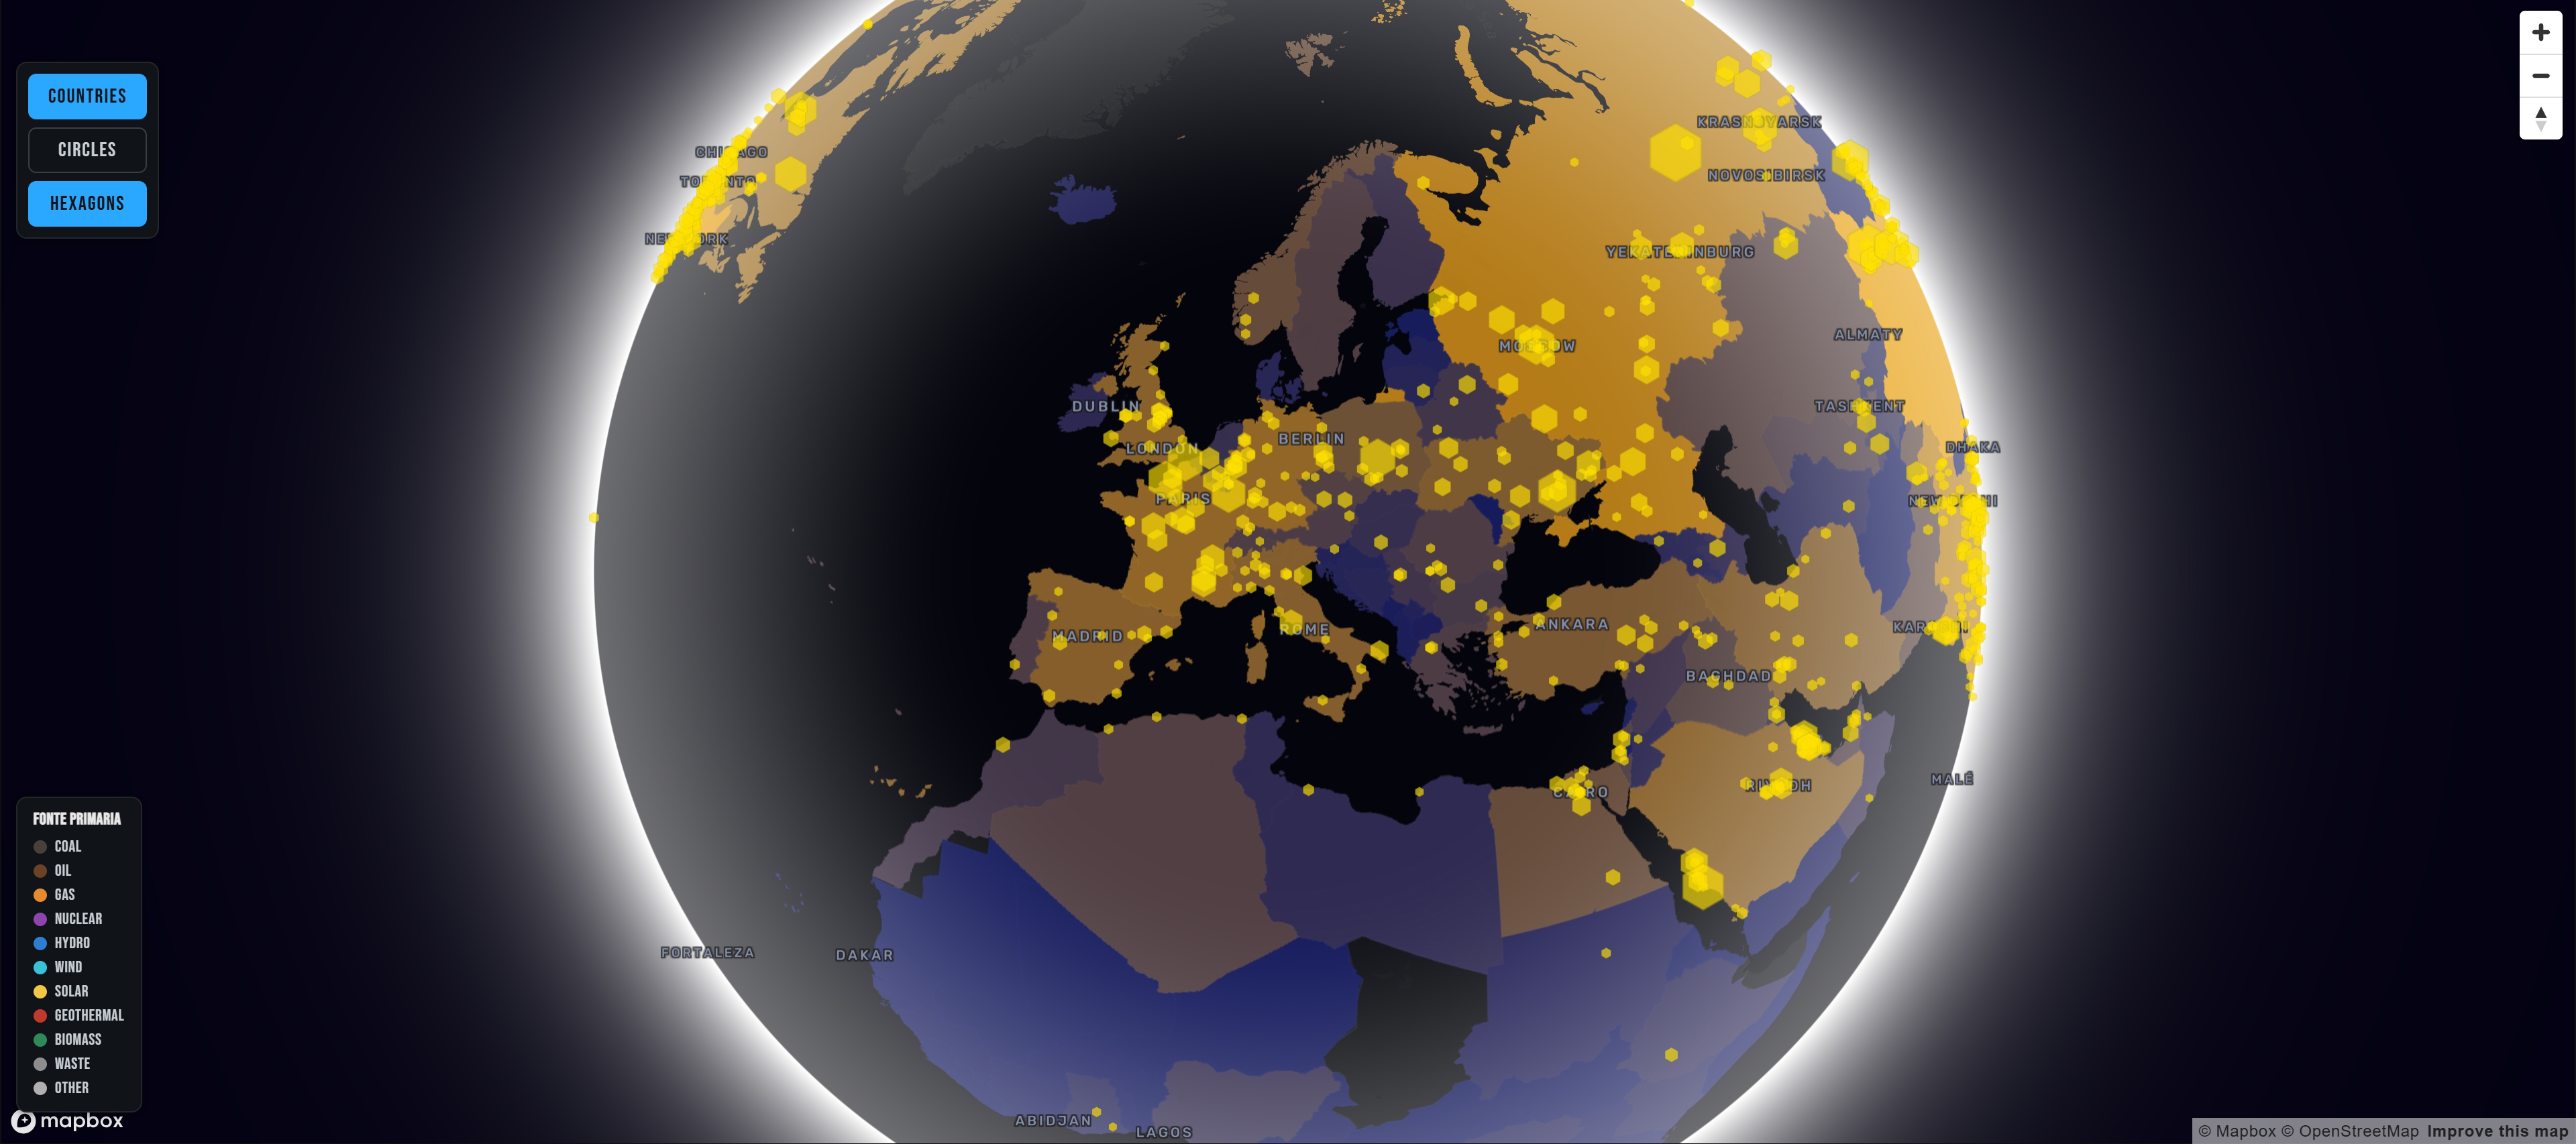
The React and Mapbox GL JS interface provided three independently selectable views: a country choropleth based on total installed capacity, circular plant markers colored by primary fuel and scaled by capacity, and an alternative hexagonal representation of the same facilities.
Plant popups displayed the facility name, fuel type, capacity, spatially derived country, and national capacity total. Country popups displayed the number of plants and total installed megawatts. All styling and popup content used attributes embedded in the vector tiles, so the frontend required no additional data requests after loading each tile.
Technical Approach
Vector tiles were generated directly inside PostGIS by combining ST_TileEnvelope, indexed bounding-box filtering, ST_Transform, ST_AsMVTGeom, and ST_AsMVT. For each z/x/y request, PostgreSQL selected the relevant features, reprojected them to Web Mercator, clipped them to the tile boundary, converted them to the local tile extent, and returned binary MVT data.
The plant-tile function applied zoom-dependent detail: below zoom level 5, only facilities with at least 1,000 MW of capacity were included. FastAPI remained a thin serving layer that validated tile coordinates, reused pooled database connections, called the PostGIS functions, and returned the binary response with gzip compression, CORS controls, cache headers, and 204 responses for empty tiles.
Technologies
- PostgreSQL
- PostGIS
- Supabase
- Python
- psycopg
- psycopg_pool
- FastAPI
- uvicorn
- React
- Vite
- Mapbox GL JS
- Mapbox Studio
- Mapbox Vector Tiles
- SQL
- Natural Earth GeoJSON
Data Workflow
The geospatial data pipeline separated raw ingestion, geometry creation, boundary loading, spatial analysis, aggregation, and tile generation into reproducible SQL and Python stages. CSV records were loaded server-side through COPY, while the Natural Earth GeoJSON boundaries were inserted with ST_GeomFromGeoJSON and normalized to MultiPolygon geometries.
GiST indexes on the plant and country geometries accelerated bounding-box filters, proximity searches, nearest-neighbour queries, and the final spatial join. The workflow also supported data-quality checks for plants outside simplified boundaries and discrepancies between geometric assignments and the source country codes. The materialized country view could be refreshed whenever either source dataset changed without redesigning the frontend.
Outcome
The completed application established a working geospatial infrastructure connecting raw energy data, PostgreSQL and PostGIS, spatial joins and aggregation, server-generated vector tiles, a FastAPI layer, and a React map interface.
It gave the consulting company a structured baseline for exploring the global power-generation landscape at both facility and country level. The same spatial database architecture could support refreshed source data and provide the geographic foundation for subsequently comparing existing infrastructure with the company's own energy projects.