
Public education / government transparency and institutional data infrastructure
Madagascar Public Schools WebGIS & Education Data Platform
Overview
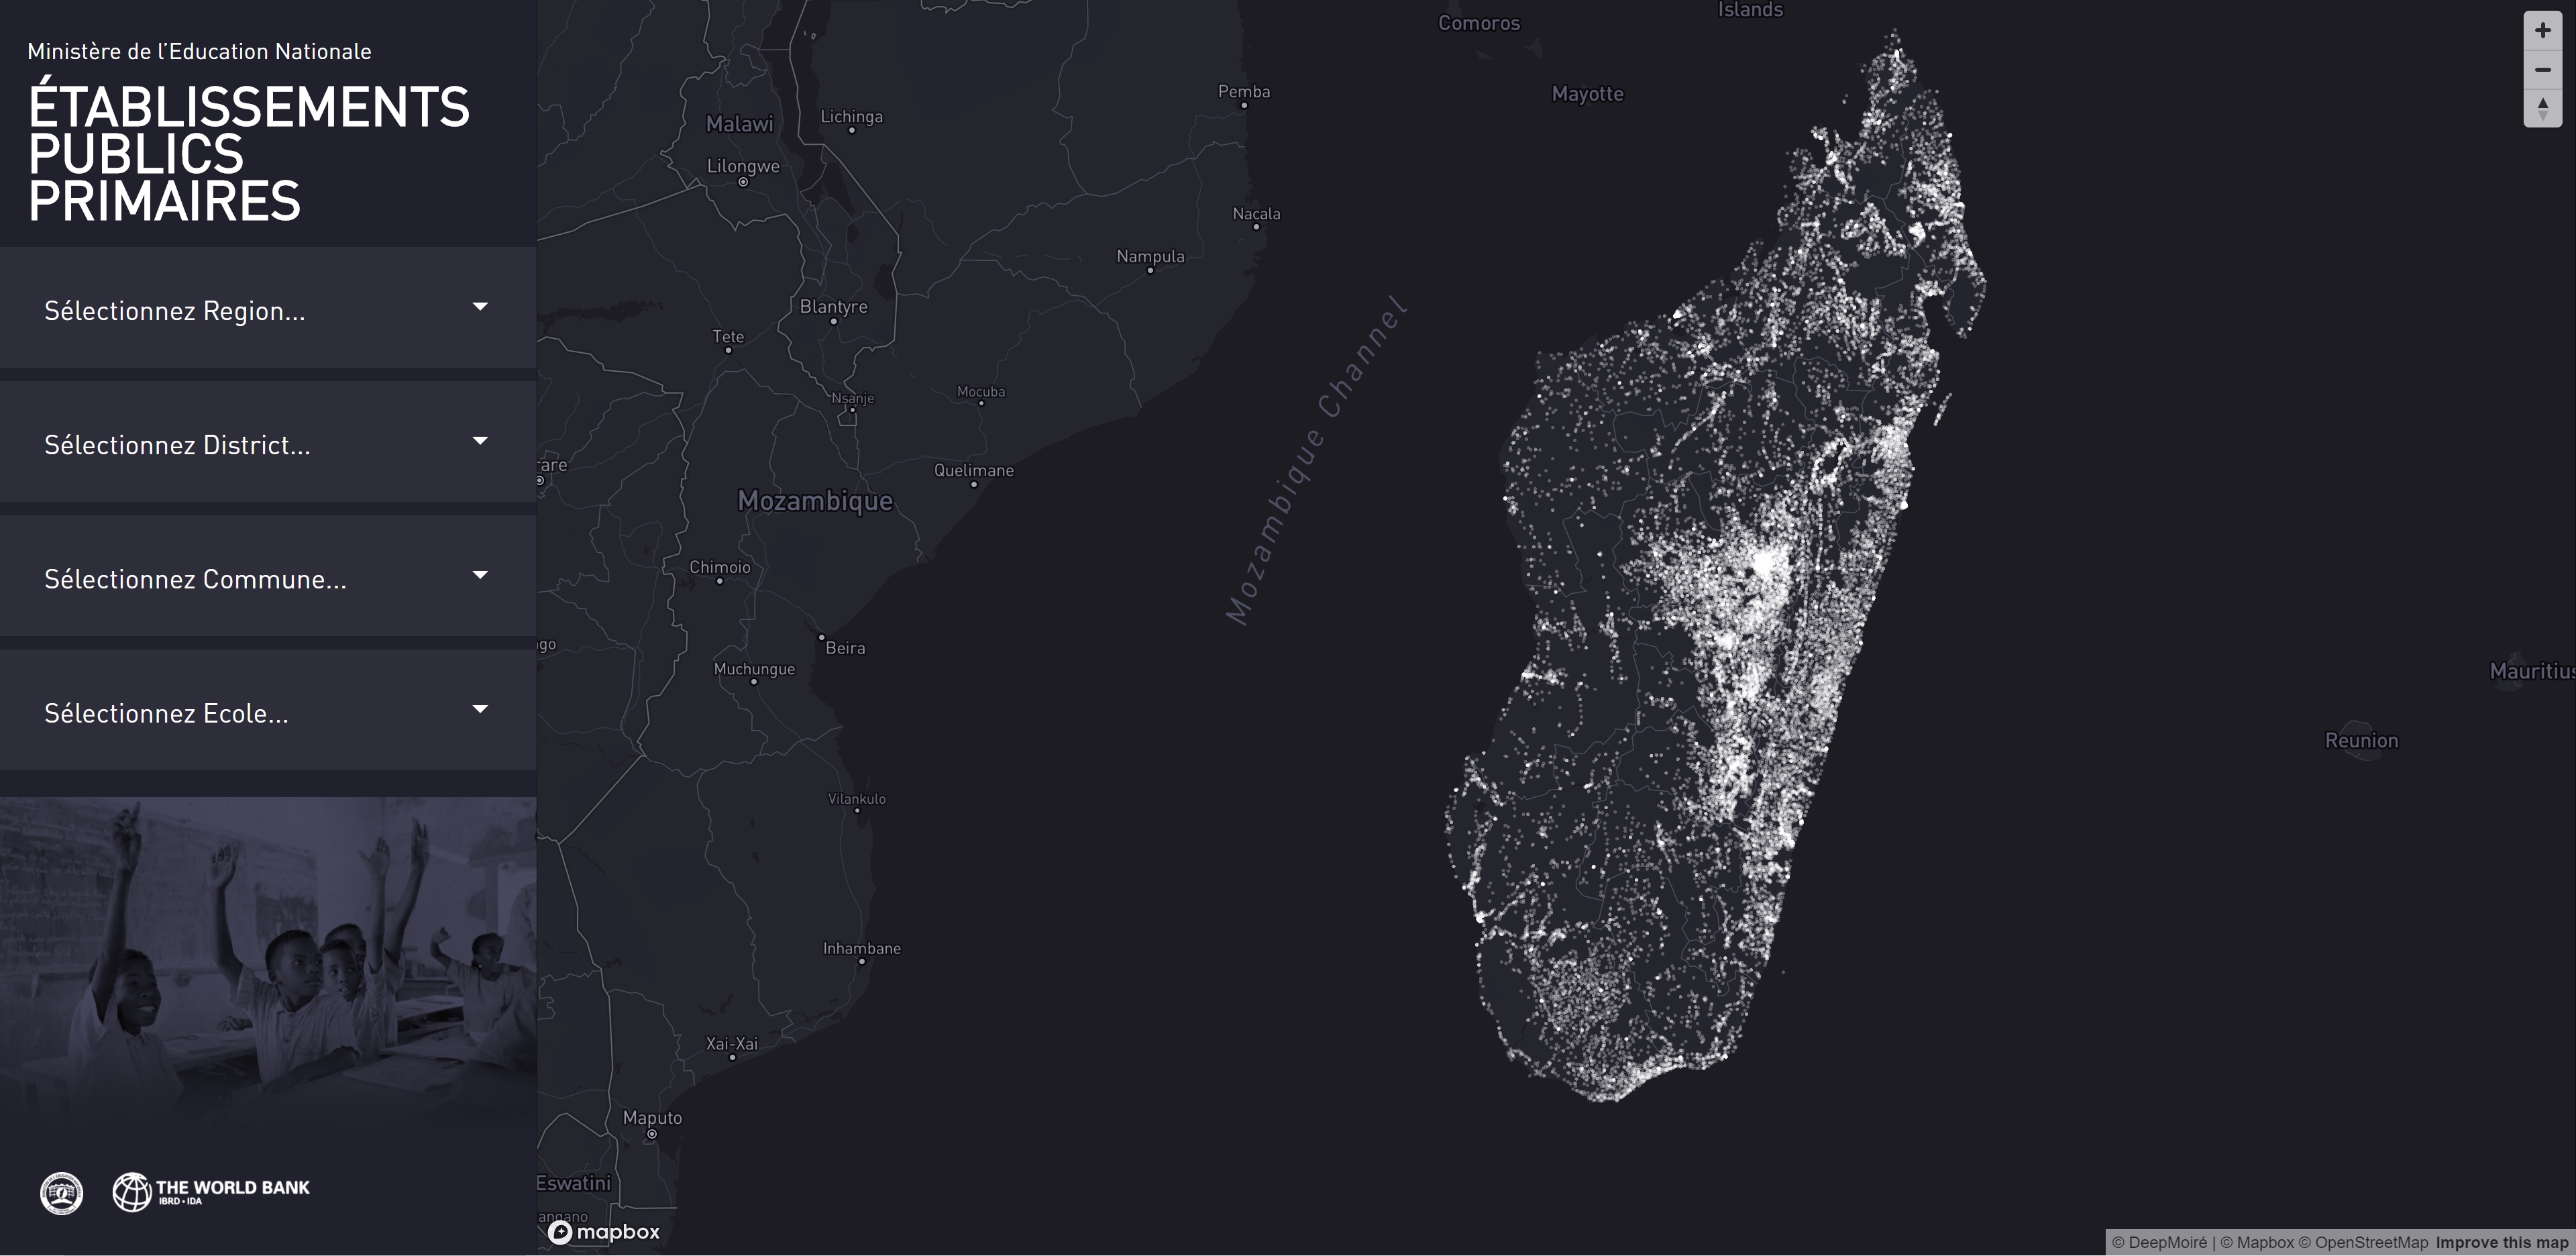
I designed and developed a nationwide WebGIS platform for a World Bank-supported program with Madagascar's Ministry of National Education. The public GIS web application mapped primary schools and education resources across the country, combining detailed school-level information with regional data visualization and hierarchical geographic exploration.
The work covered the complete product: data preparation, cartographic and interface design, interactive visualization, front-end development, deployment, documentation and training for the Ministry's technical team.
Challenge
The platform had to consolidate several official datasets covering school locations, students, teachers, administrative geography, population and public funding. These sources arrived as a combination of CSV, Excel-derived data, shapefiles and GeoJSON, with different identifiers, naming conventions and levels of completeness.
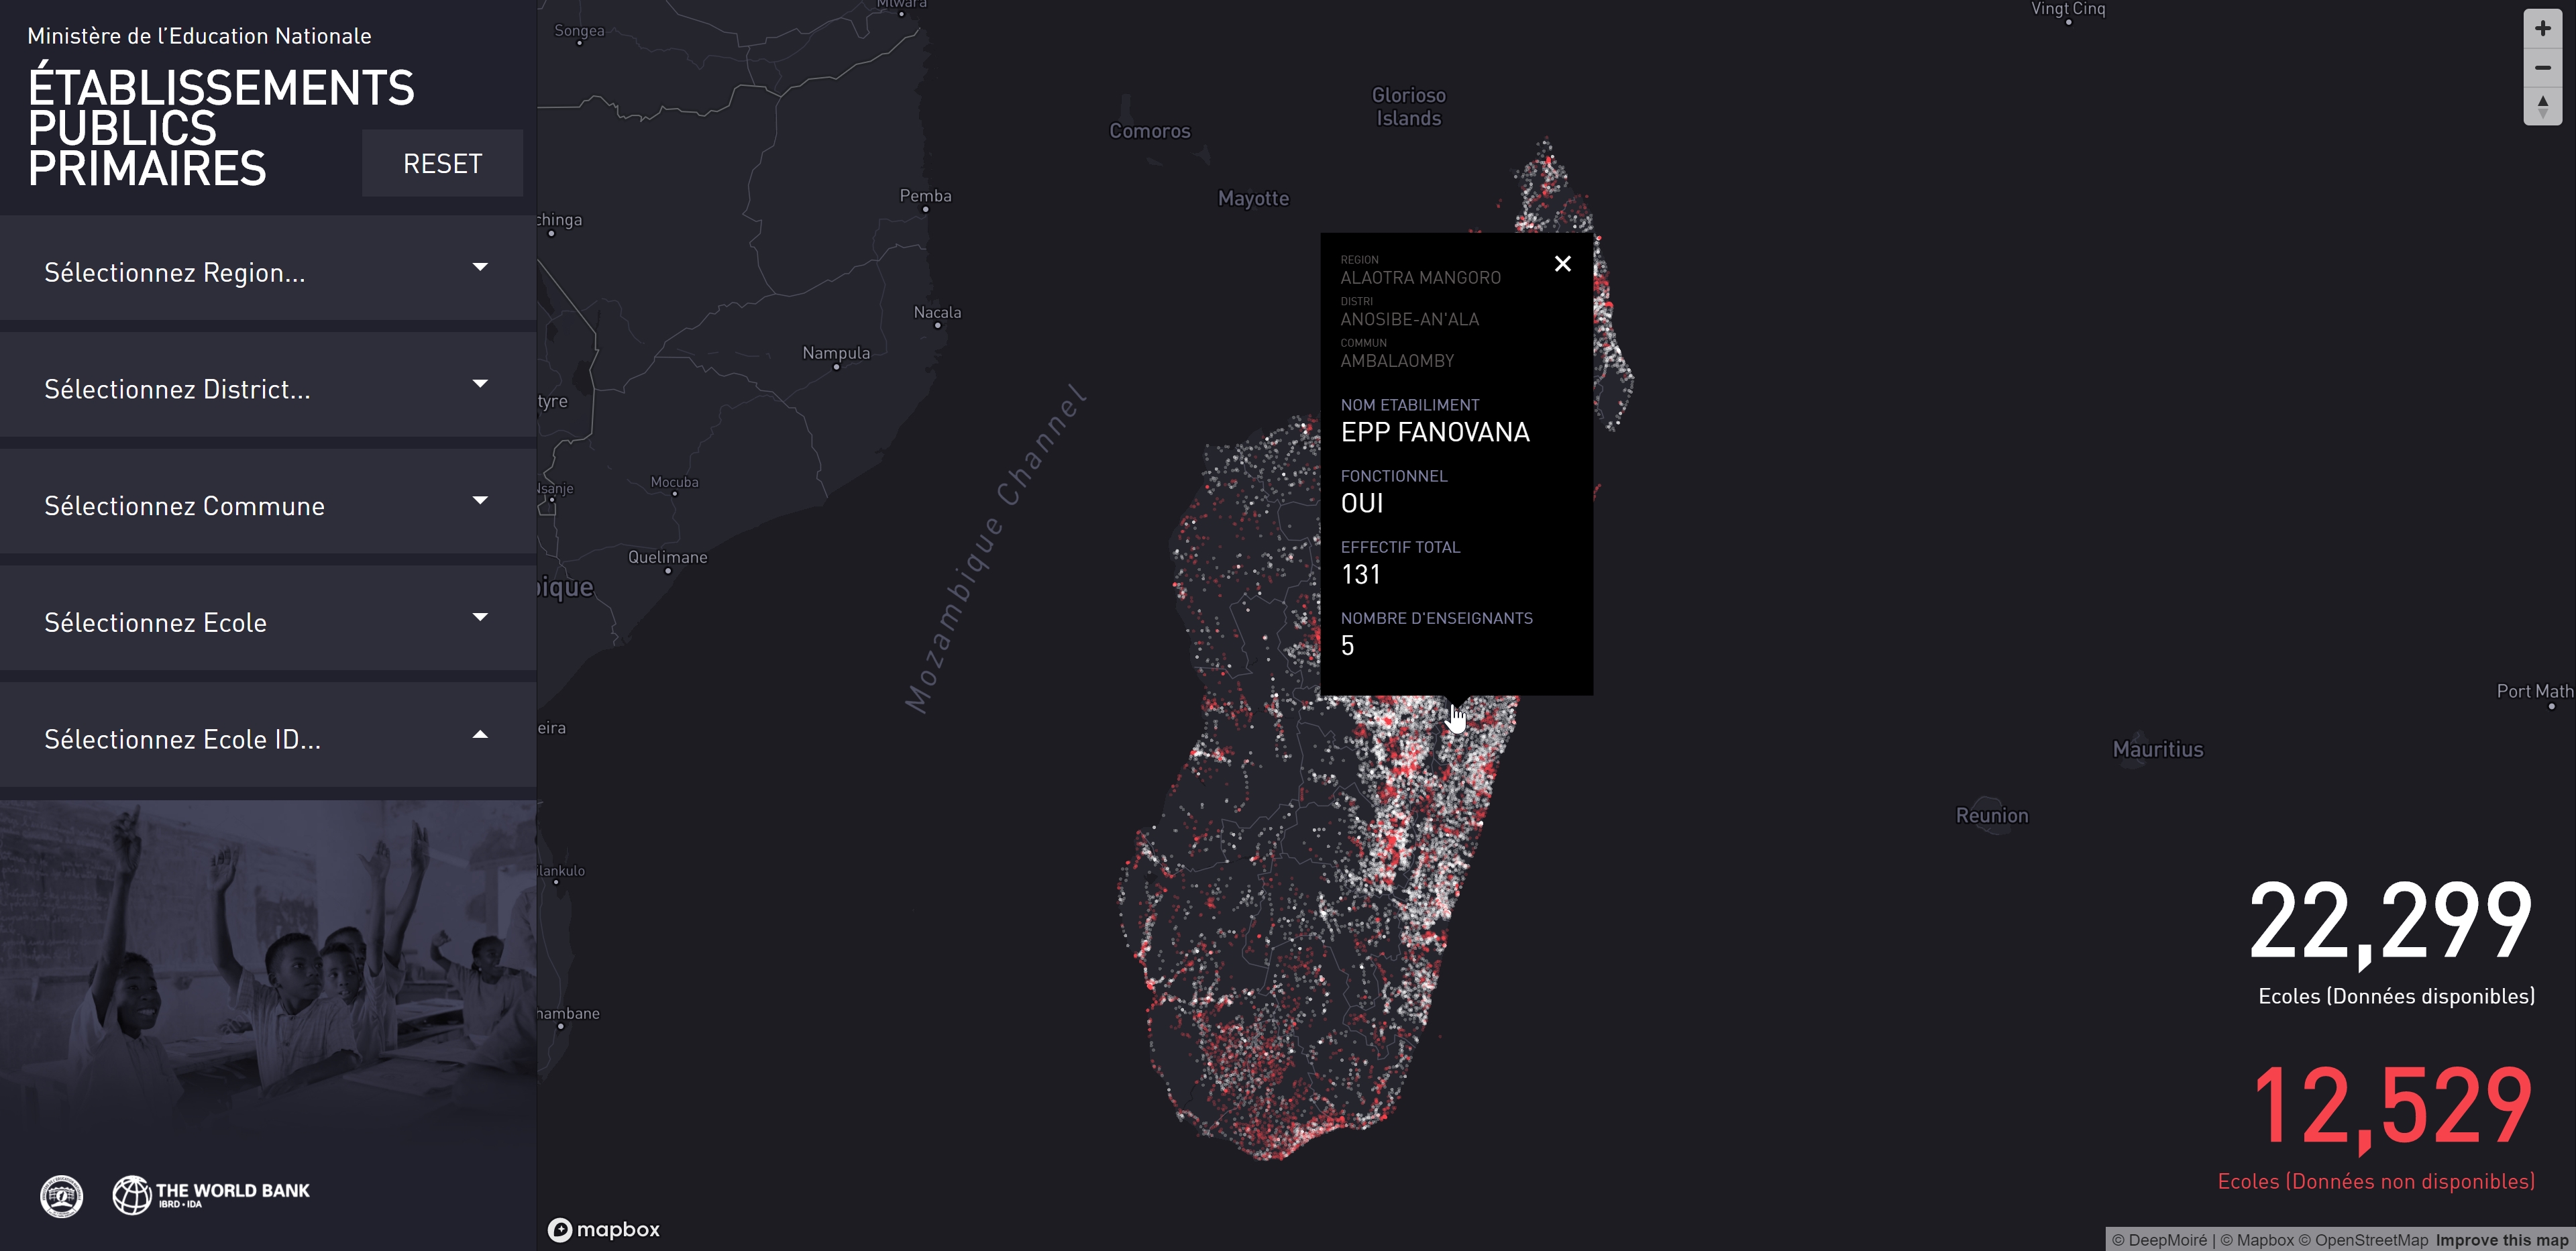
The geographic source contained 34,828 education and public-service location records across 22 regions, 114 districts and approximately 1,500 communes. Of these, 22,299 could be connected to the available school data, while 12,529 lacked corresponding information. Preserving and communicating this distinction was important: missing data needed to remain visible rather than being silently removed from the map.
The WebGIS application also needed to work at two scales. Members of the public had to be able to find an individual school, while government and technical users needed to examine nationwide and regional patterns in education resources.
Solution
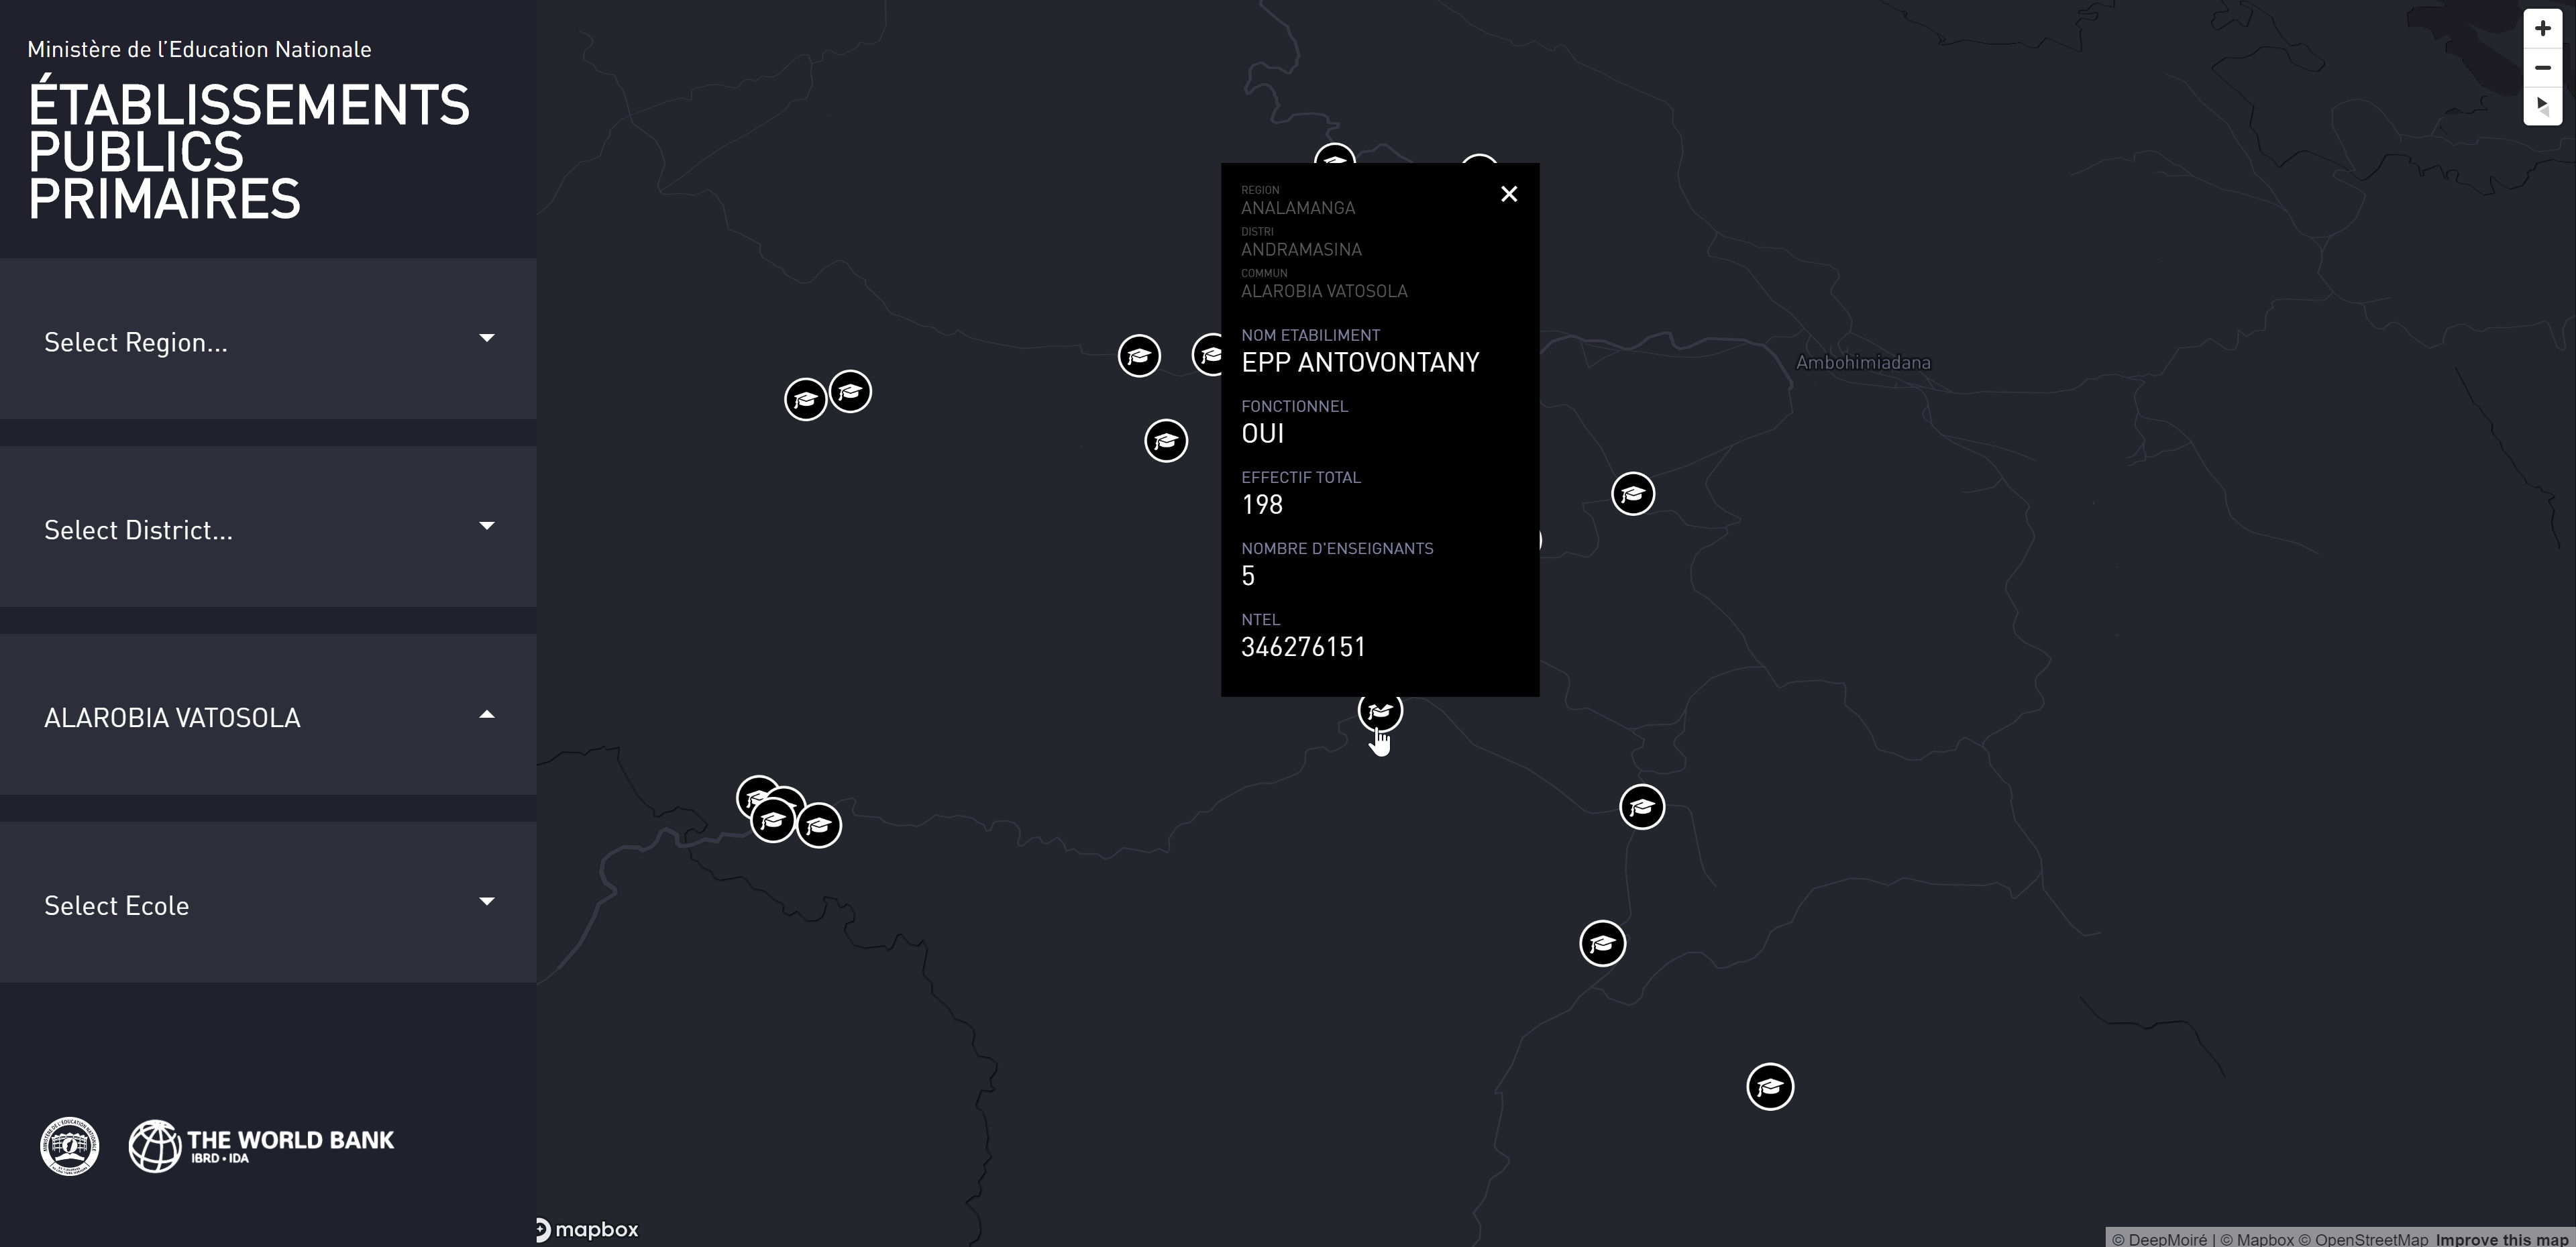
The finished platform combined two complementary modes of exploration. The school-search interface provided linked filters for region, district, commune, school and school identifier. Each selection dynamically restricted the other available options and repositioned the map around the selected area or institution.
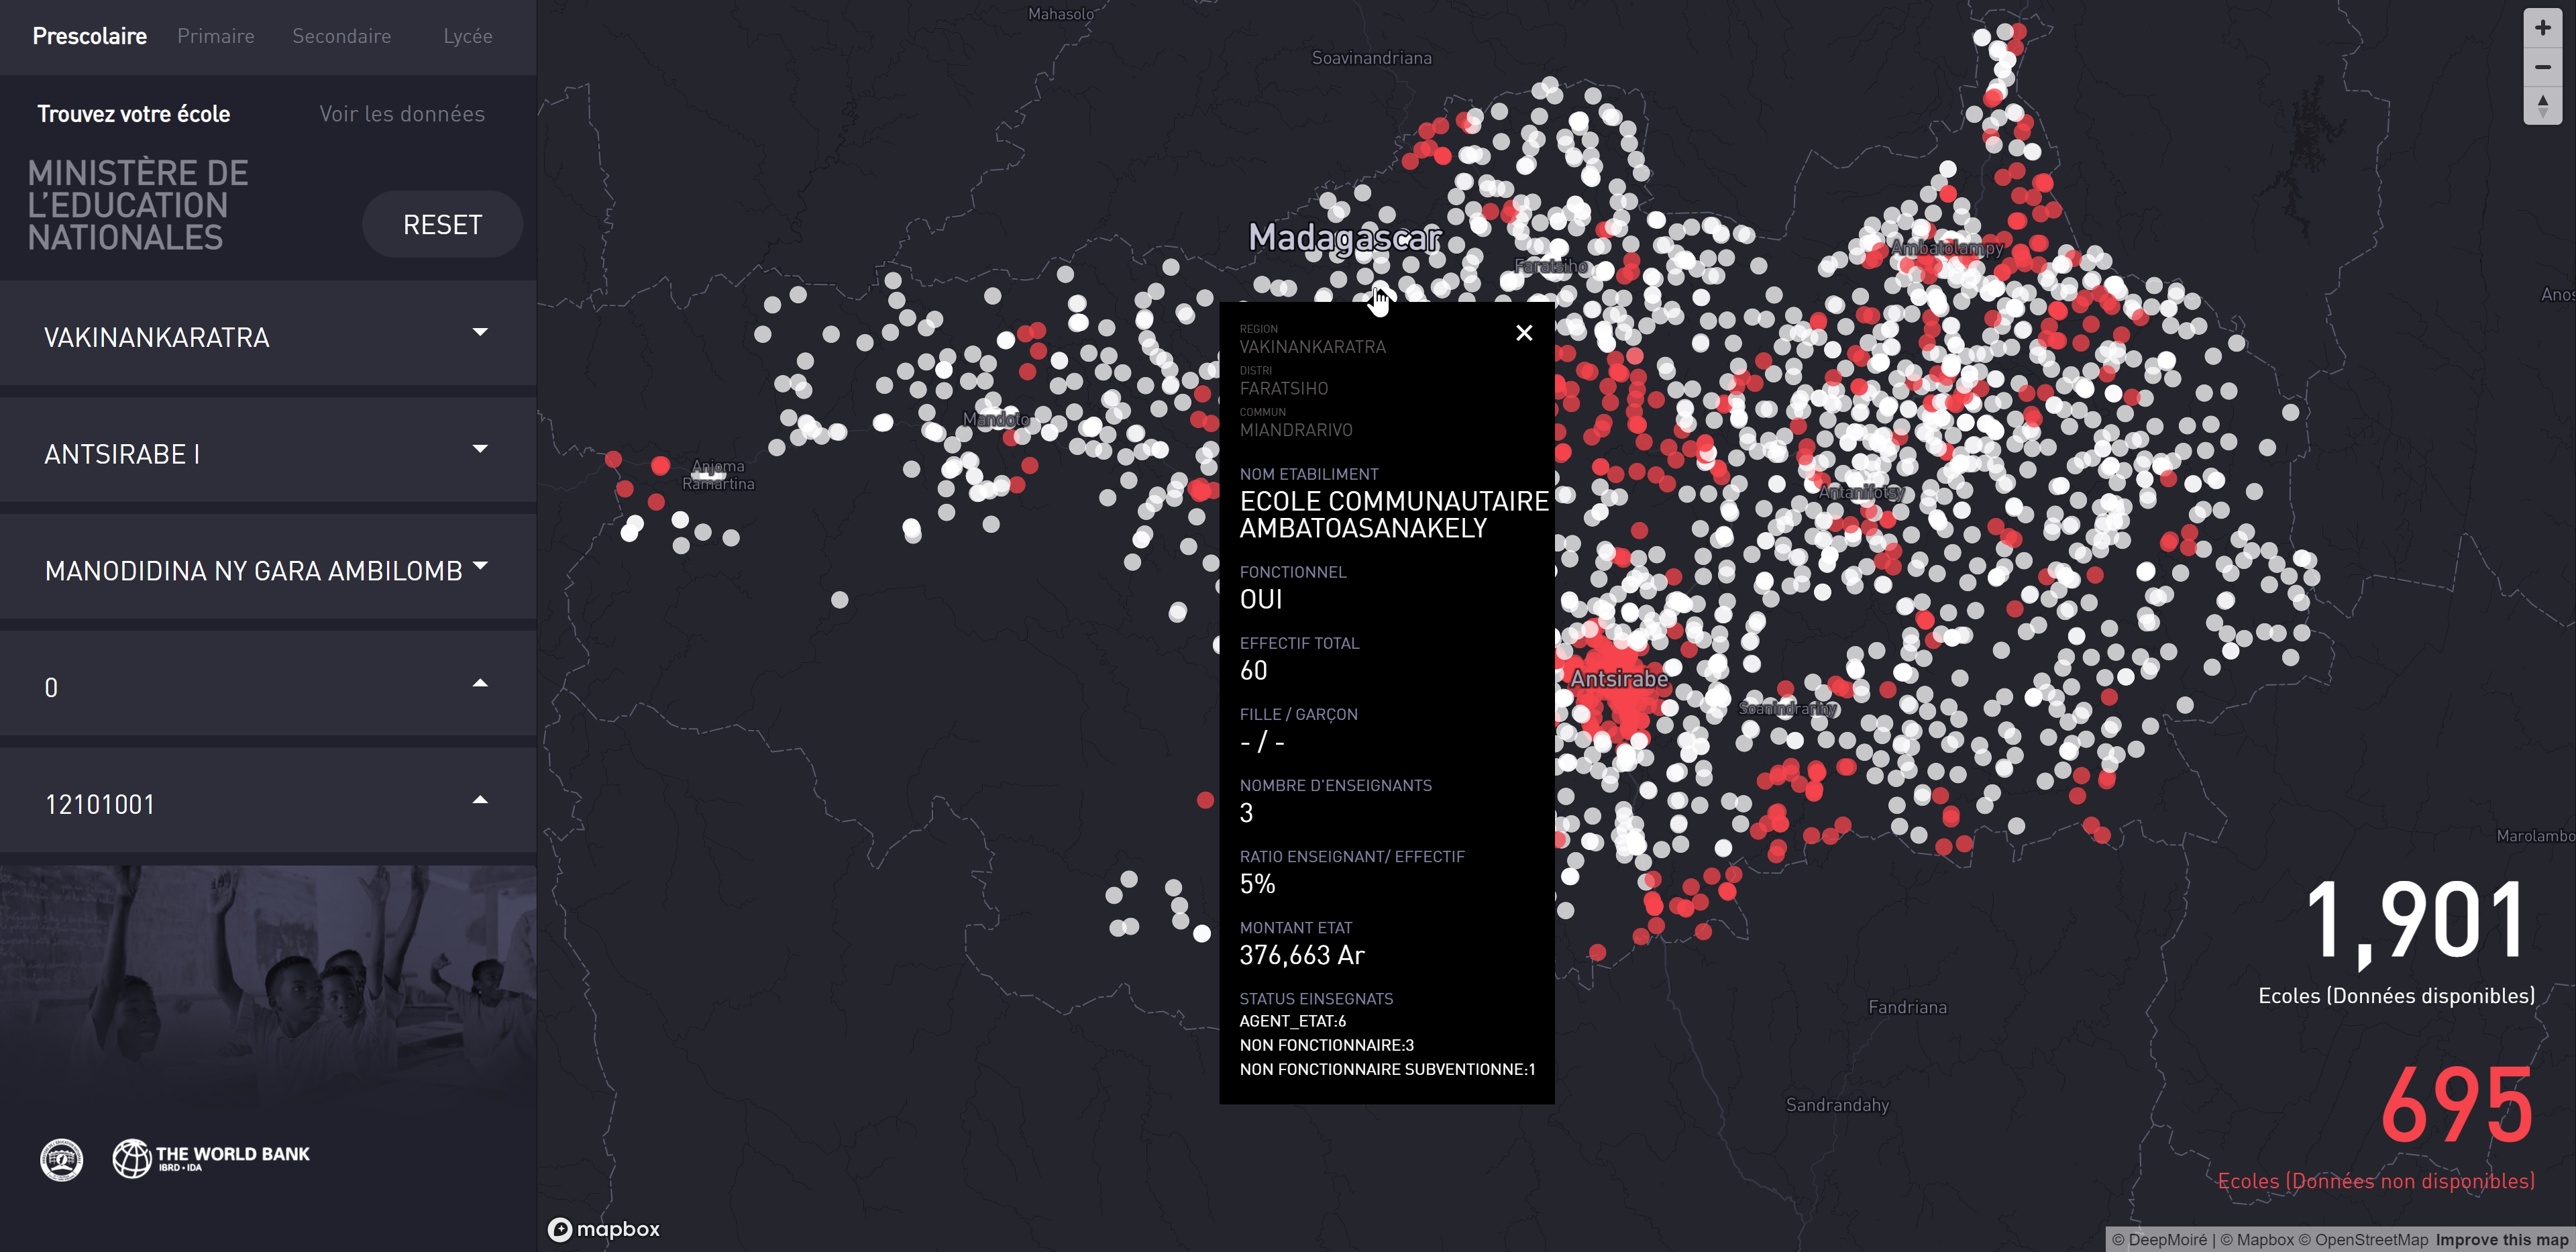
Interactive school markers exposed administrative location, school name and operational status, total enrolment, female and male students, number and employment status of teachers, teacher-to-student ratio and available funding information.
A second analytical interface allowed users to change the indicator represented by the map. School markers could be sized according to teacher numbers, total enrolment, female or male students, or the teacher-to-student ratio. Regional choropleth views provided aggregated readings of indicators such as the number of primary schools and student enrolment.
Design & Data Visualization
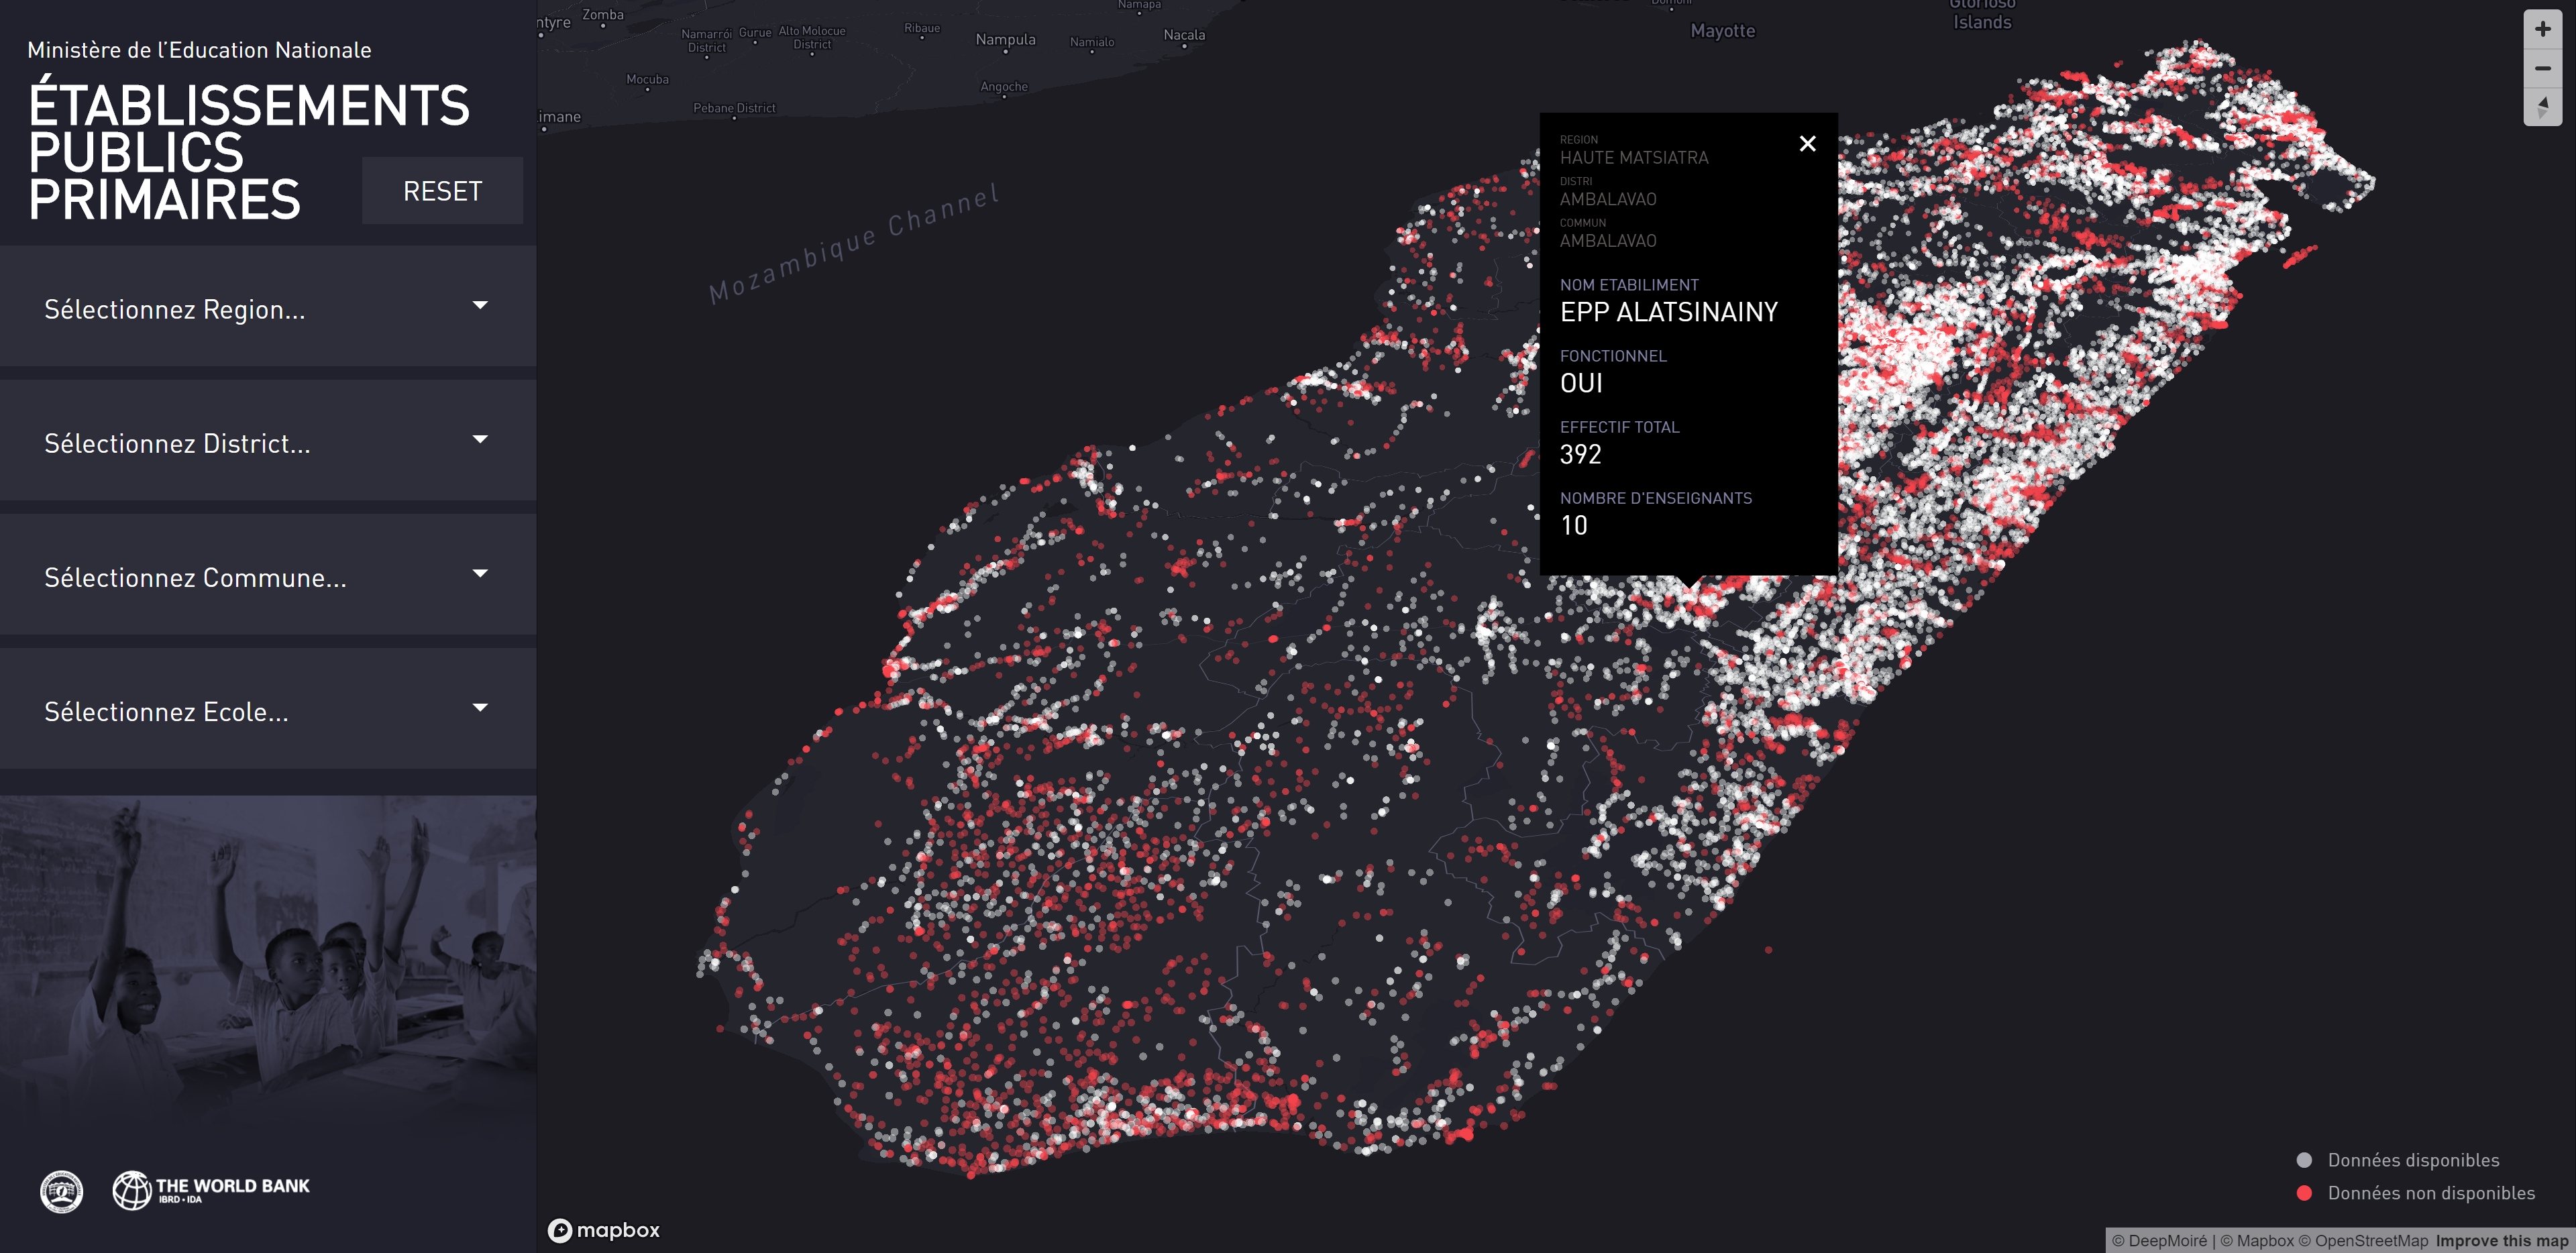
I developed the complete visual identity, interface and cartographic design of the platform. The dark basemap provided a restrained geographic background for a dense nationwide point dataset. Locations with linked school information were shown in white, while records without corresponding data were highlighted in red, making data availability itself visible.
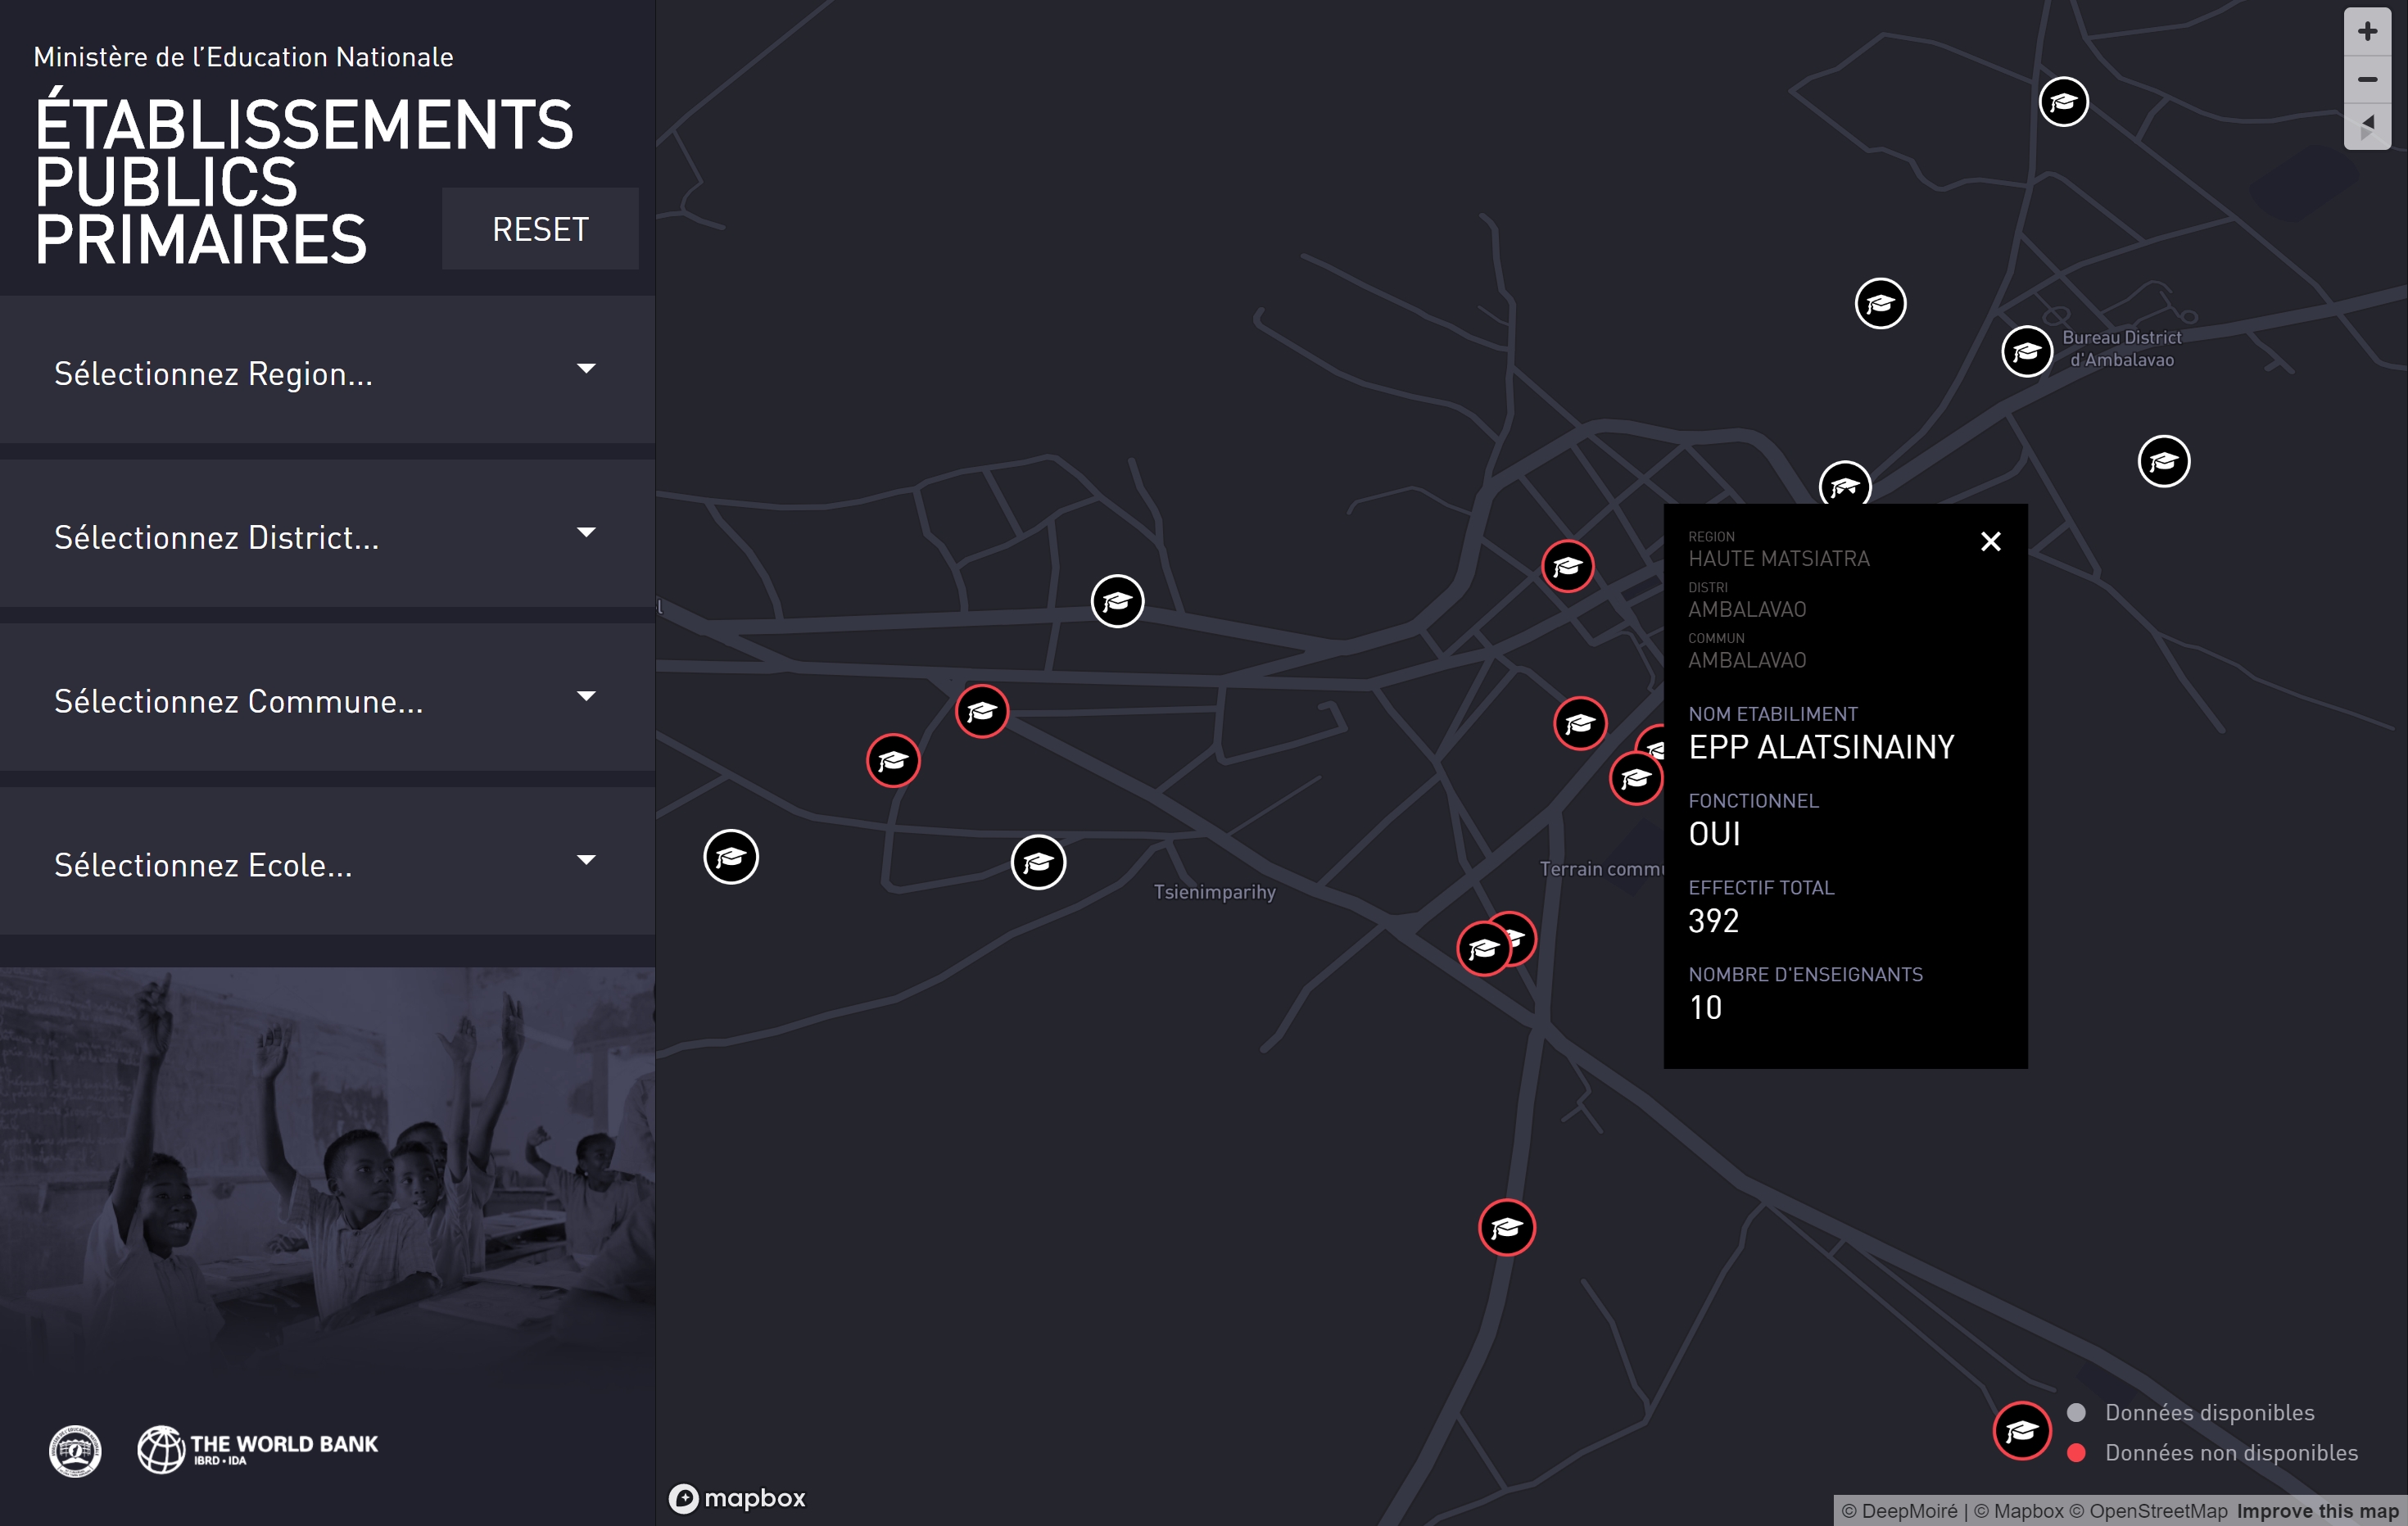
At closer zoom levels, the map introduced more detailed school symbols and interactive information. The interface separated the public school-search workflow from the analytical data view, supporting a nationwide reading, regional comparison and detailed inspection of individual schools without presenting every control simultaneously.
Technical Approach
The GIS web application was developed with Mapbox GL JS and a custom Mapbox Studio basemap. D3.js supported data loading and calculation, while Turf.js handled geographic operations including centers, bounding boxes and map extents for filtered selections.
School-level and regional information was stored as GeoJSON and rendered through separate Mapbox sources and layers. Mapbox expressions controlled marker size, color, opacity and zoom-dependent behavior. The filtering system synchronized the visible layers, interface controls, record totals and map viewport in response to each selection.
The custom interface was implemented with JavaScript, HTML and CSS, with Bootstrap Select used for searchable hierarchical controls.
Technologies
- Mapbox GL JS
- Mapbox Studio
- JavaScript
- HTML/CSS
- D3.js
- Turf.js
- GeoJSON
- CSV
- csv2geojson
- Bootstrap Select
Data Workflow
I developed a separate spatial data-processing workflow to keep integration and transformation out of the public-facing application. It combined the geographic source with multiple official CSV datasets, matched records across administrative and institutional fields, normalized missing values, calculated derived indicators and generated the production GeoJSON files used by the map.
Separating preprocessing from the live WebGIS reduced the amount of work required in the browser. Instead of repeating expensive joins and transformations whenever the map loaded, the application received datasets already prepared for filtering, visualization and interaction.
The workflow also established a repeatable update process. I prepared operational tutorials and conducted live online classes covering Mapbox Studio, application structure, data preparation and publication, enabling the Ministry's technical team to regenerate the datasets and maintain the platform as official information changed.
Outcome
The completed WebGIS platform was launched as a public resource for exploring Madagascar's primary schools and related education data. It gave citizens and institutional users access to individual school information and broader geographic patterns while clearly showing where official data was complete or unavailable.
For the Ministry, the preprocessing workflow, documentation and training established a practical method for maintaining the source data and publishing future updates without rebuilding the application. The project connected public-facing interactive mapping, spatial data processing, institutional transparency and long-term technical handover within one system.