
Commercial product configuration / outdoor acoustic and public-warning systems
Interactive Speaker Coverage Map Configurator
Overview
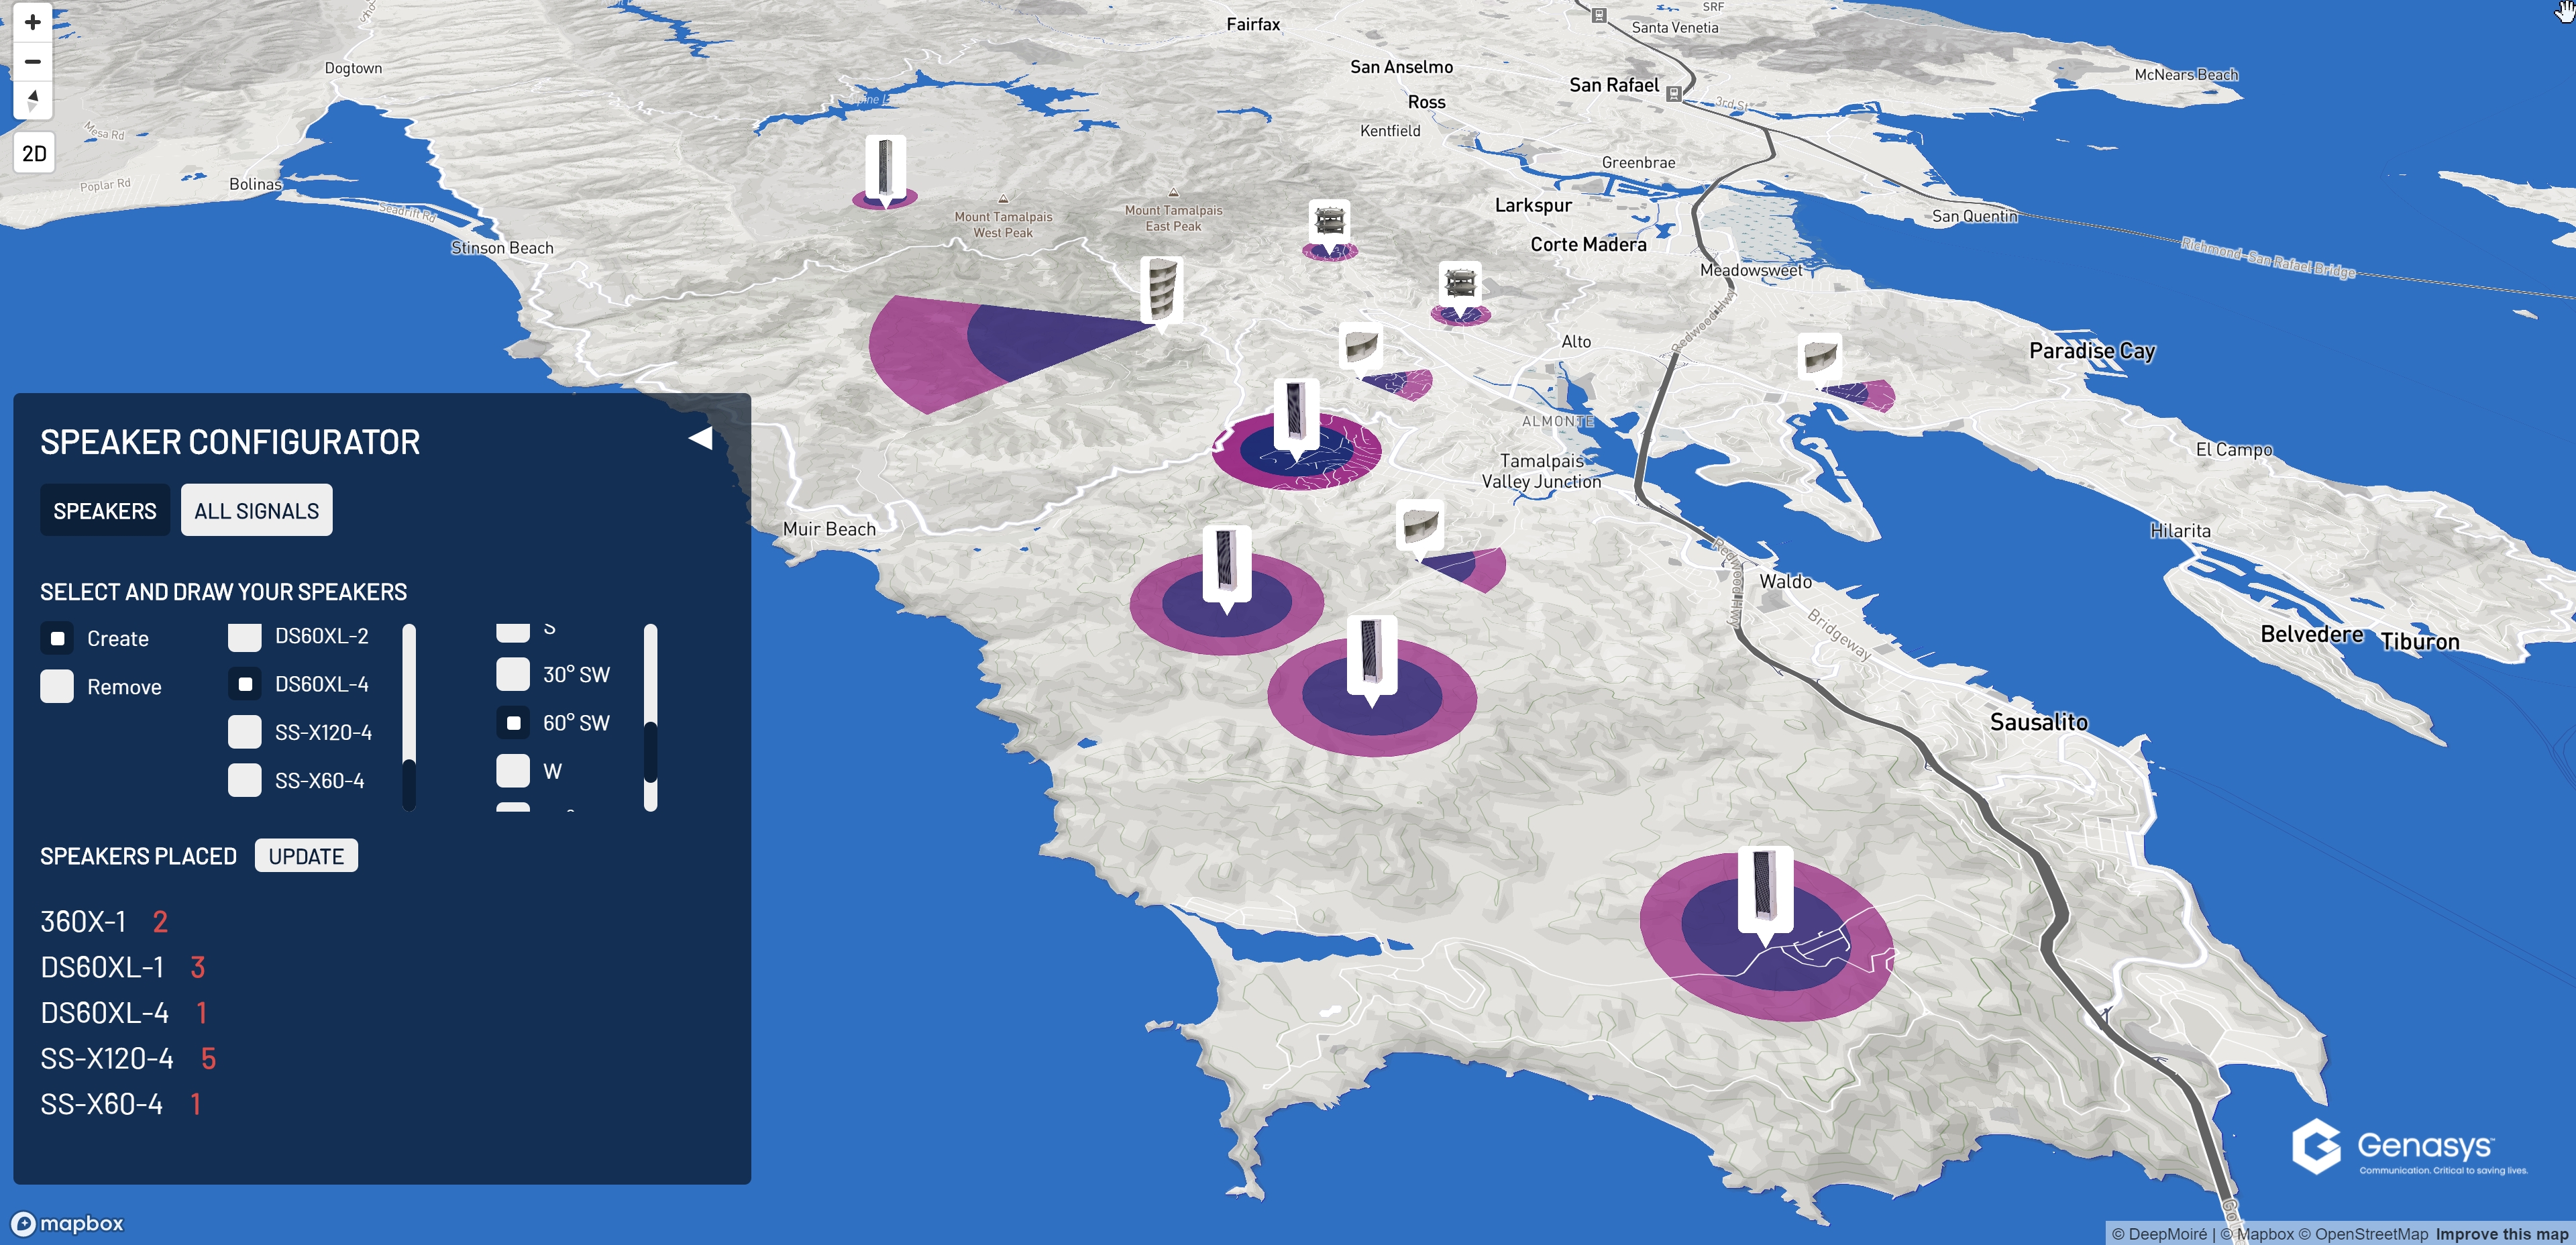
This project involved the design and development of an interactive map-based configurator for outdoor speaker systems. Instead of displaying predefined locations, the application turned the map itself into a spatial design interface: potential customers could select products, create speaker objects directly on the map, position and orient them, visualize their geographic coverage, and build a complete configuration for a quote request. The application combined custom cartographic design, direct map interaction, dynamic geometry generation, product logic, and a backend connected to Firebase / Firestore.
Challenge
The main challenge was to translate a physical product catalogue into an intuitive spatial configuration workflow. Different speaker models behaved differently: some provided 360-degree coverage, while directional products generated limited acoustic beams that had to be oriented toward specific areas. Users therefore needed to do more than place points. They had to create and edit objects, understand gaps and overlaps, move equipment, rotate directional units, compare combined coverage, and maintain a clear inventory of the configuration without losing the geographic context.
Solution
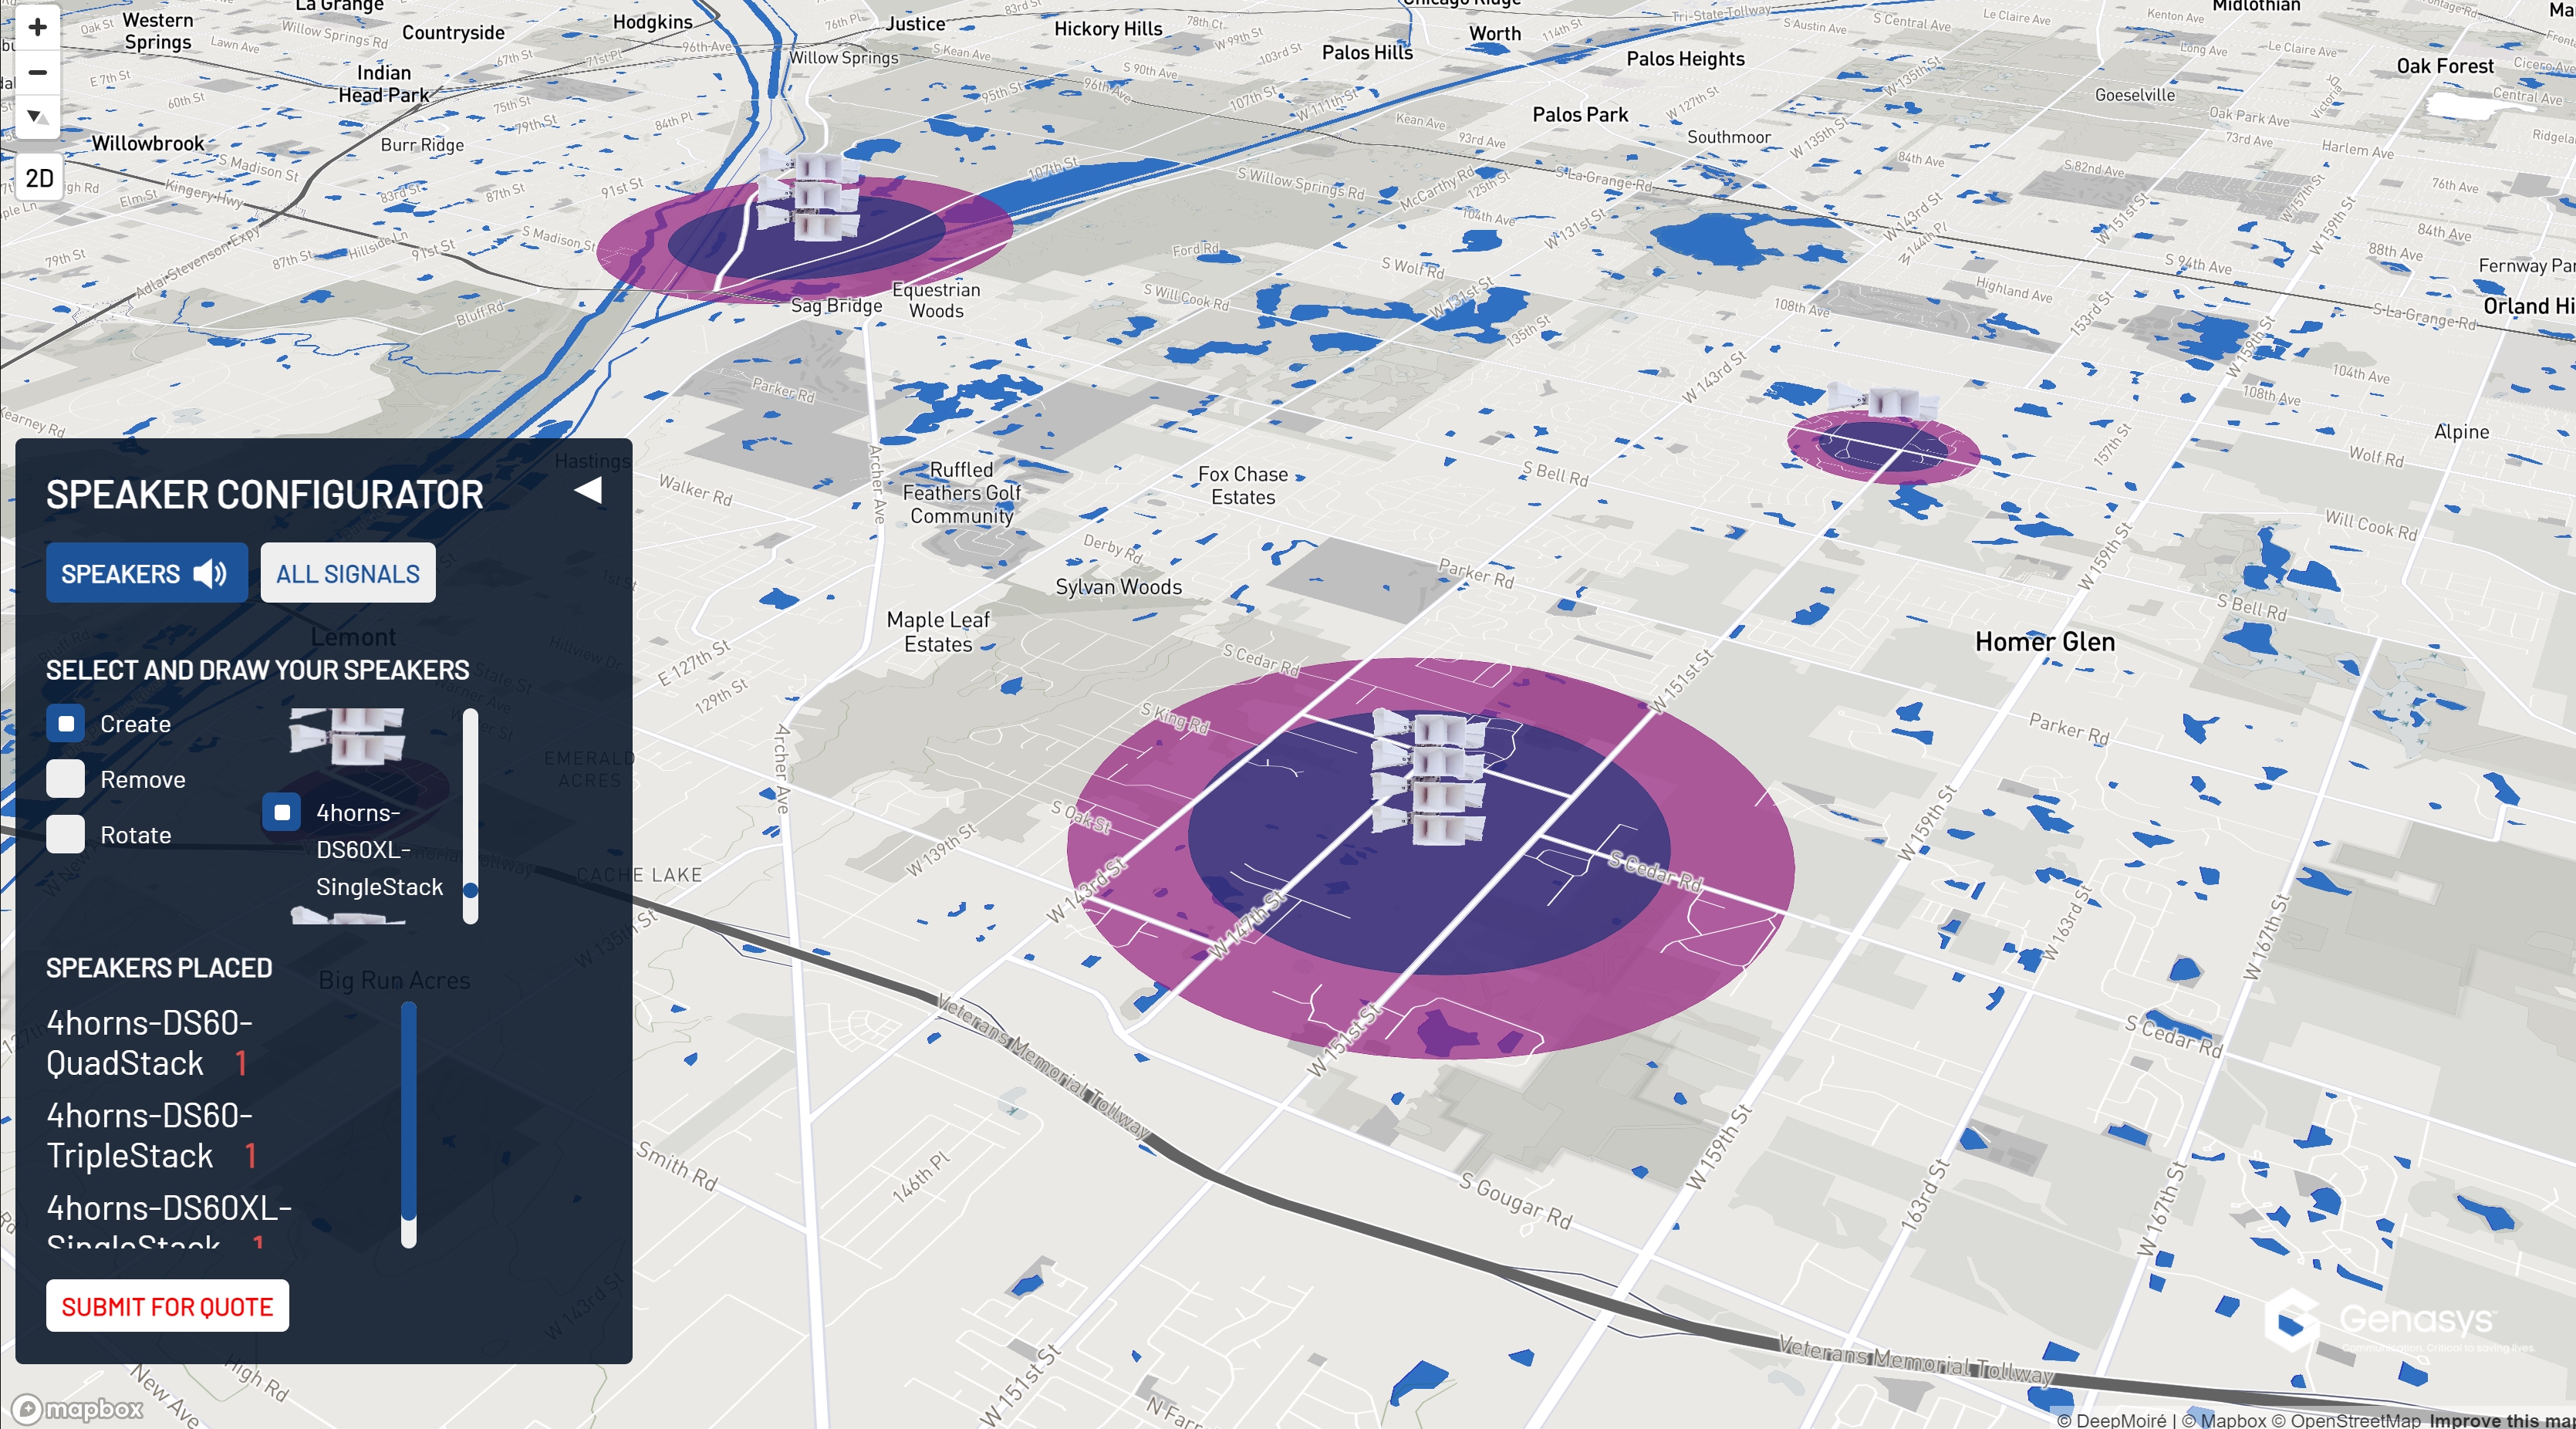
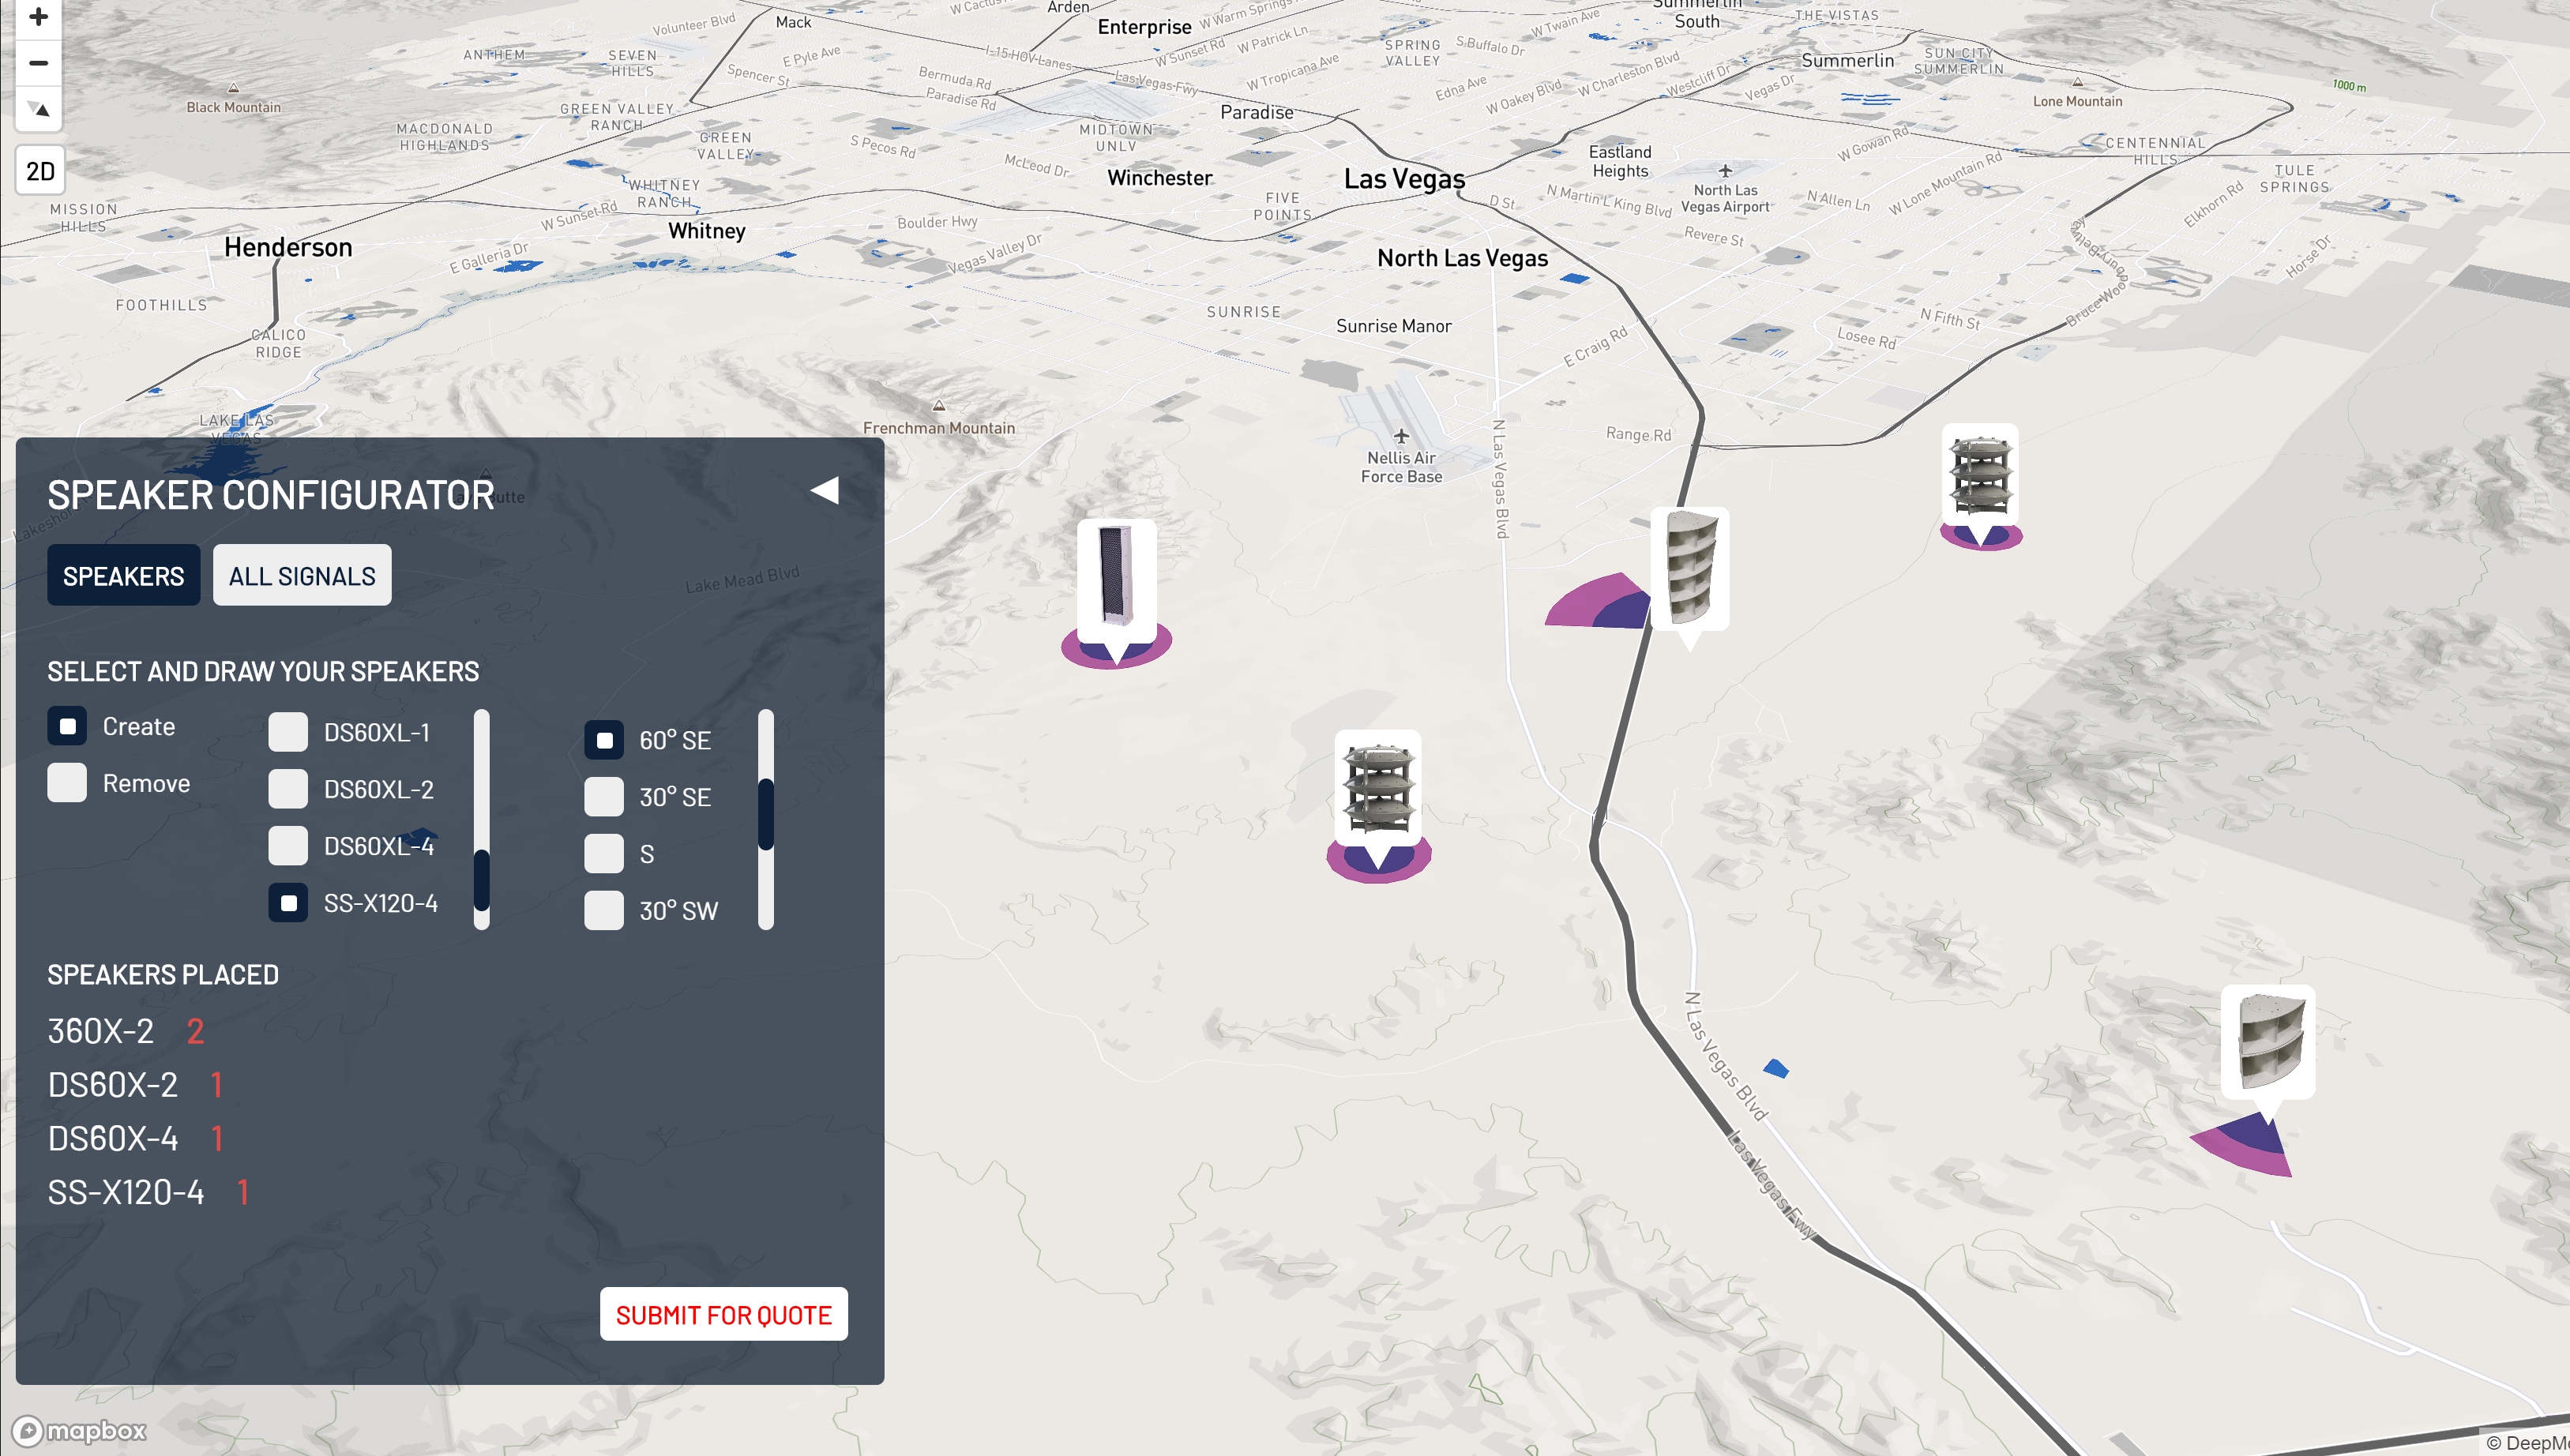
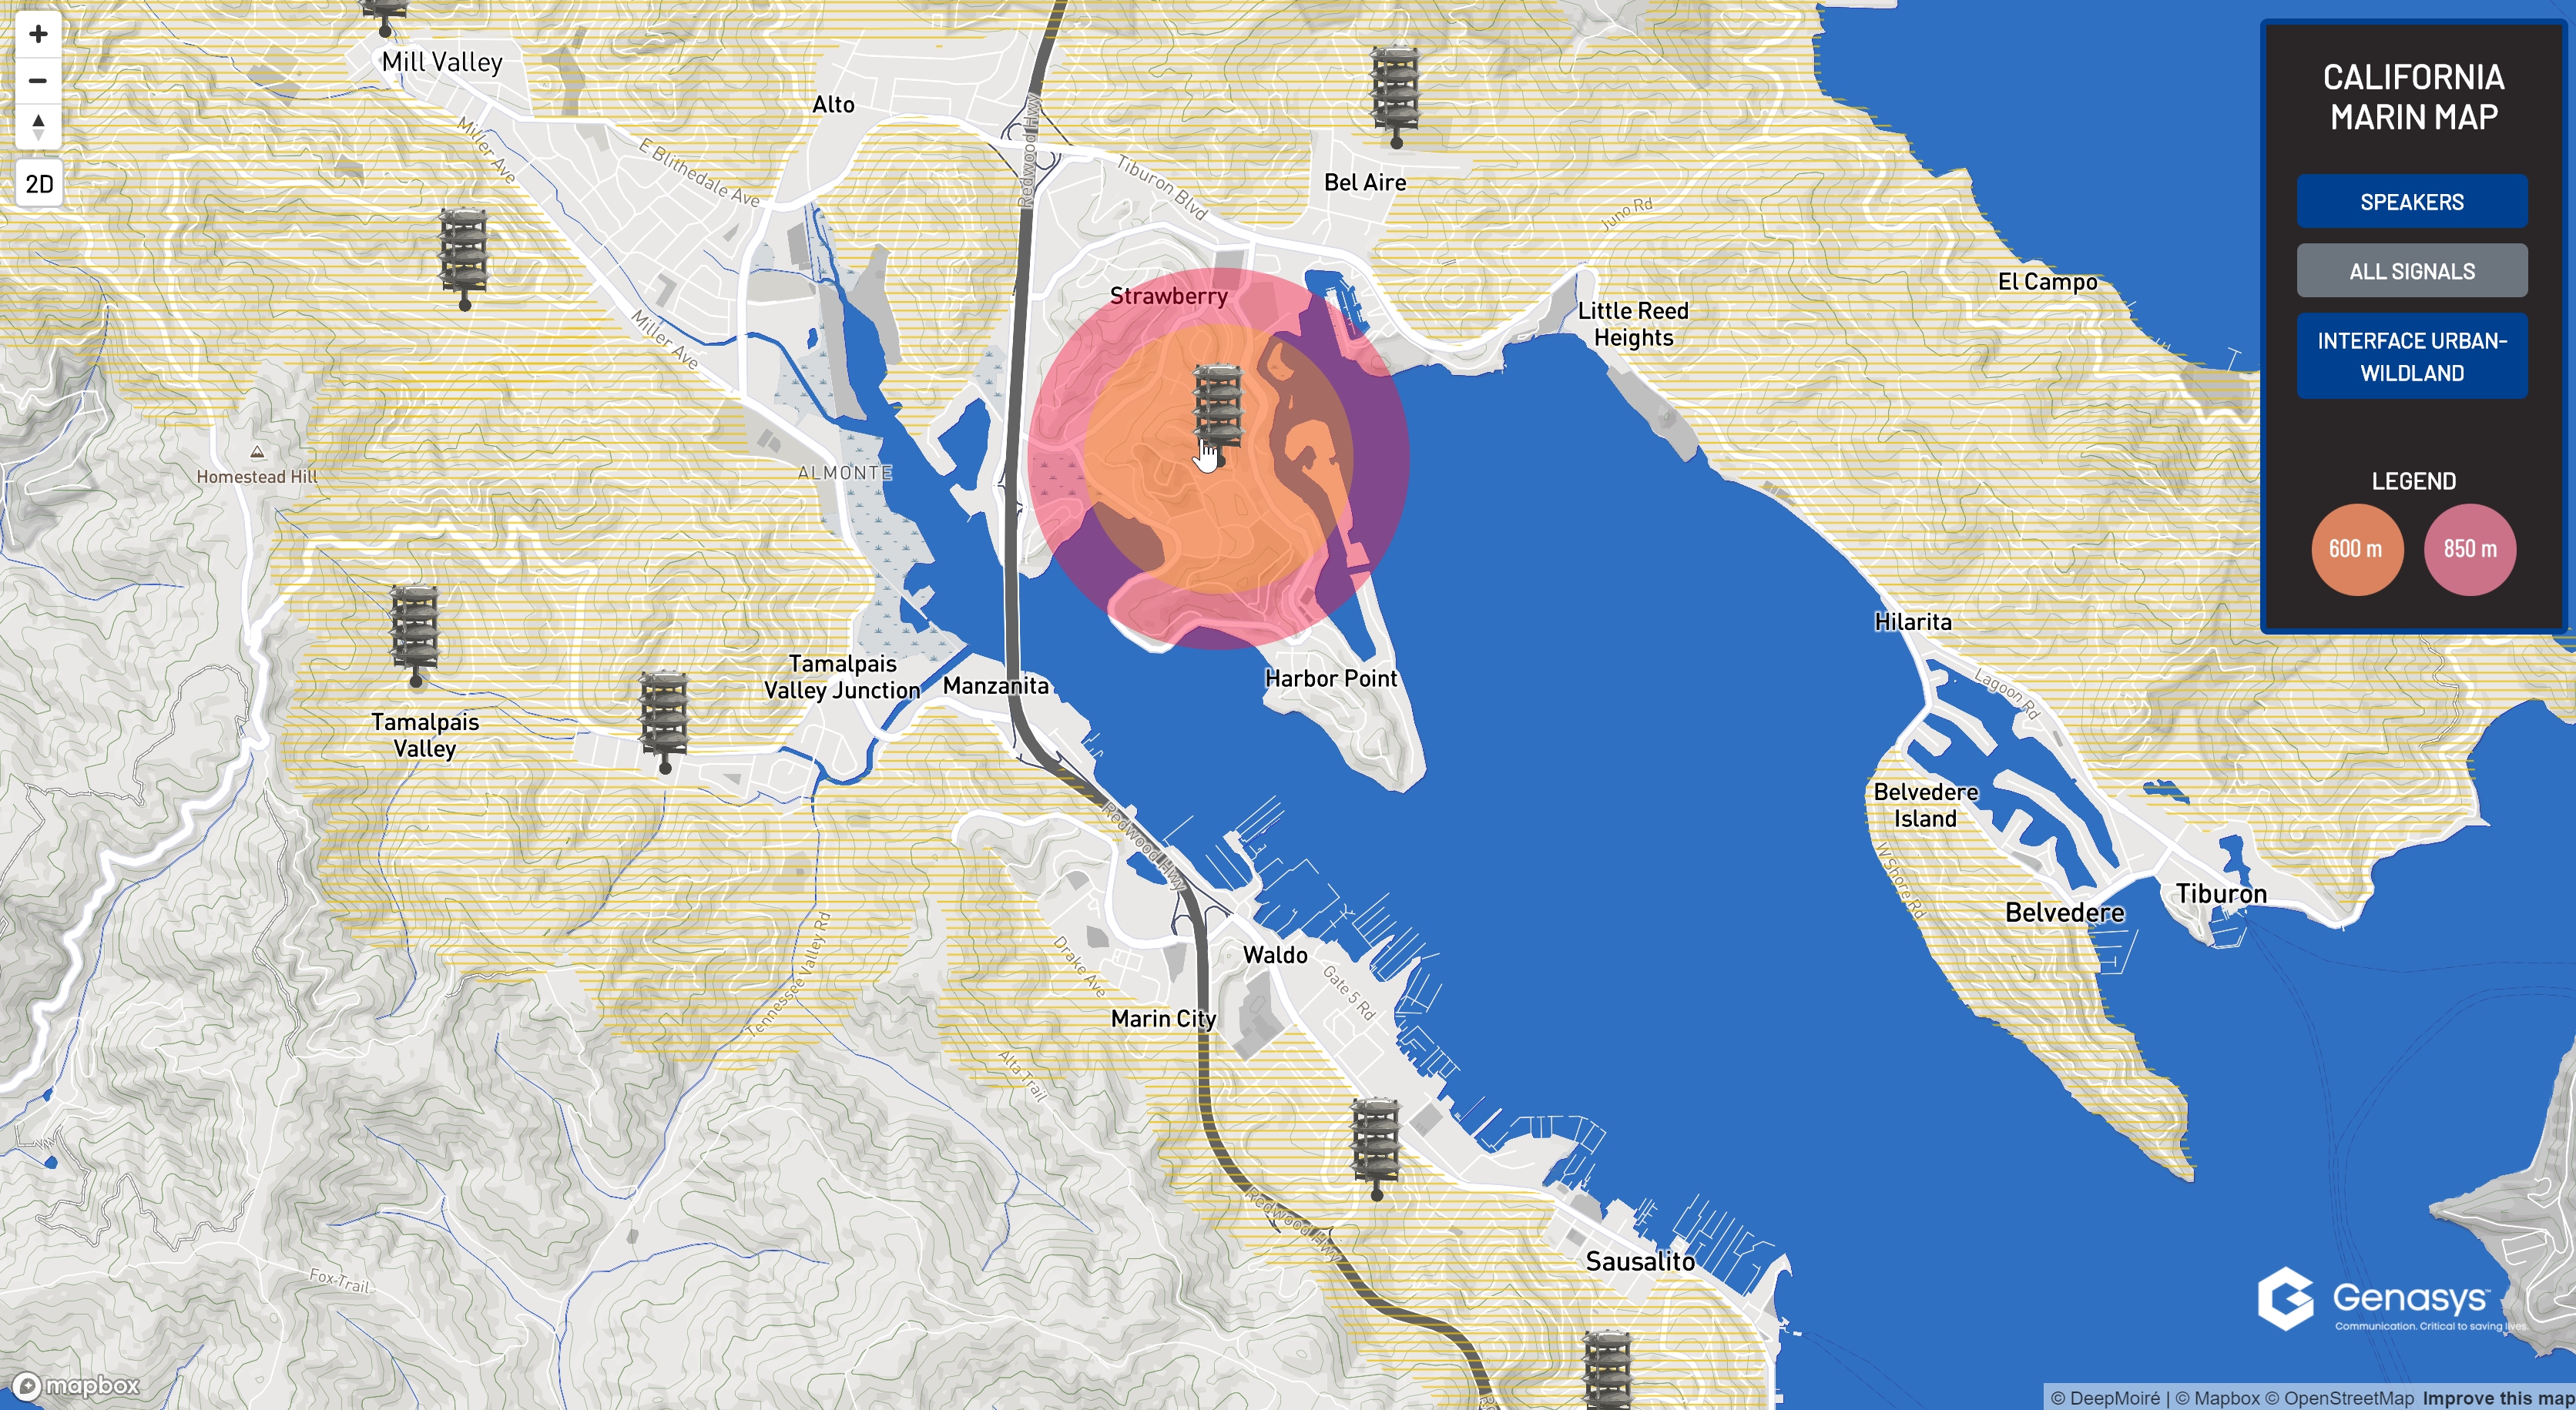
I developed a custom Mapbox application in which users could select a speaker model and create it by clicking directly on the map. Each new speaker generated both a product object and its corresponding coverage geometry. Users could subsequently move, rotate or remove placed speakers, while the coverage geometry updated with the object. Omnidirectional products generated circular coverage, while directional products used beam sectors based on their range, beam width and orientation. Additional four-horn and stacked configurations were incorporated into the product system. An All Signals mode displayed the complete coverage layout simultaneously, while the interface automatically maintained a grouped list of the products and quantities placed. Once the configuration was complete, users could submit it through a quote workflow that included contact information, the map configuration and a generated map image.
Design & Data Visualization
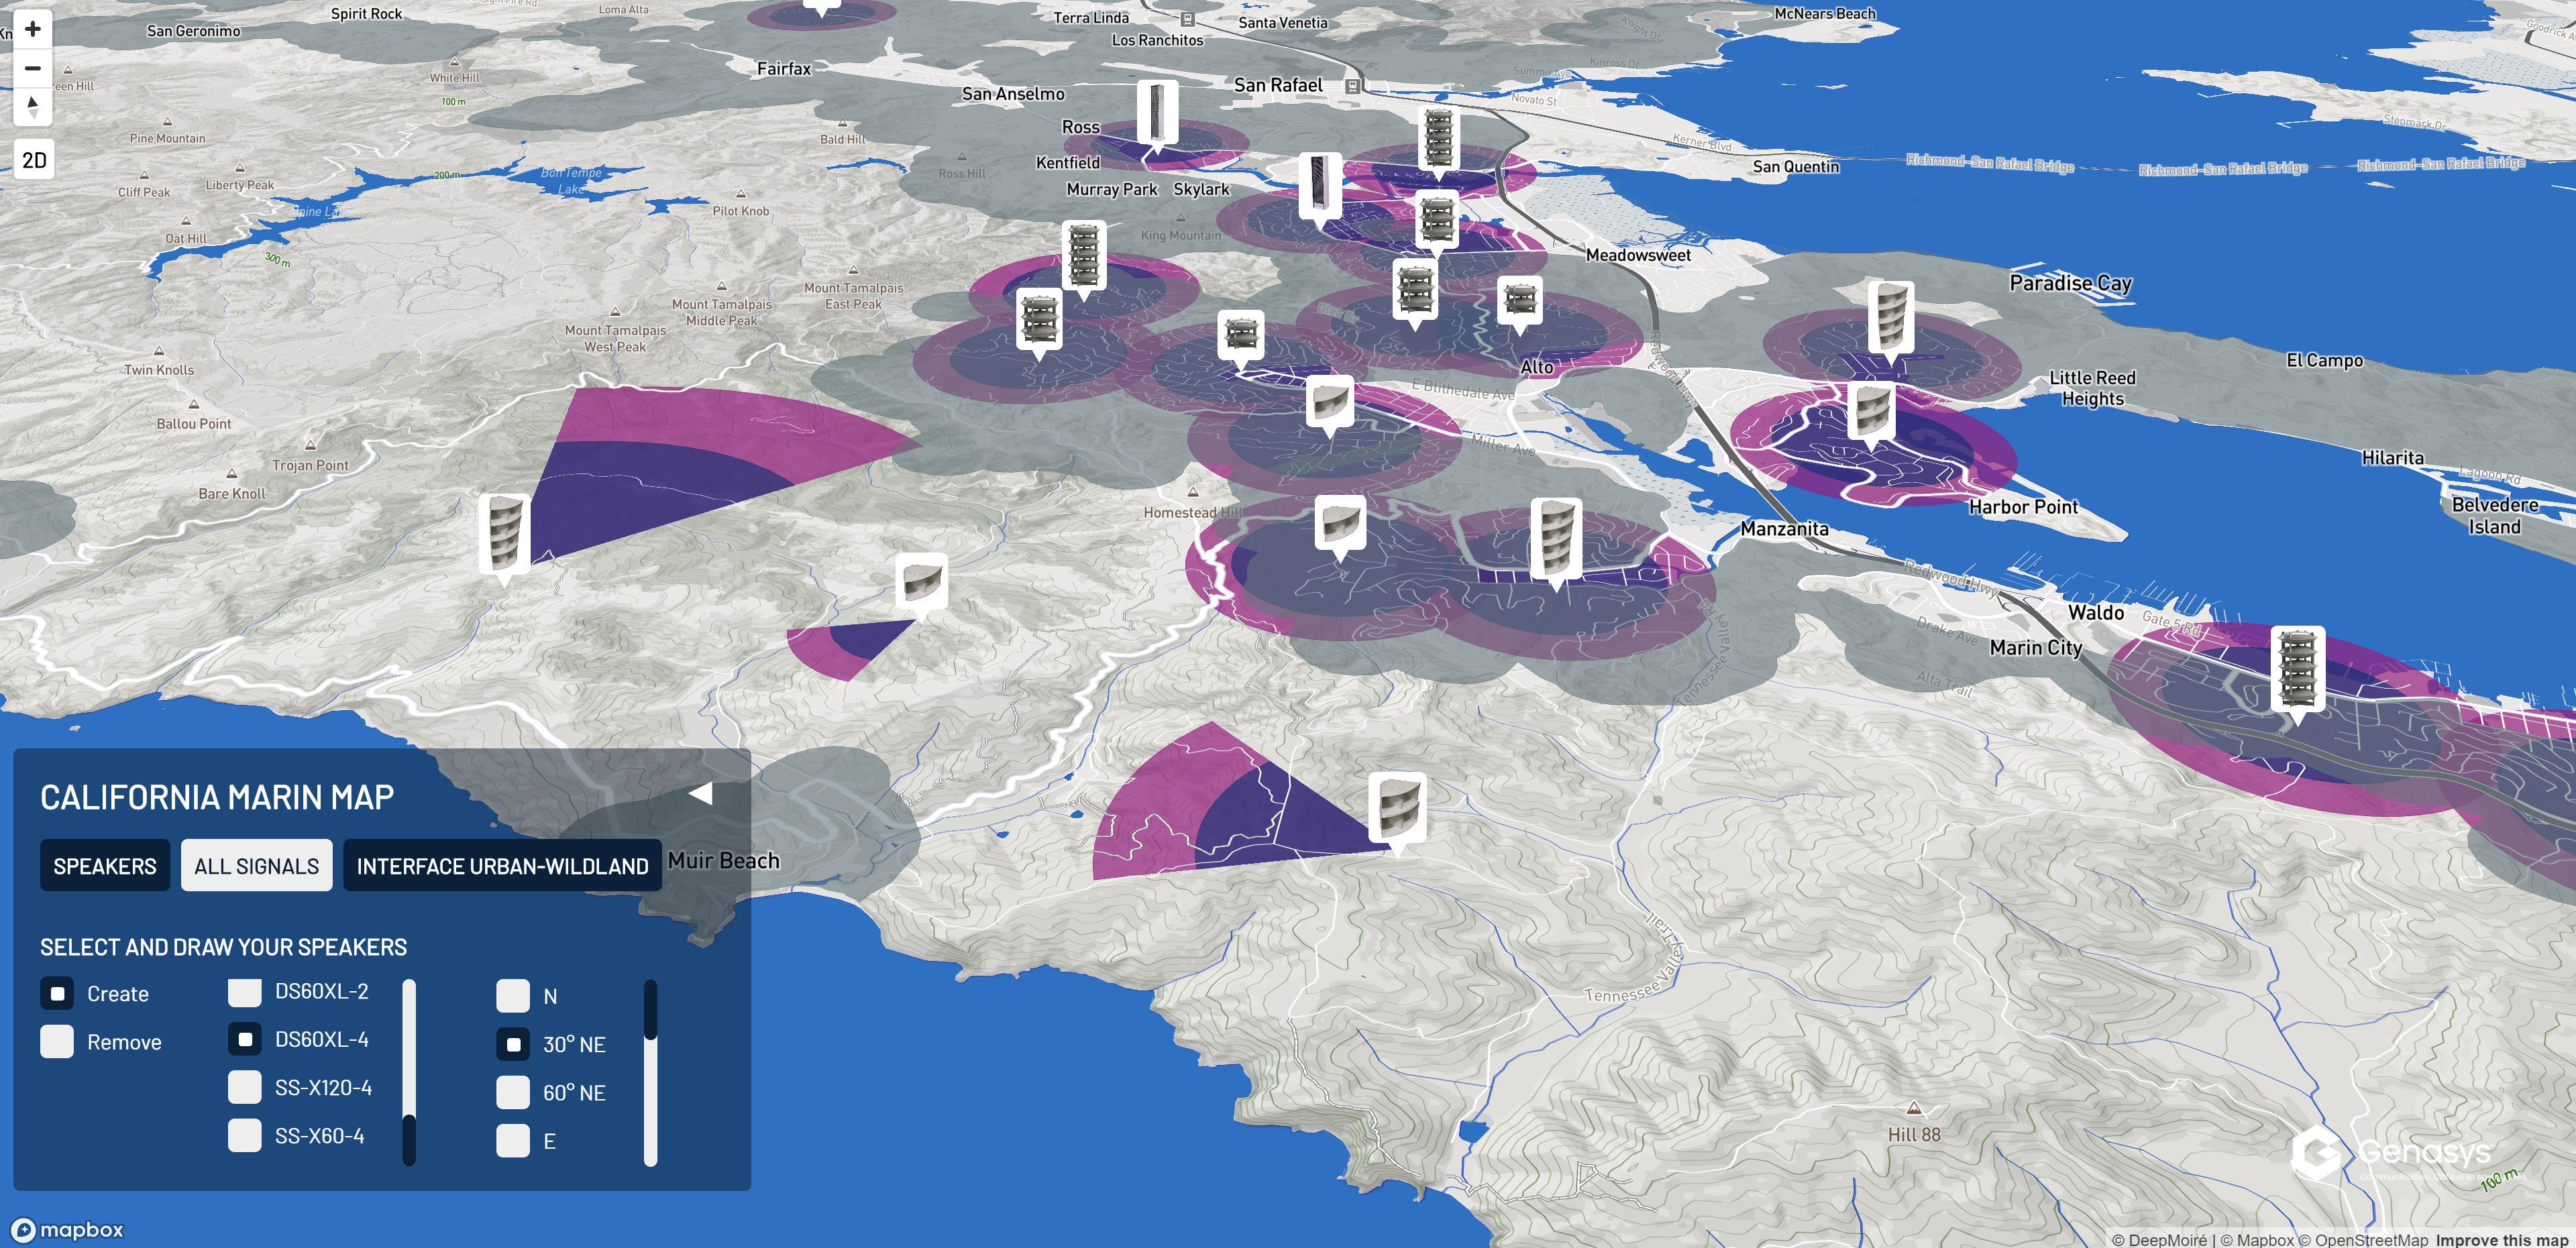
The design treated the map as an active configuration workspace rather than a background visualization. Custom product icons, translucent signal footprints, geographic context and interface controls were designed as one visual system. Omnidirectional products used concentric circular coverage geometries, while directional models used projected sectors so their orientation was immediately legible. Transparency made overlap between multiple signals visible without hiding the basemap. The floating control panel grouped product selection, object actions, directional controls, signal visibility and the live equipment list within the same map-first workflow. Interaction design was iterated specifically around directional products, ultimately allowing users to rotate already placed objects through a dedicated Rotate mode instead of relying only on a detached direction selector.
Technical Approach
Mapbox GL JS provided the interactive mapping environment and custom layers, while Turf.js generated speaker coverage geometries dynamically in the browser. When a user created an object, its coordinates were combined with the selected product parameters. Directional products used calculated start and end bearings to generate sector polygons, while omnidirectional products used circular geometries. The resulting points and polygons were stored as GeoJSON features and pushed into Mapbox sources immediately. The same model supported direct manipulation: when a speaker was moved or rotated, its associated coverage geometry was recalculated and updated so the product and its spatial footprint remained synchronized. D3.js and custom JavaScript supported data loading and interface logic, while Mapbox layer filters controlled individual and combined coverage views.
Technologies
- Mapbox GL JS
- Turf.js
- D3.js
- JavaScript
- GeoJSON
- HTML/CSS
- jQuery
- Bootstrap
- Firebase
- Firestore
Data Workflow
The frontend communicated with a backend connected to Firebase / Firestore to persist application data, including user configurations and the information required by the quote workflow. The completed submission process connected the spatial configuration created on the map with customer contact data and the generated map image, allowing the configured system to move from an interactive design session into a quote request.
Outcome
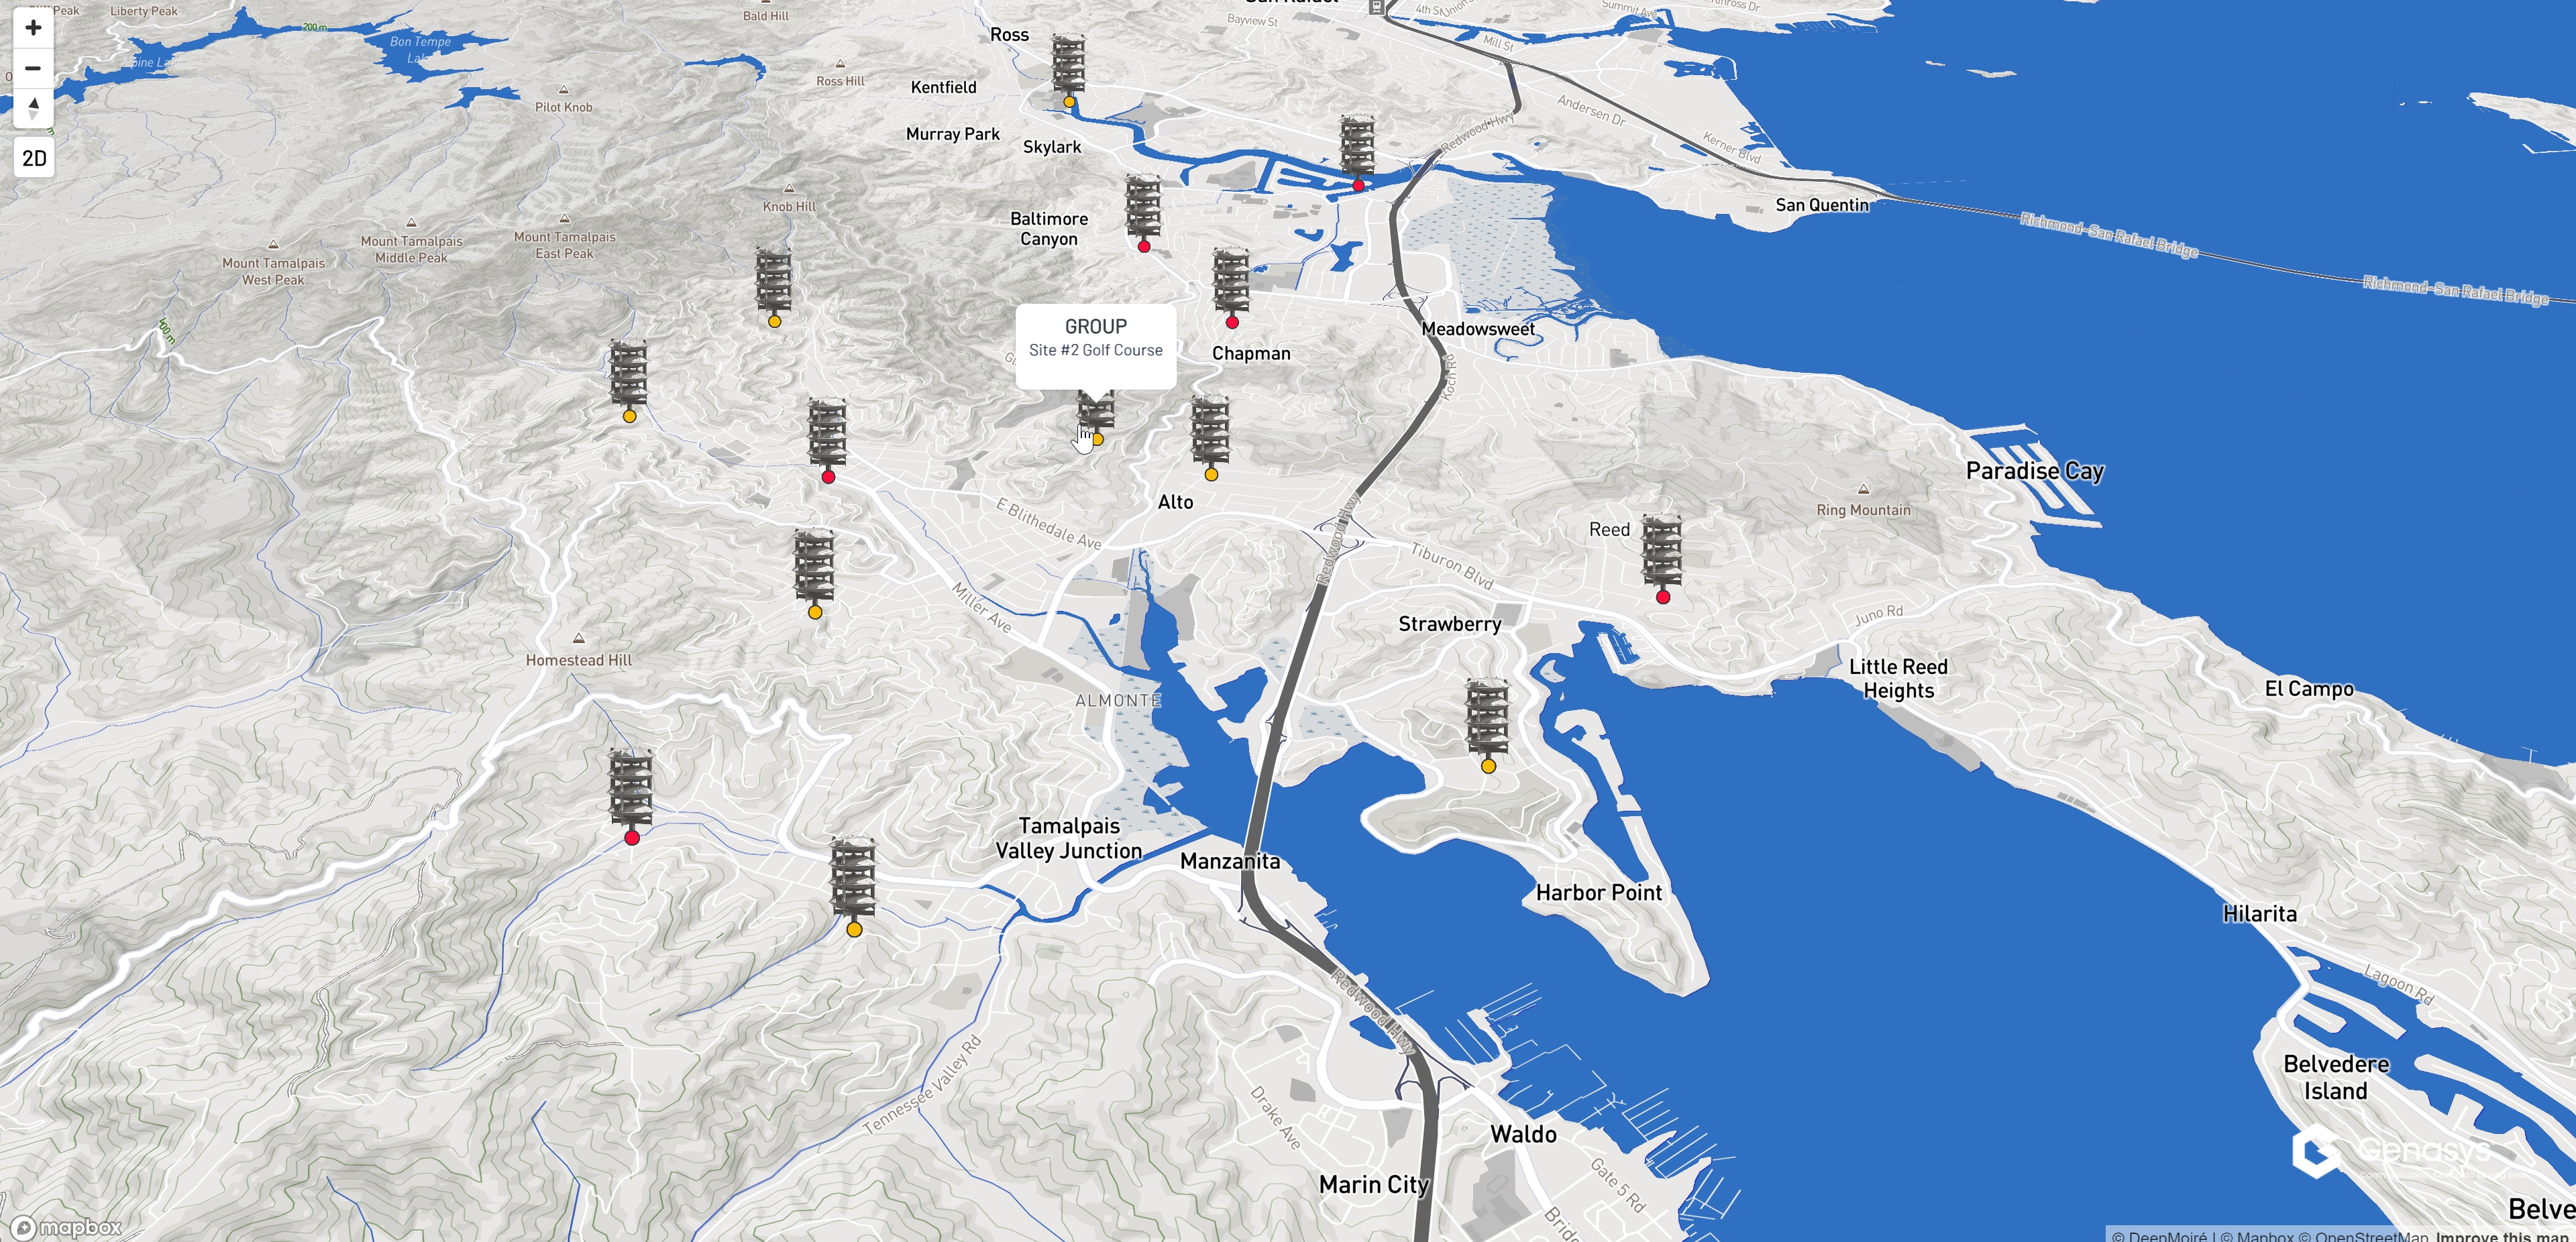
The finished application transformed a product catalogue into an interactive spatial configuration tool. Potential customers could design a system directly in geographic context: create speaker objects, choose among multiple product and stack configurations, position equipment, rotate directional units, visualize individual and overlapping coverage areas, revise the layout, and see an automatically updated inventory of the resulting configuration. The same interface then carried the completed design into a quote-submission workflow, connecting map-based product design with the commercial process that followed it.