
Green technology intelligence / regional innovation analysis
Global Green Technology Interactive Map & Geospatial Dashboard
Overview
I designed and developed a custom geospatial dashboard and interactive map for a technology-intelligence product focused on green technologies. The application transformed a large patent-based dataset covering approximately 5,000 regions, 100 green technologies grouped into 10 broader technology fields, and historical data from 2010 to 2023 into an explorable geographic interface.
The work covered the complete application, including graphic and interface design, cartographic design, interactive data visualization, front-end development, data processing, and the connection between the client's evolving source data and the final visualization.
Challenge
The client already produced a substantial technology-intelligence dataset, but the information needed a geographic and interactive representation that could operate at several levels.
At the global scale, the application had to reveal where green-technology activity was concentrated and make large geographic patterns understandable. At the same time, users needed to move down to thousands of detailed subnational regions and access meaningful information for each one.
The interface therefore had to support both communication and analysis: it functioned as a storytelling tool for presenting the underlying research while also providing an interactive environment where users could independently explore the spatial data.
The application also needed to remain maintainable as the underlying dataset evolved. During development, the source-data structure was refined together with the client so that future updates could follow a consistent format without requiring the application to be rebuilt.
Solution
I developed several complementary ways of exploring the same geographic dataset rather than relying on a single map visualization.
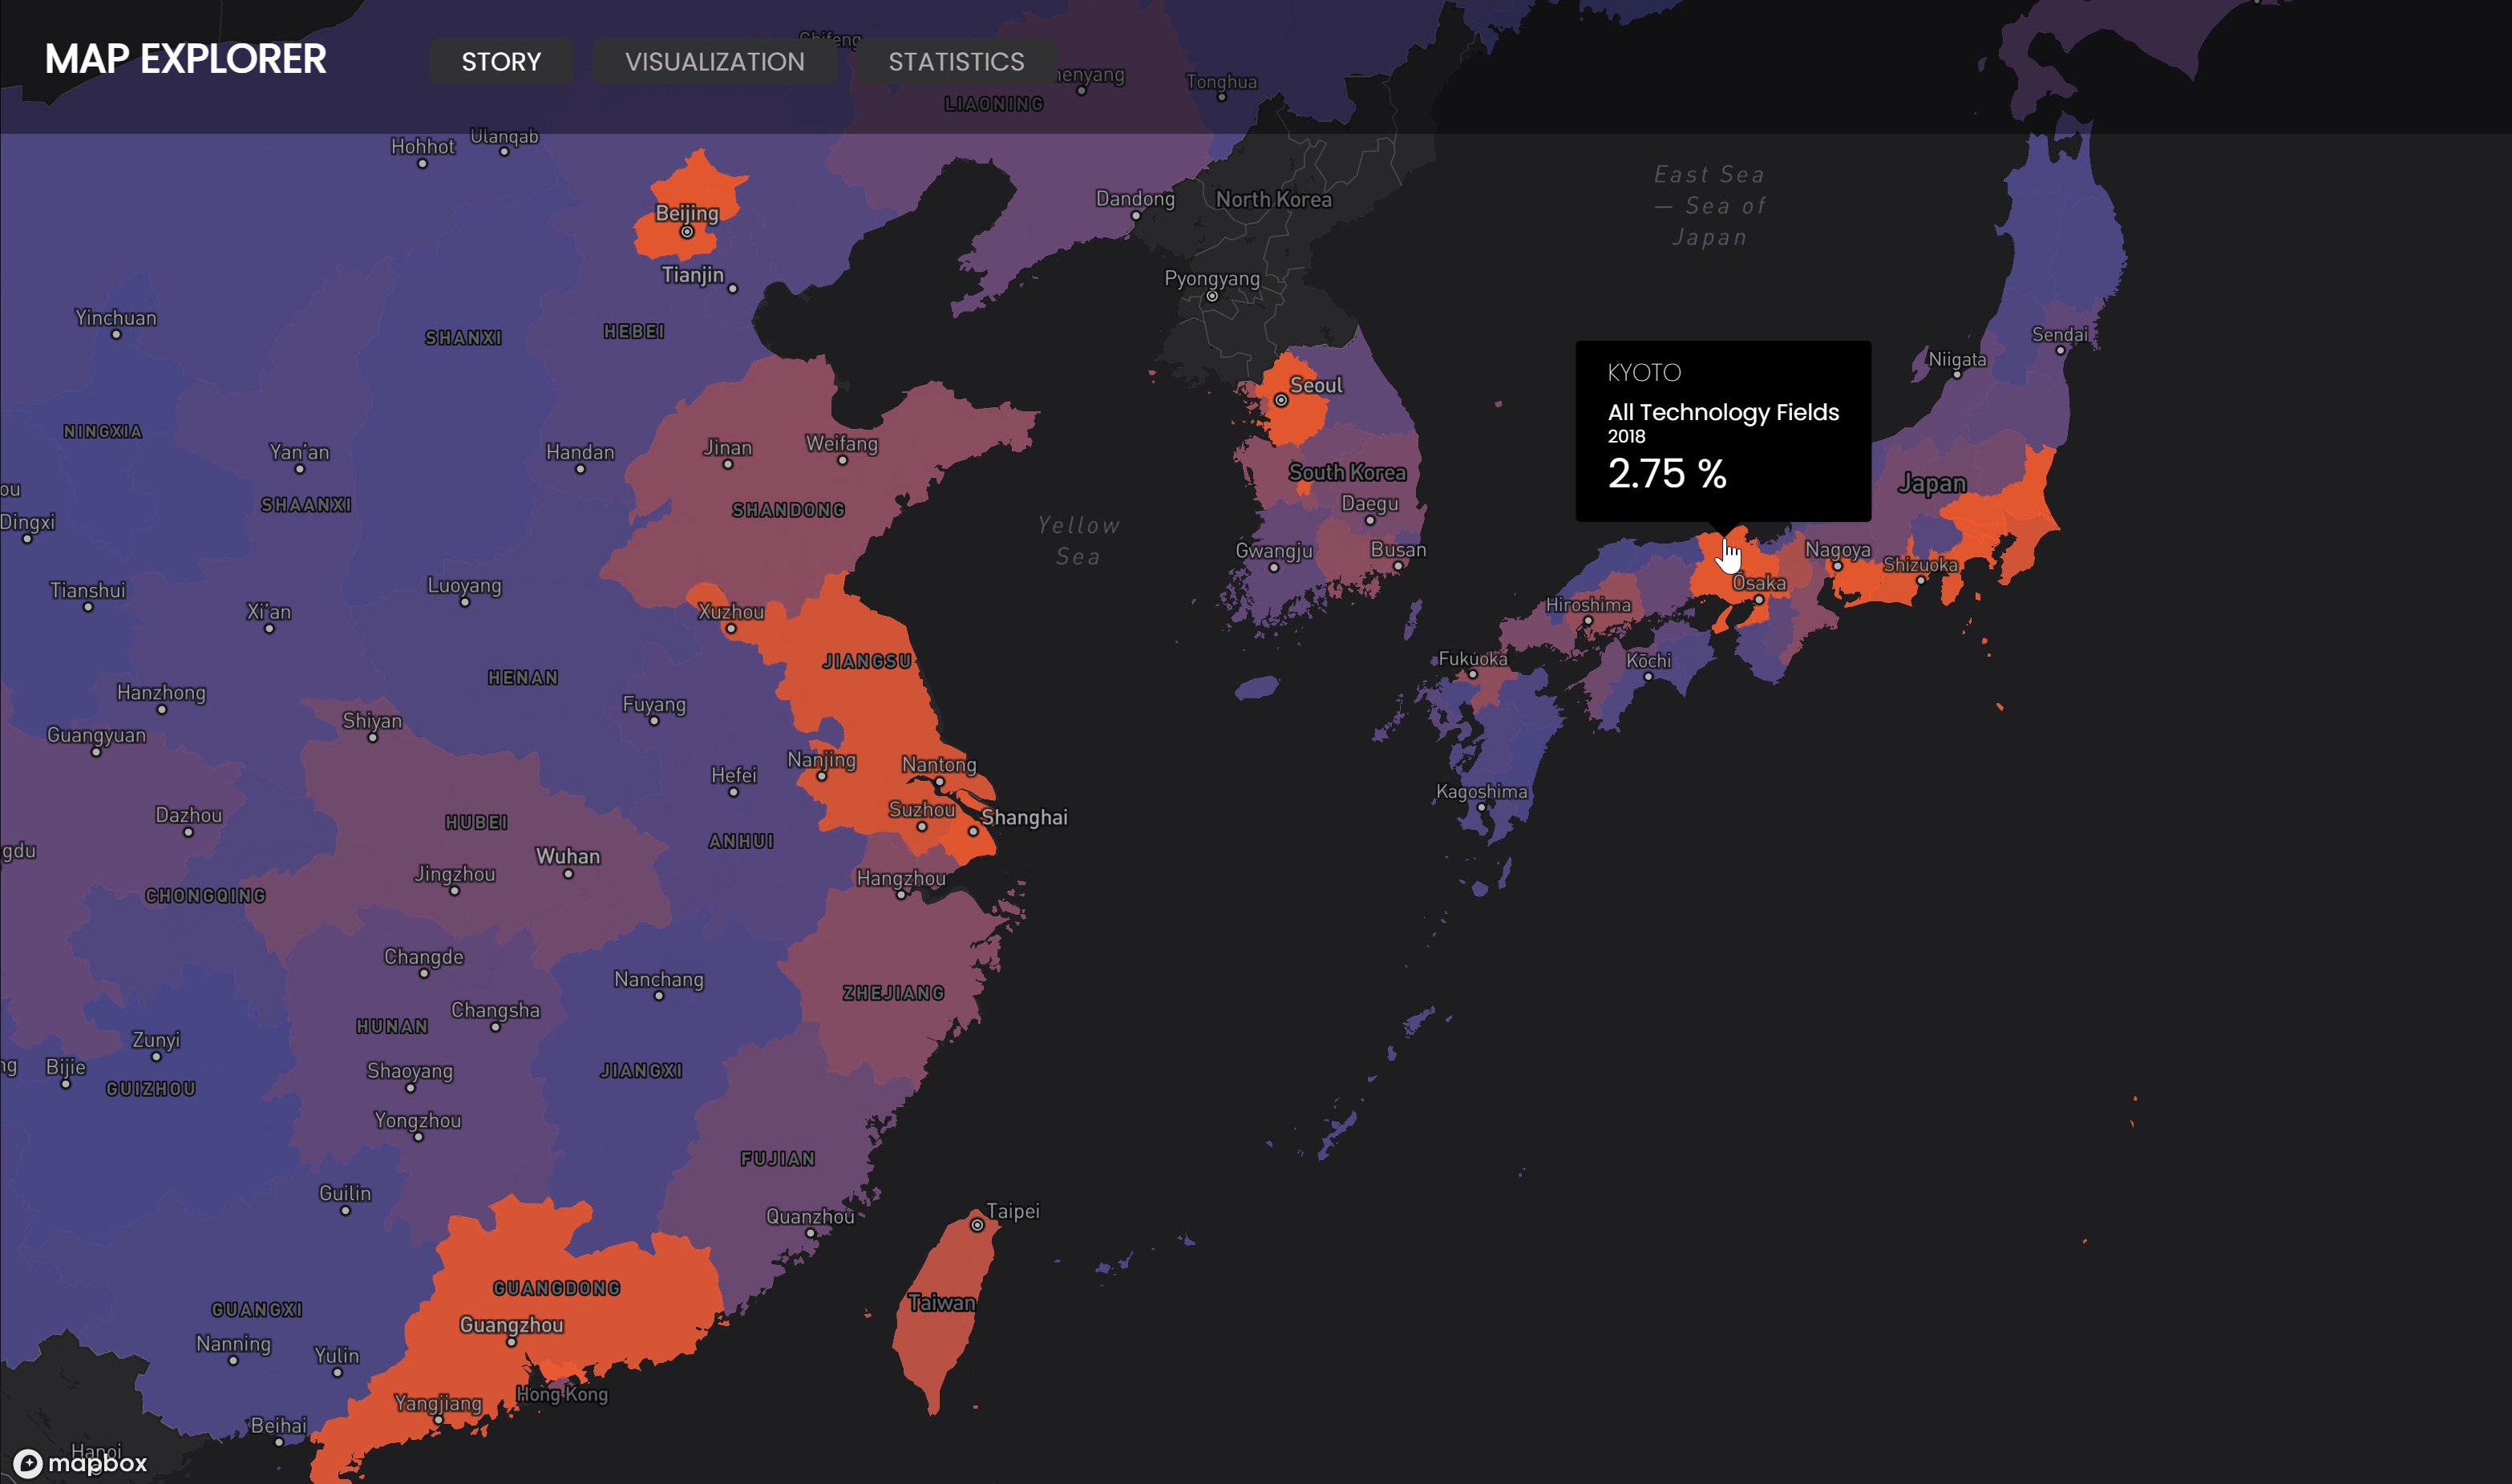
A guided Story section used a sequence of animated geographic views to introduce major spatial patterns across different regions of the world. This provided a controlled narrative entry point into a dataset that would otherwise have been difficult to interpret from a single global view.
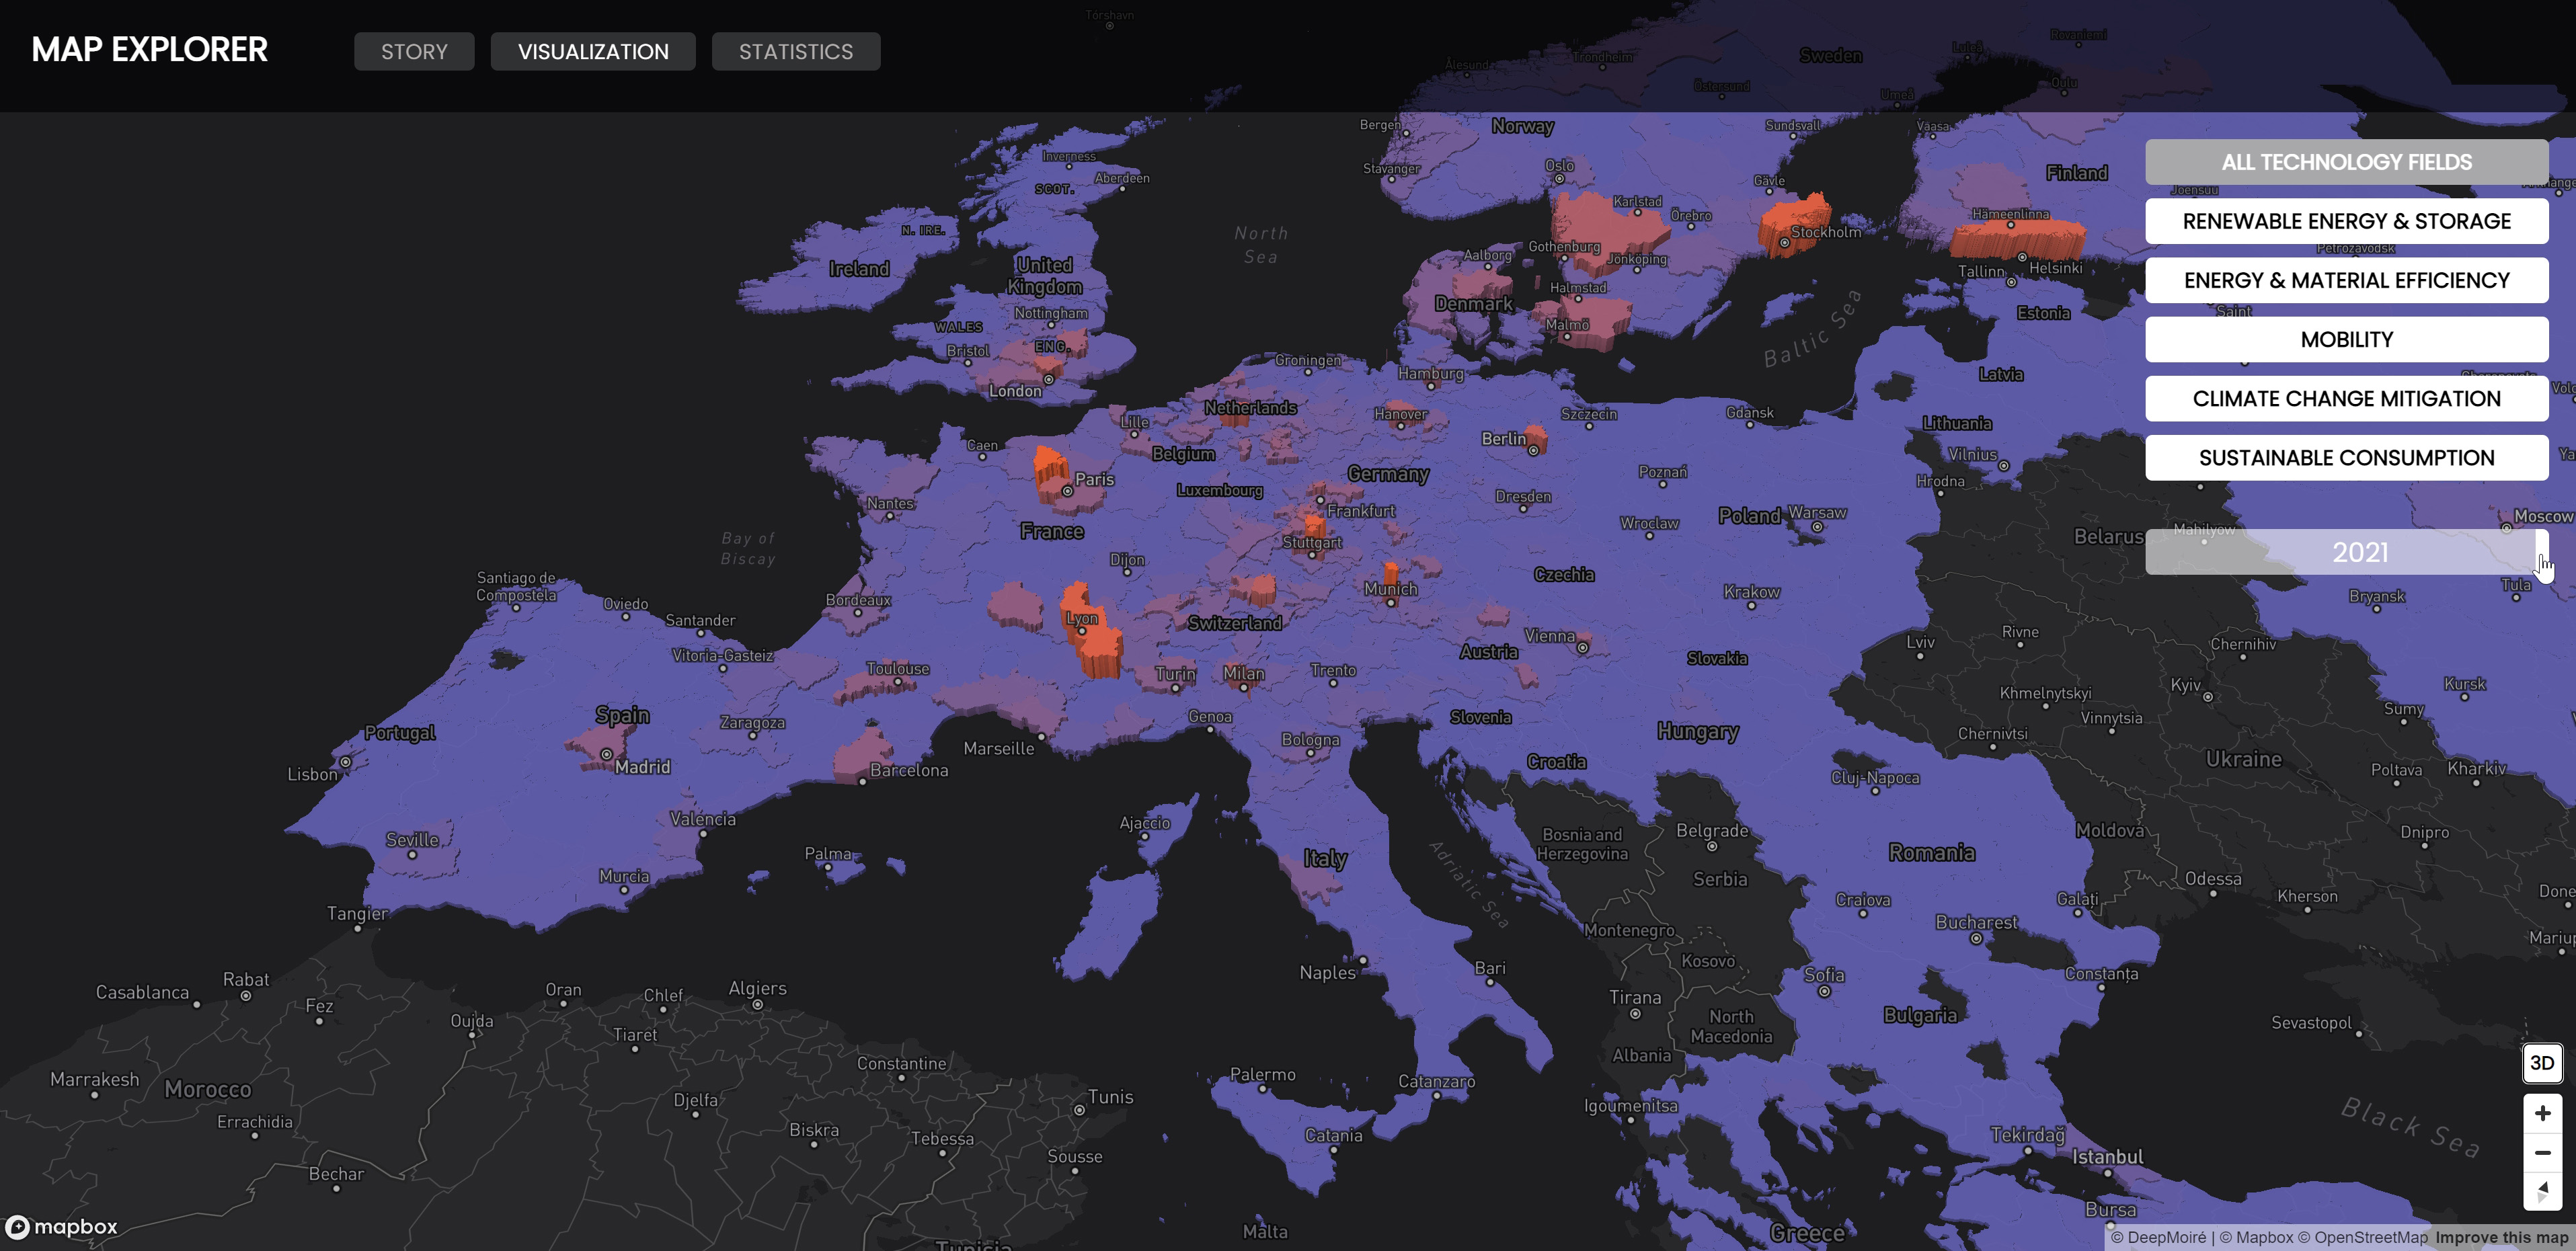
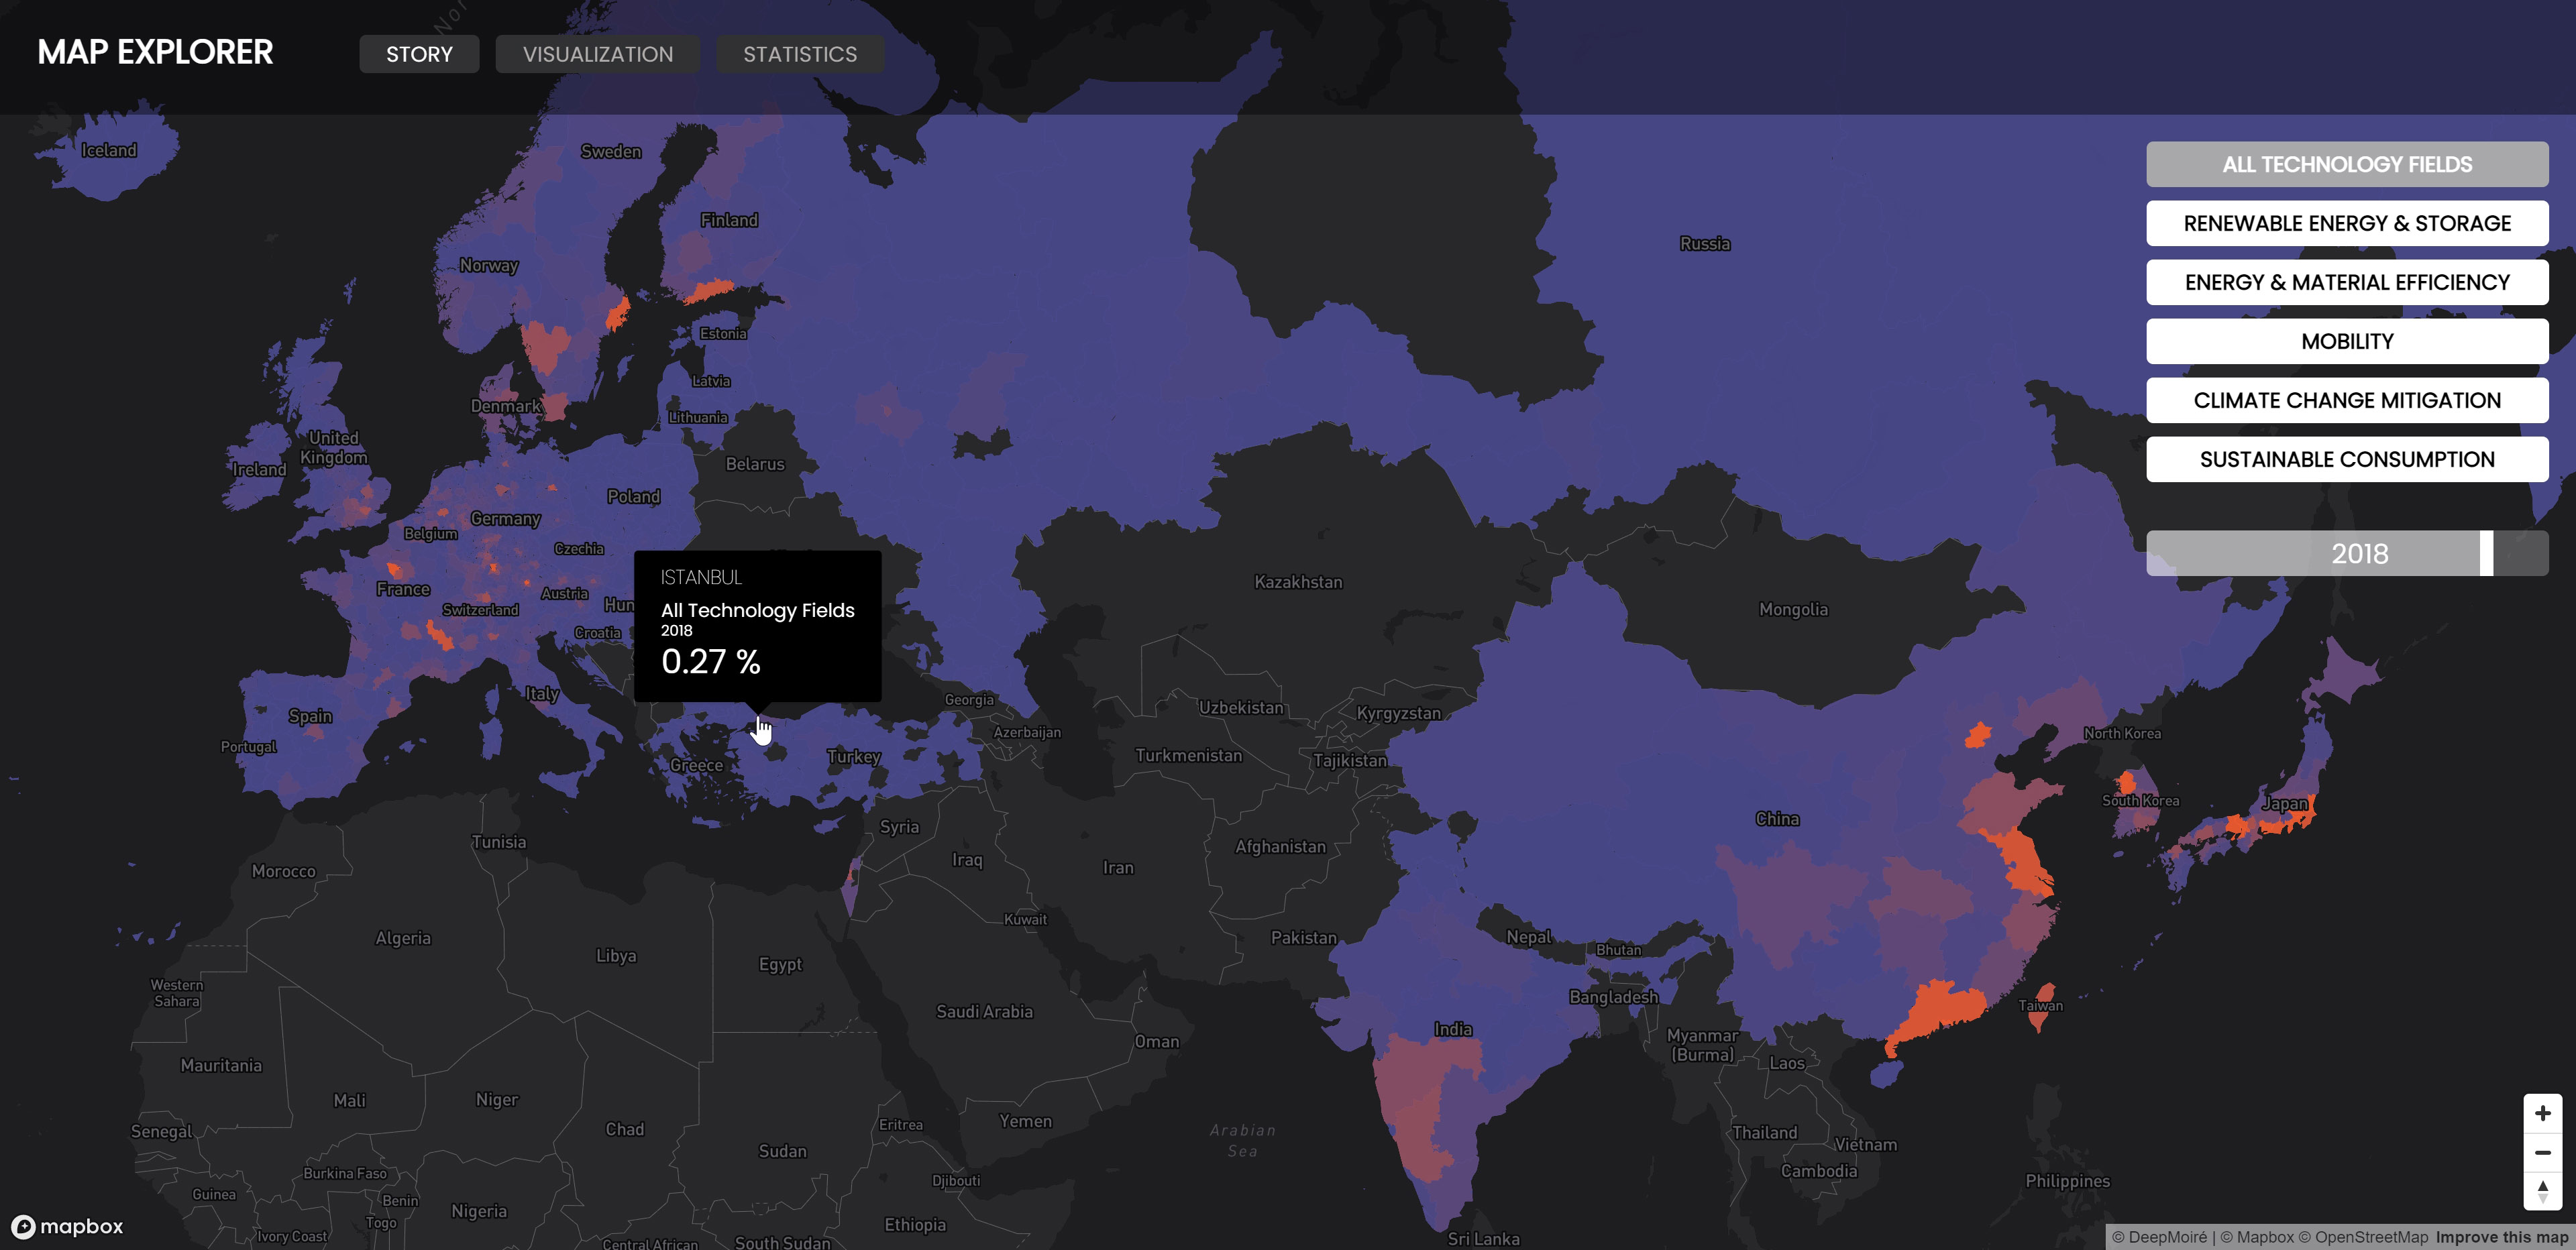
The Visualization section allowed users to explore the data independently. They could switch between technology fields, move through the 2010–2023 timeline, navigate the map, and compare regional activity through dynamically updated visualizations. Both two-dimensional and extruded three-dimensional Mapbox views were developed as part of the system.
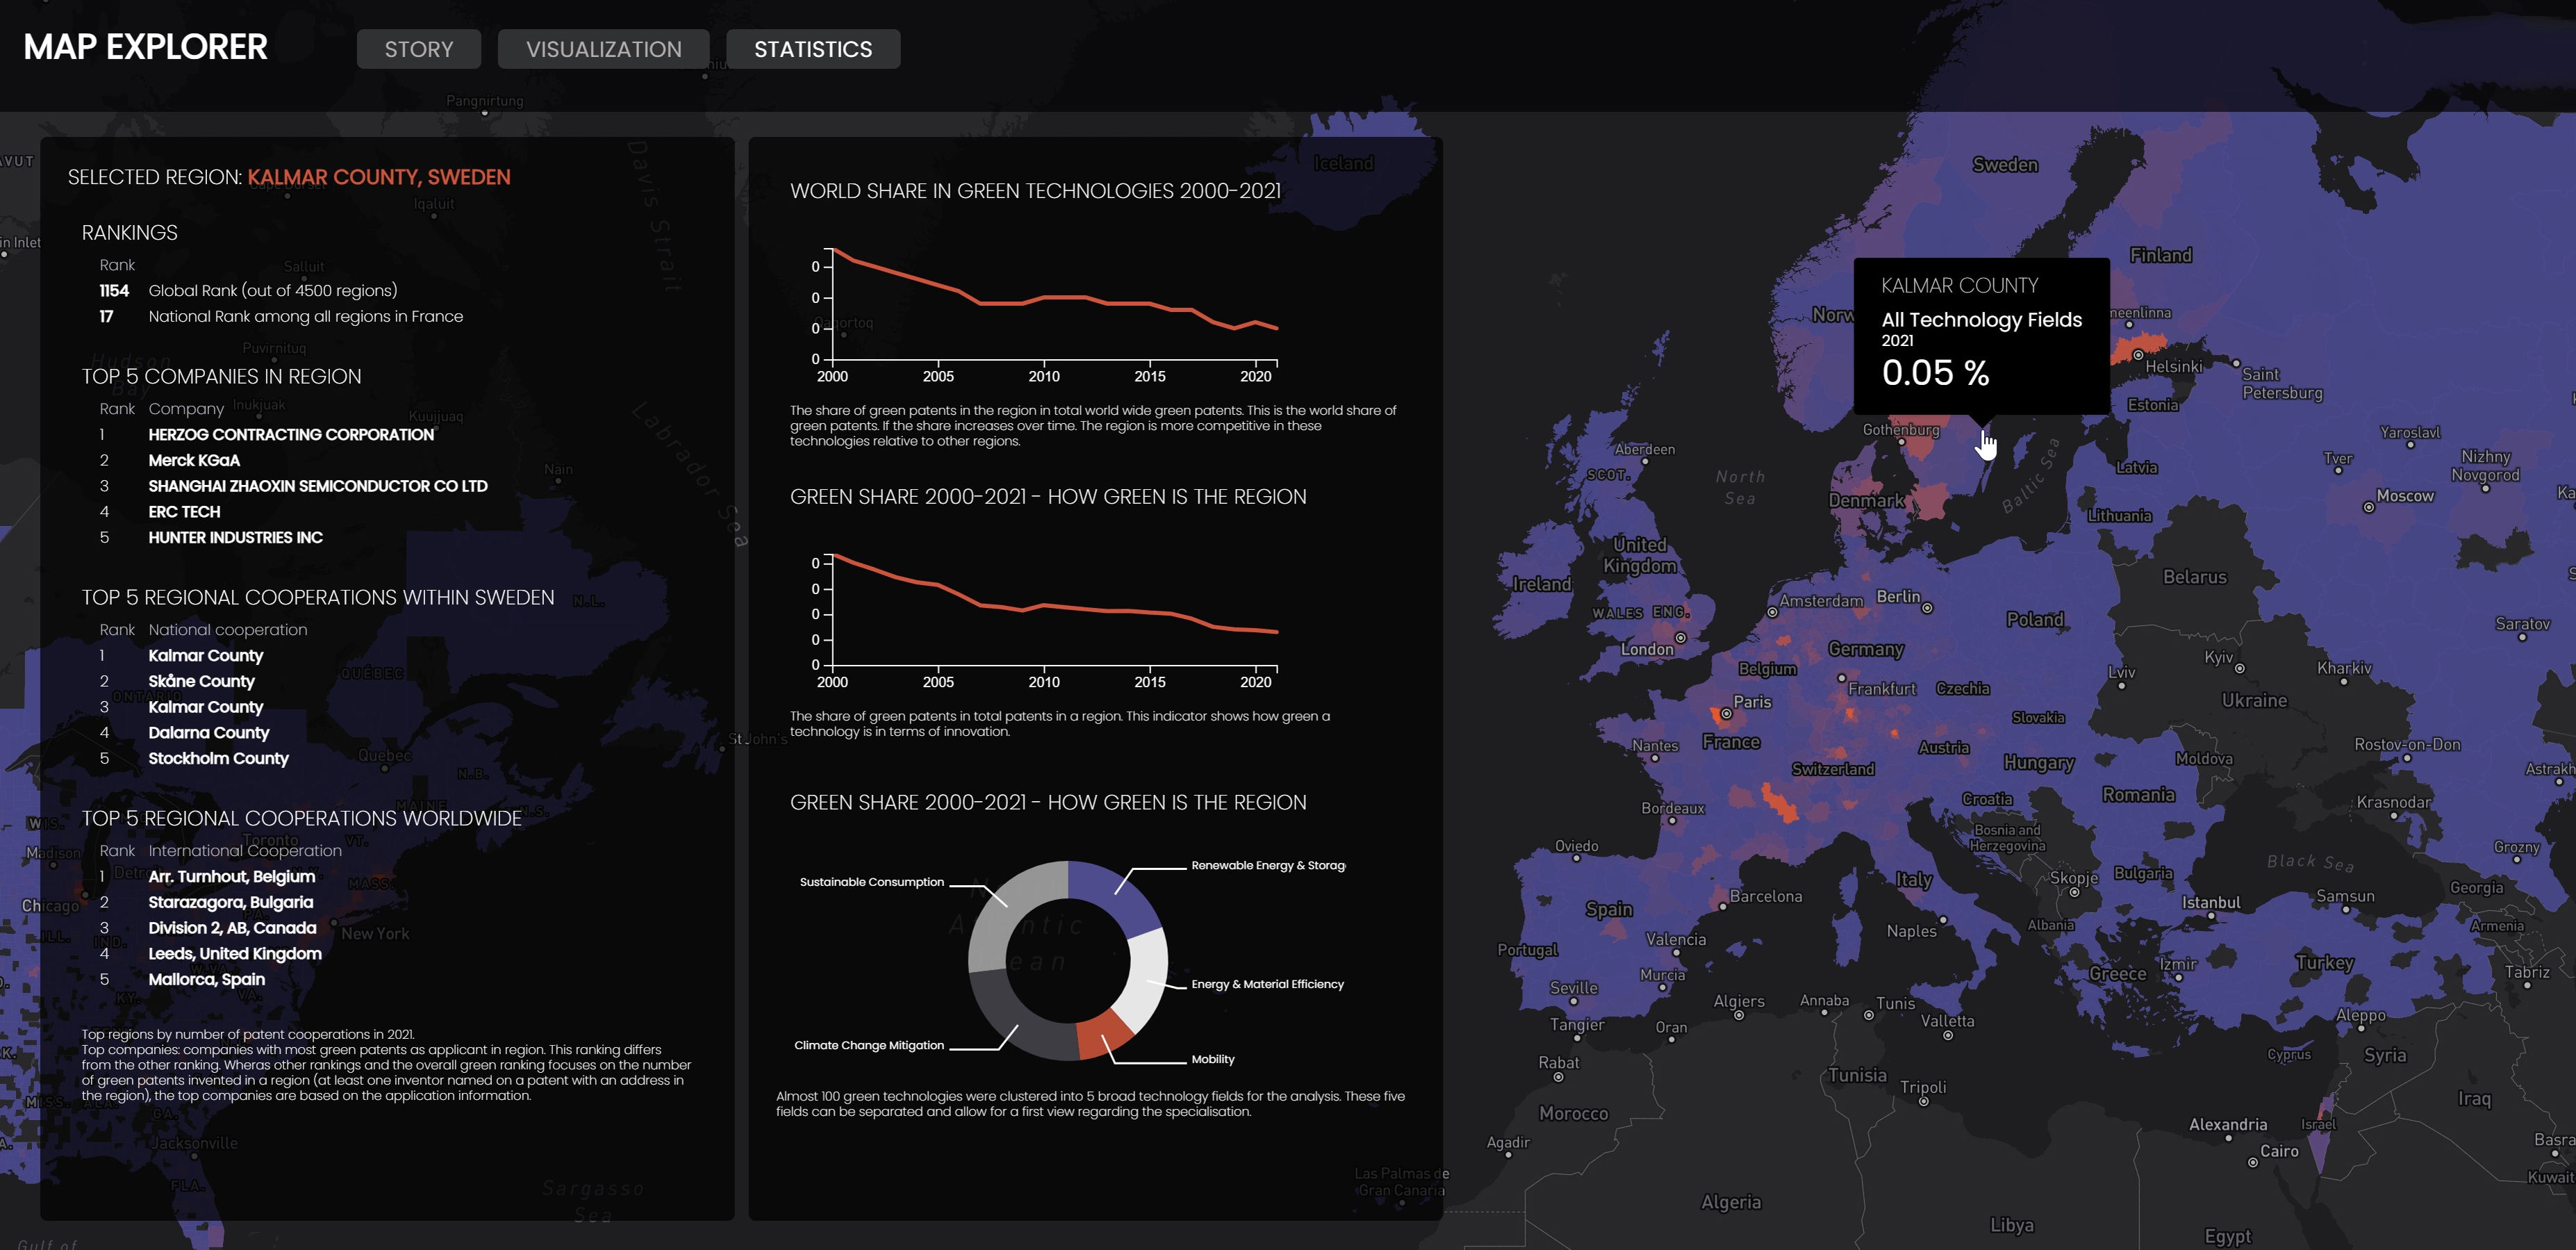
A separate Statistics interface provided detailed information for individual regions. Selecting one of approximately 5,000 regions exposed its global and national ranking, leading companies, national and international collaborations, historical indicators, and the composition of its activity across the ten major green-technology fields.
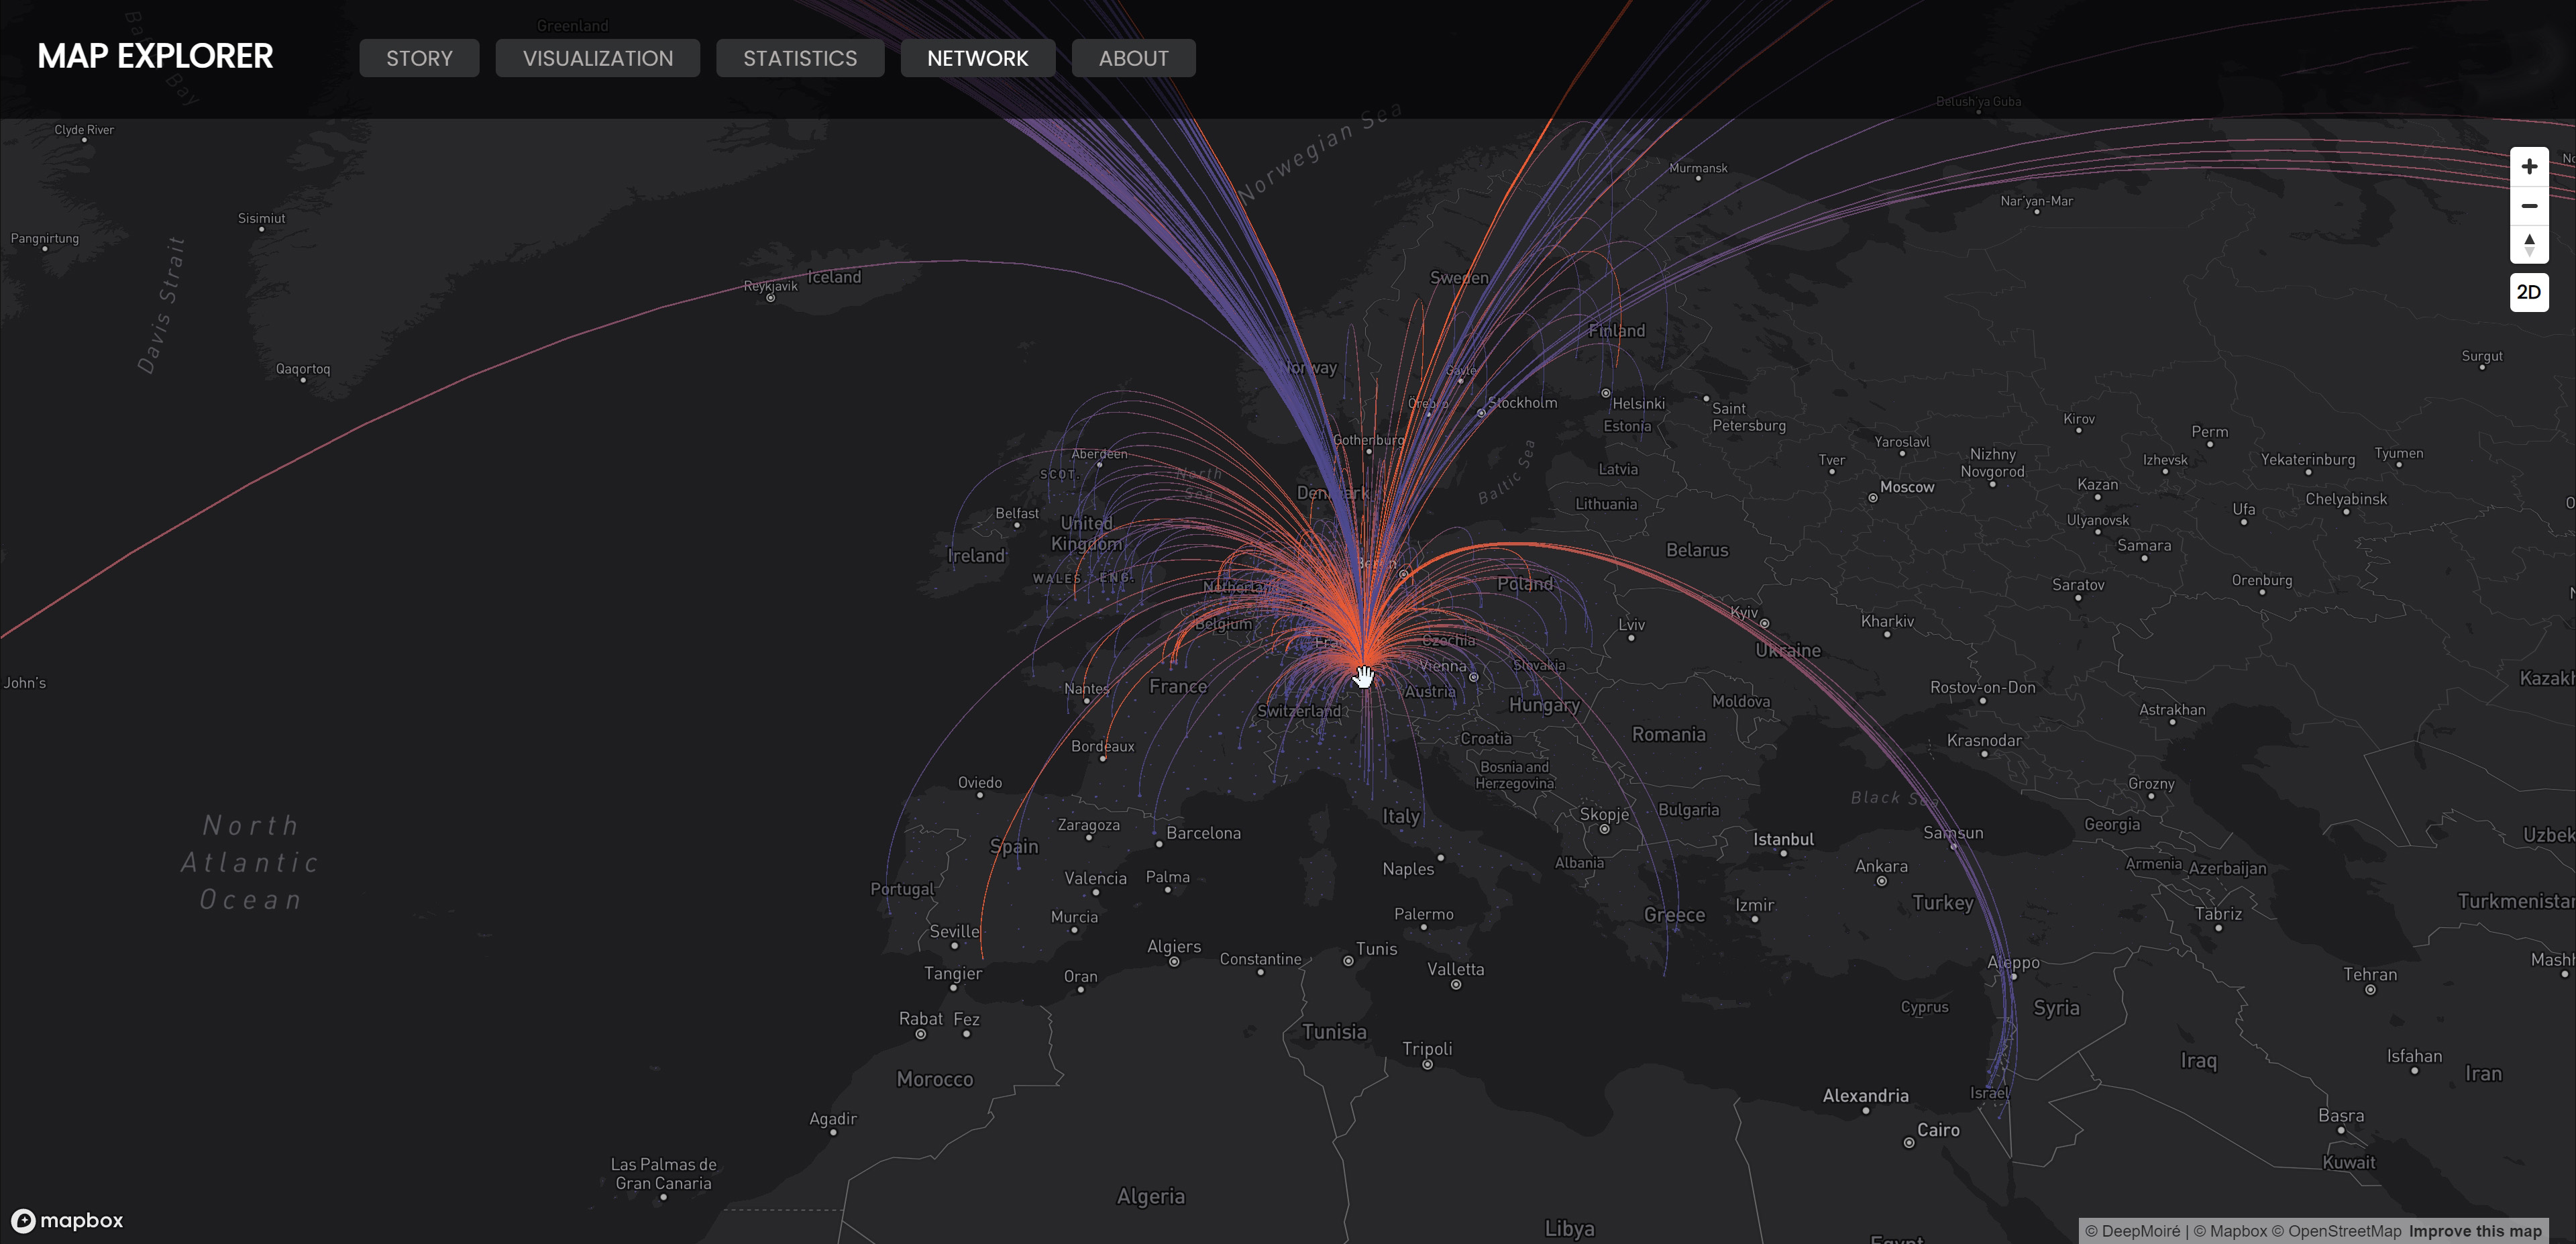
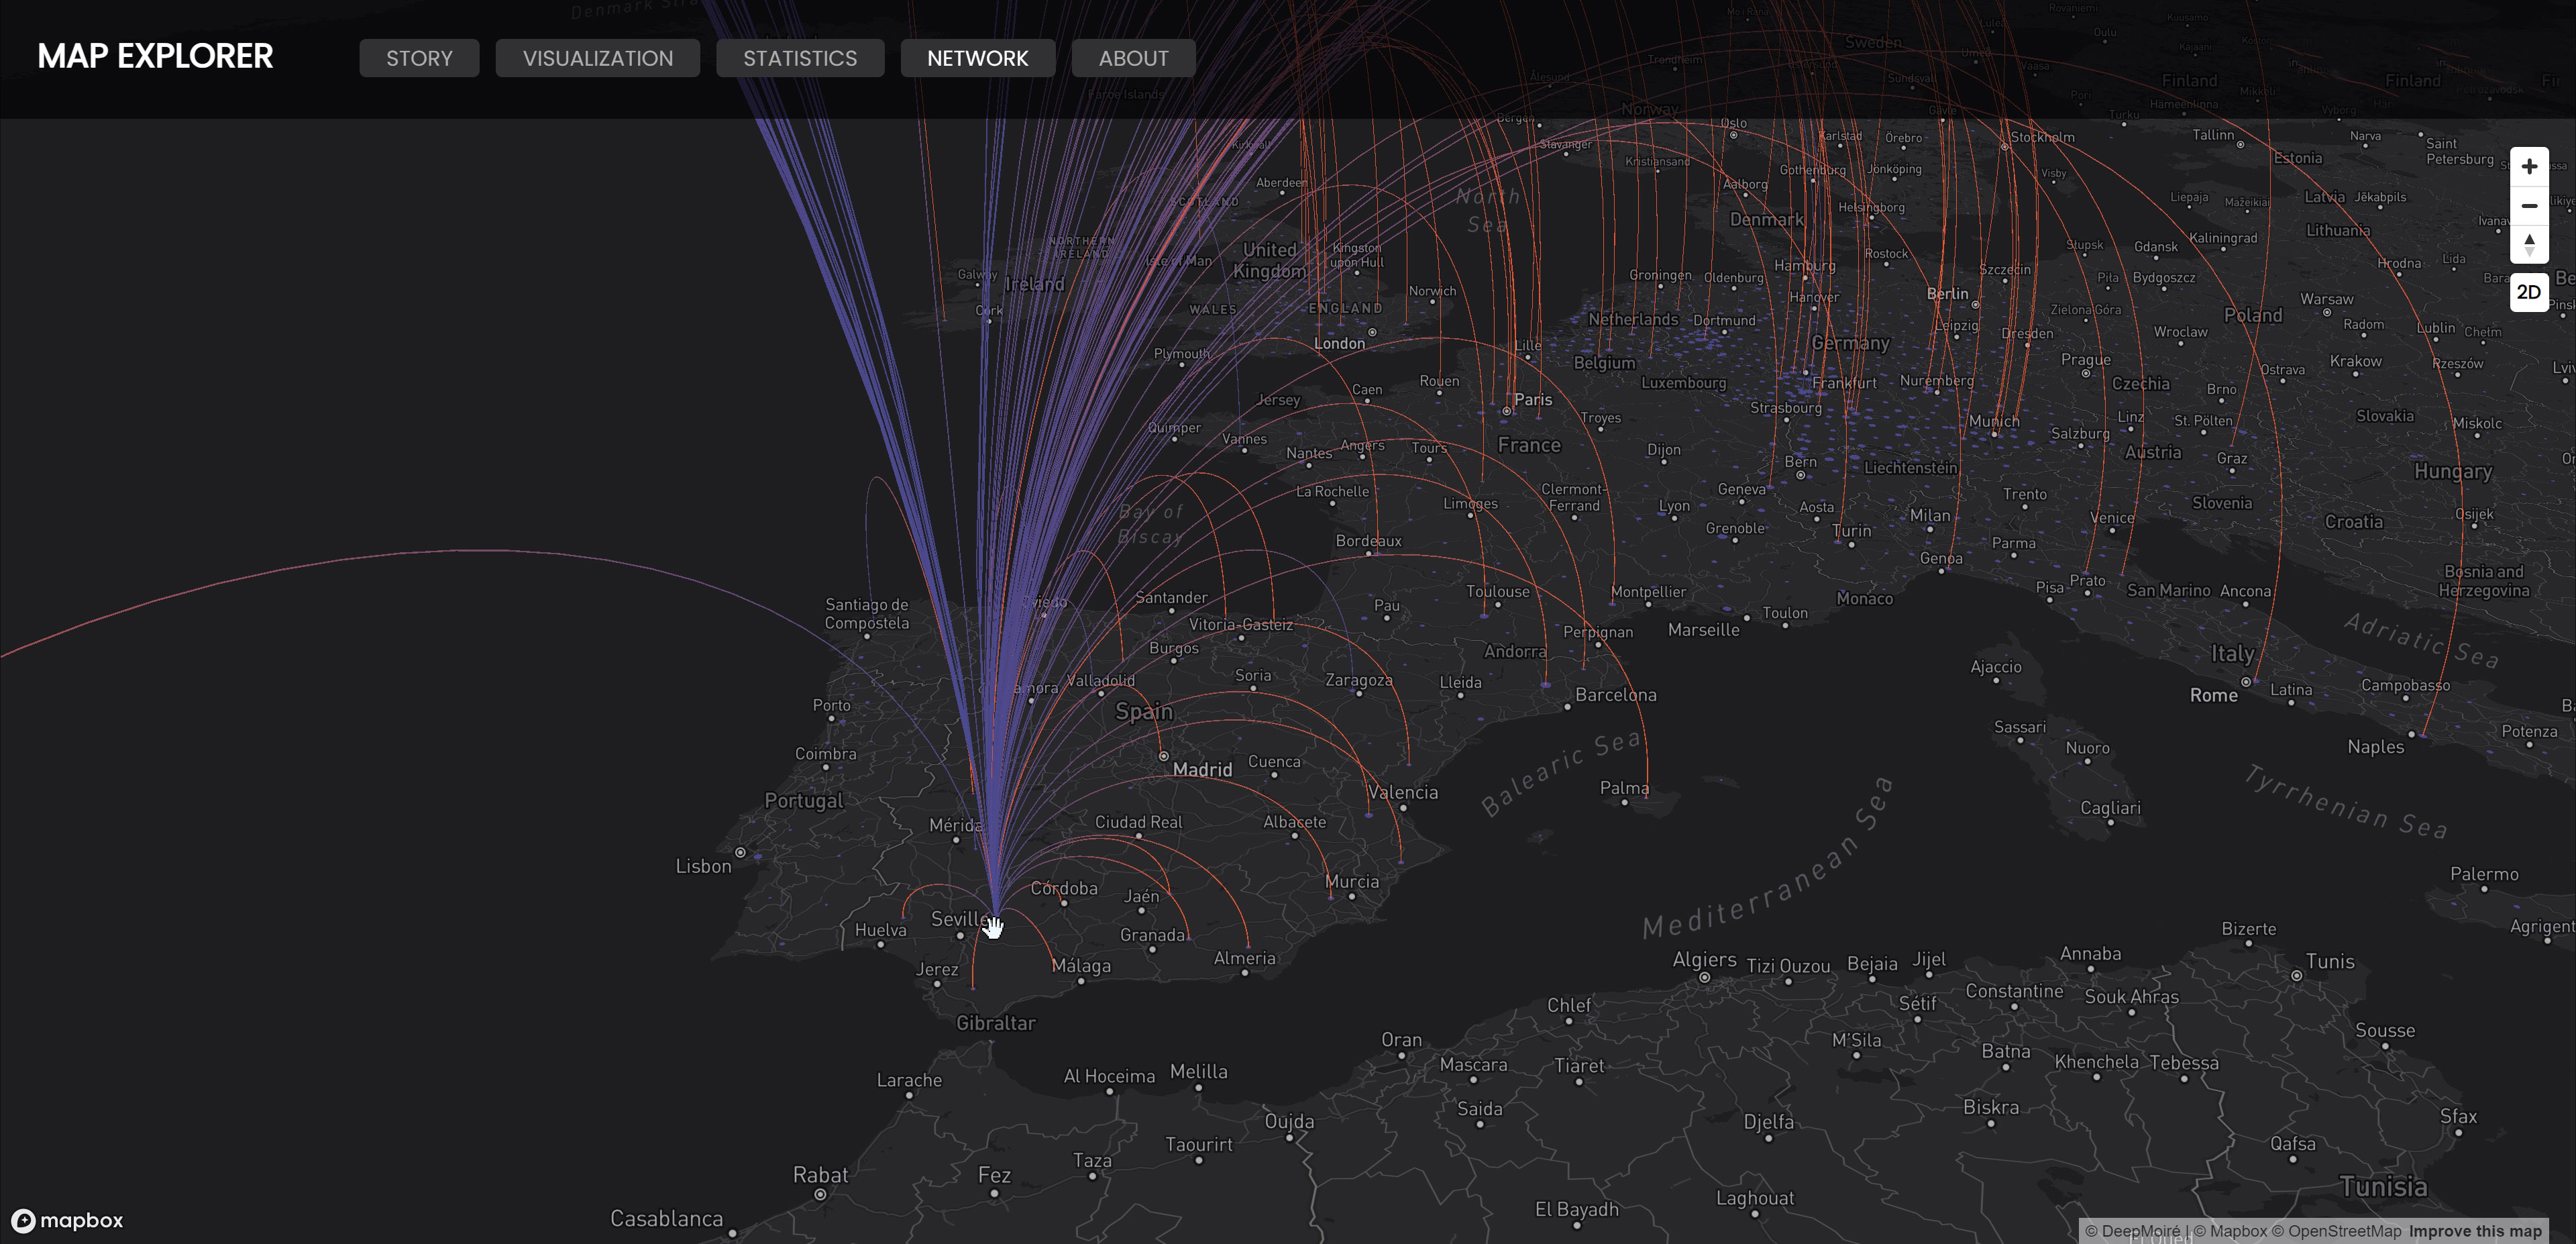
Different visualization approaches were explored during the project, including regional choropleth and extrusion methods, heat-map-style representations, symbols, and geographic network arcs. The network visualization formed part of earlier versions of the application and was later removed as the product and interface evolved.
Design & Data Visualization
A major part of the work was determining how the same dataset should be represented differently depending on what users were trying to understand.
The global and regional maps were designed to reveal spatial patterns without losing the ability to inspect individual regions. Instead of reducing the product to a single thematic map, the application separated guided storytelling, comparative geographic visualization, and detailed statistical analysis into distinct modes.
The region-level analytical interface was particularly important. Users could select one of thousands of regions worldwide and move directly from its geographic position to a structured dashboard containing rankings, time-series charts, technology composition, companies, and collaboration relationships.
The visual language and interaction model were developed iteratively with the client. Multiple cartographic and data-visualization alternatives were proposed and tested before defining the final approach for the different sections of the application.
Technical Approach
The application was developed as a custom JavaScript front end centered on Mapbox GL JS. Regional GeoJSON geometries were connected to the client's tabular data through geographic identifiers and processed in the application so that the relevant attributes could be attached to each region.
Turf.js handled geographic processing within the application, while D3.js generated analytical visualizations including historical line charts and the representation of each region's technology structure. deck.gl was also used during development for the geographic network visualization connecting regions through spatial arcs.
The data structure included regional identifiers, coordinates, national and global rankings, technology-specific values, historical series, technological composition, leading companies, and national and international cooperation relationships.
Technologies
- Mapbox GL JS
- JavaScript
- D3.js
- Turf.js
- deck.gl
- HTML/CSS
- jQuery
- GeoJSON
- API integration
Data Workflow
Because the technology-intelligence dataset was continuously updated, the data workflow became an important part of the application architecture.
The client's original CSV structure was already well developed, but several early iterations were used to align it with the requirements of the interactive visualization. Once the structure had stabilized, the processing logic could consistently organize the incoming values and associate them with the corresponding geographic regions.
The application initially worked with local CSV files and was later connected through an API to a shared online data source. This allowed updates made by the client to propagate into the interactive map without manually rebuilding the visualization.
Outcome
The finished system provided a geographic interface for presenting and exploring a complex technology-intelligence dataset at both global and subnational scales.
Instead of presenting the research only through tables or static outputs, the geospatial dashboard allowed users to identify geographic concentrations of green-technology activity, compare technology fields over time, explore regional rankings, and inspect detailed analytical profiles for individual regions.
The combination of guided storytelling, interactive mapping, and detailed data visualization allowed the same application to communicate broad geographic patterns while preserving access to the underlying regional intelligence.