
Contemporary art discovery / global venue and exhibition platform
Full-Stack Global Arts Map & Data Platform
Overview
I designed and developed a full-stack geospatial web application for discovering contemporary-art venues, exhibitions and related opportunities worldwide. The platform combined an interactive Mapbox interface with more than 2,000 venue records and a continuously refreshed dataset averaging approximately 700–800 current events.
The work covered the complete product architecture: interface and cartographic design, front-end development, backend APIs, database and image storage, Stripe payments, user submissions, administrative review, deployment infrastructure and the automated data pipelines used to maintain the platform.
Challenge
The platform had to manage two fundamentally different types of geographic content. Venue information formed a relatively stable global directory, while exhibition data changed constantly as new events opened and older listings expired.
Event information came from eight specialist sources with different page structures, APIs, naming conventions, date formats, address formats and levels of completeness. The records had to be normalized, compared across sources, geocoded, checked for duplicates and separated into current and historical datasets before they could be used by the application.
The platform also required a complete commercial and editorial workflow. Users needed to create a listing, identify its location, upload an image, preview the result, complete a verified payment and submit the content to the database. New entries could then receive a manual curatorial review within 24 hours.
Solution
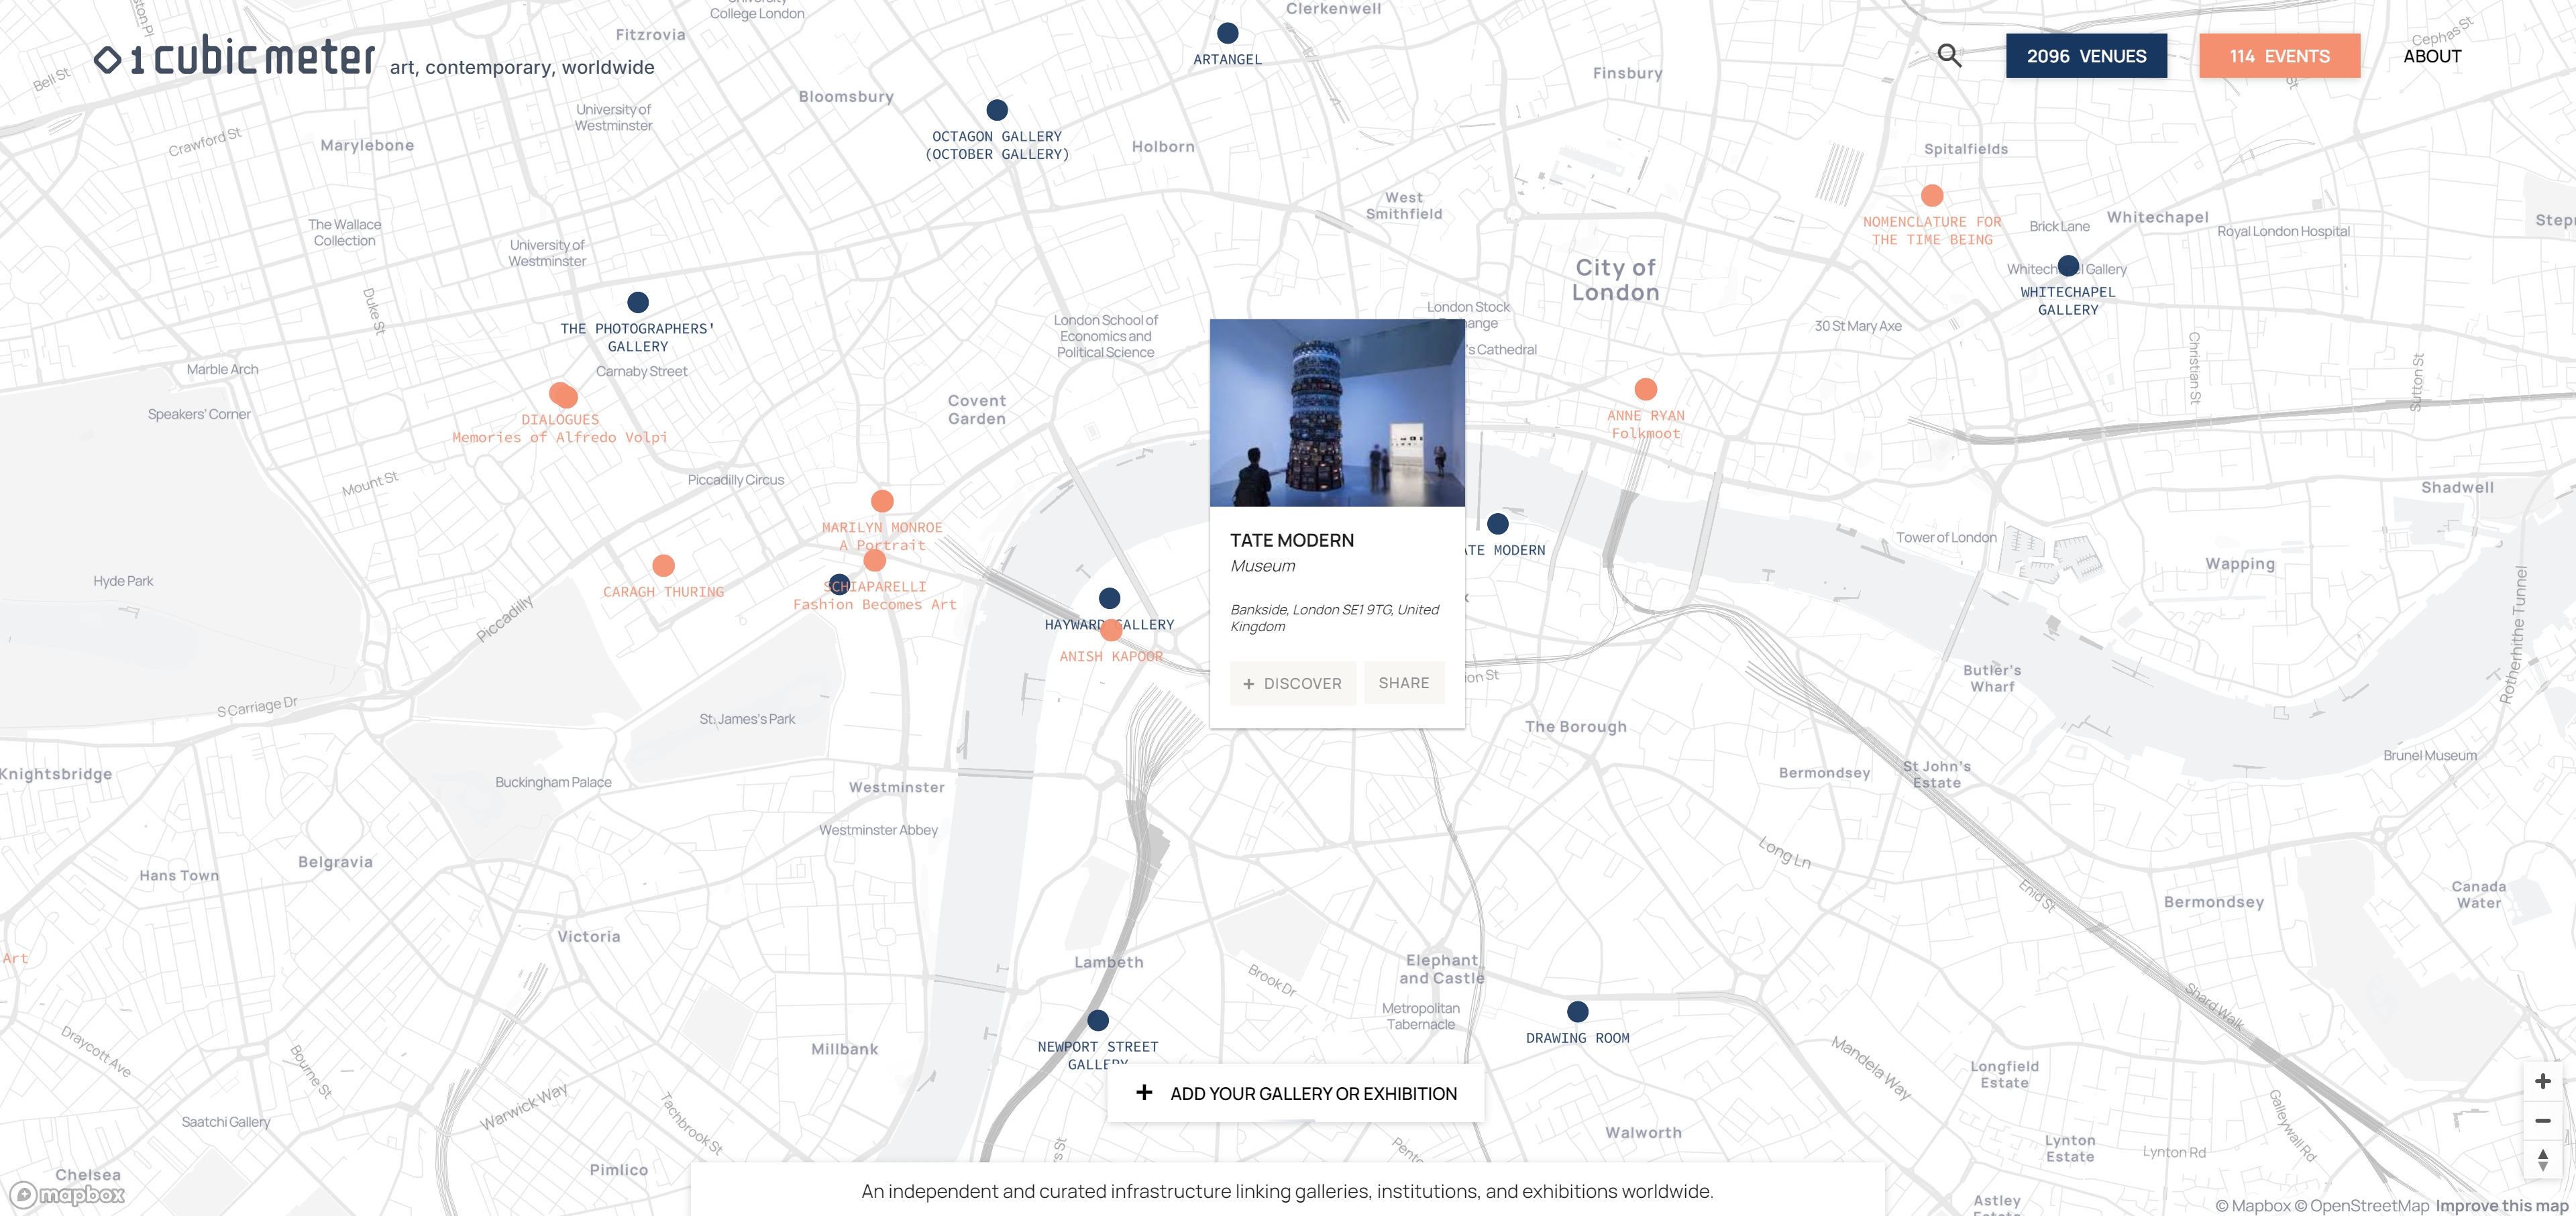
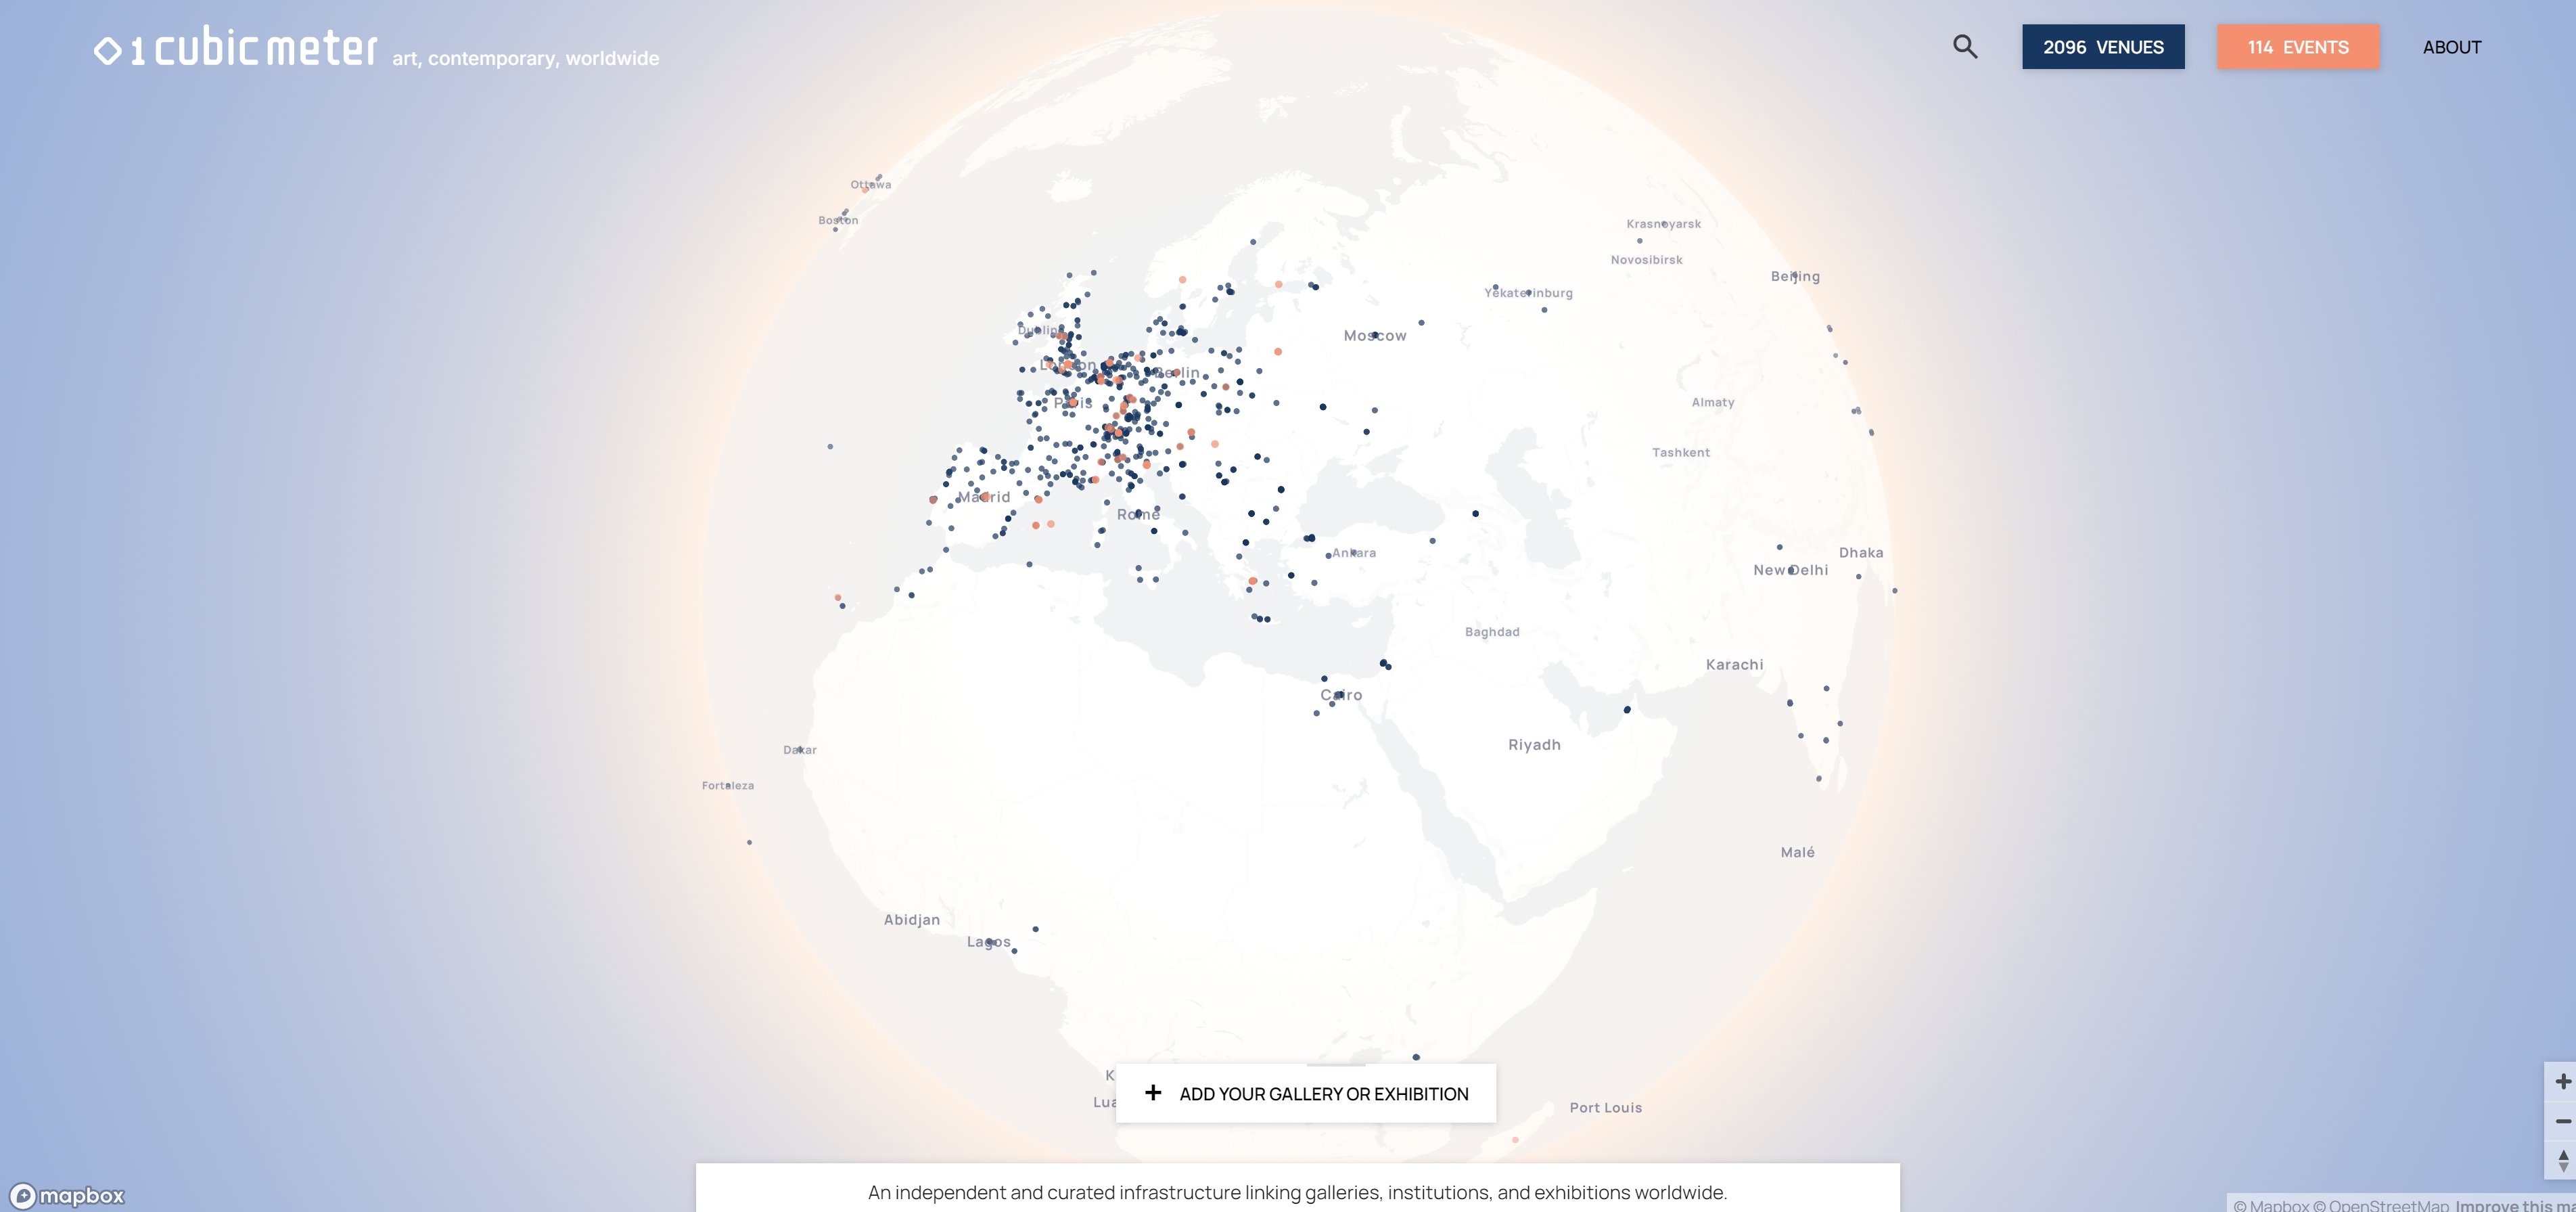
The finished platform uses an interactive global map as its main navigation and discovery interface. Users can move from a globe-scale overview to individual cities, search geographically, filter venues by typology, filter events by period, control different content layers and inspect individual records through custom map popups.
Venue, event and residency records use separate visual treatments and interaction logic. The application removes expired events from the active map, handles multiple listings at the same location, updates visible totals as filters change and supports shareable links that reopen the map at a specific record.
I also developed the complete paid-submission interface. Users can select a listing type, complete the relevant fields, locate it through address search or manual pin placement, upload and validate a cover image and preview the entry directly on the map before proceeding to Stripe Checkout.
Design & Data Visualization
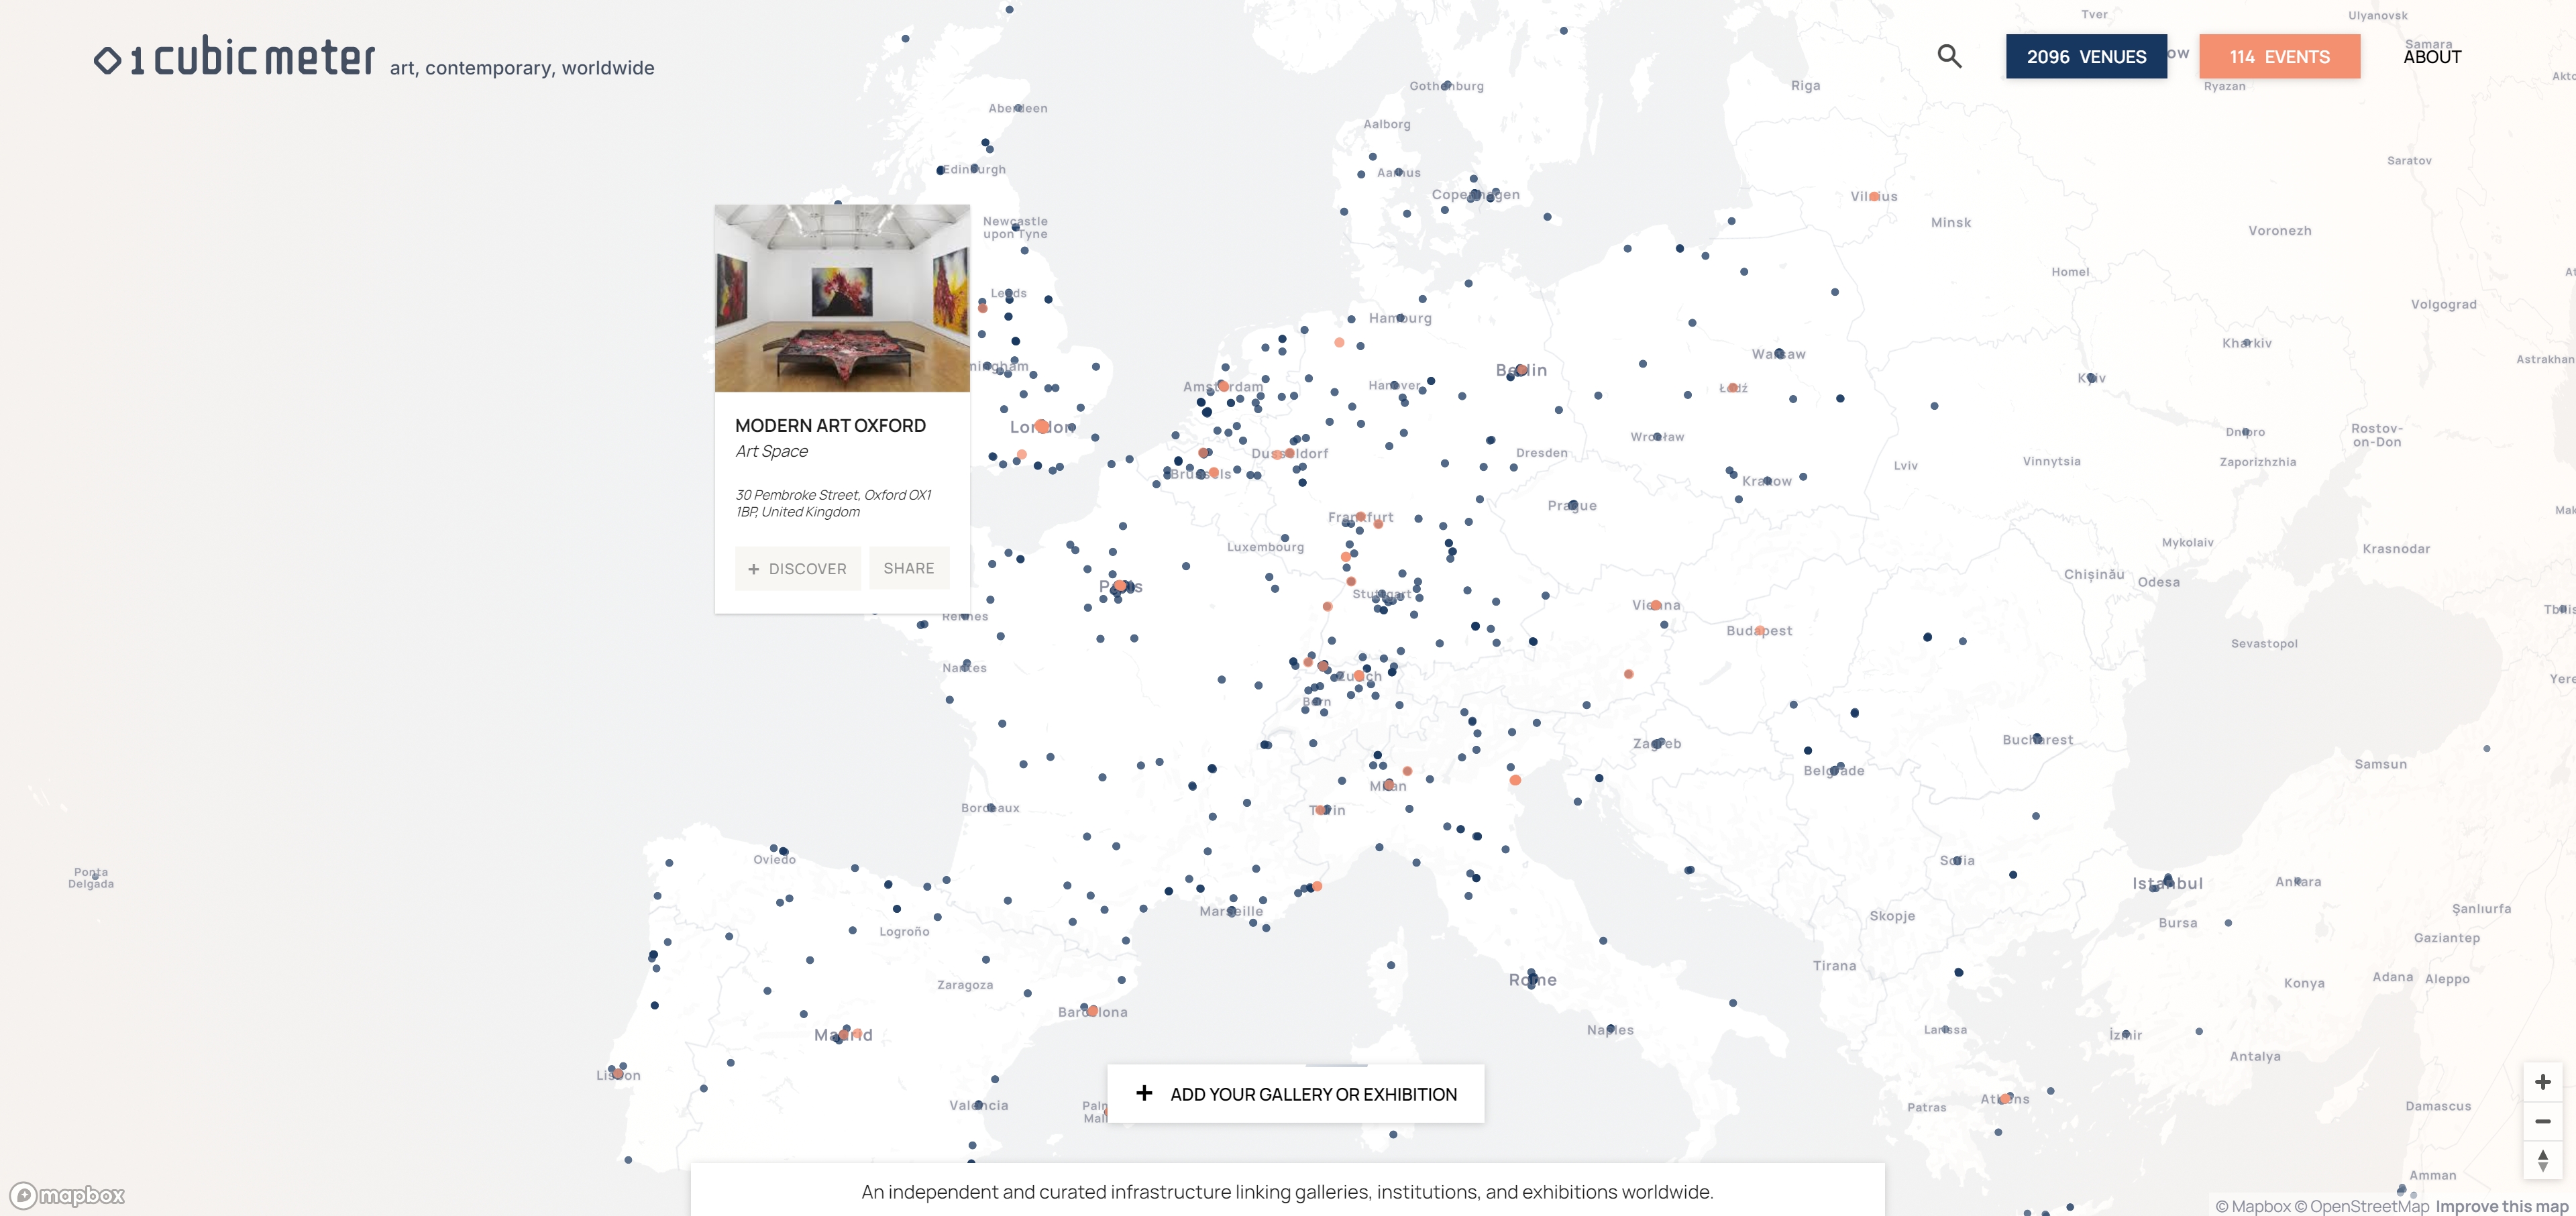
The visual system was designed to make hundreds of active events and more than 2,000 venues readable at both global and local scales. A globe-based opening view communicates the international extent of the dataset, while closer zoom levels progressively introduce individual records and labels.
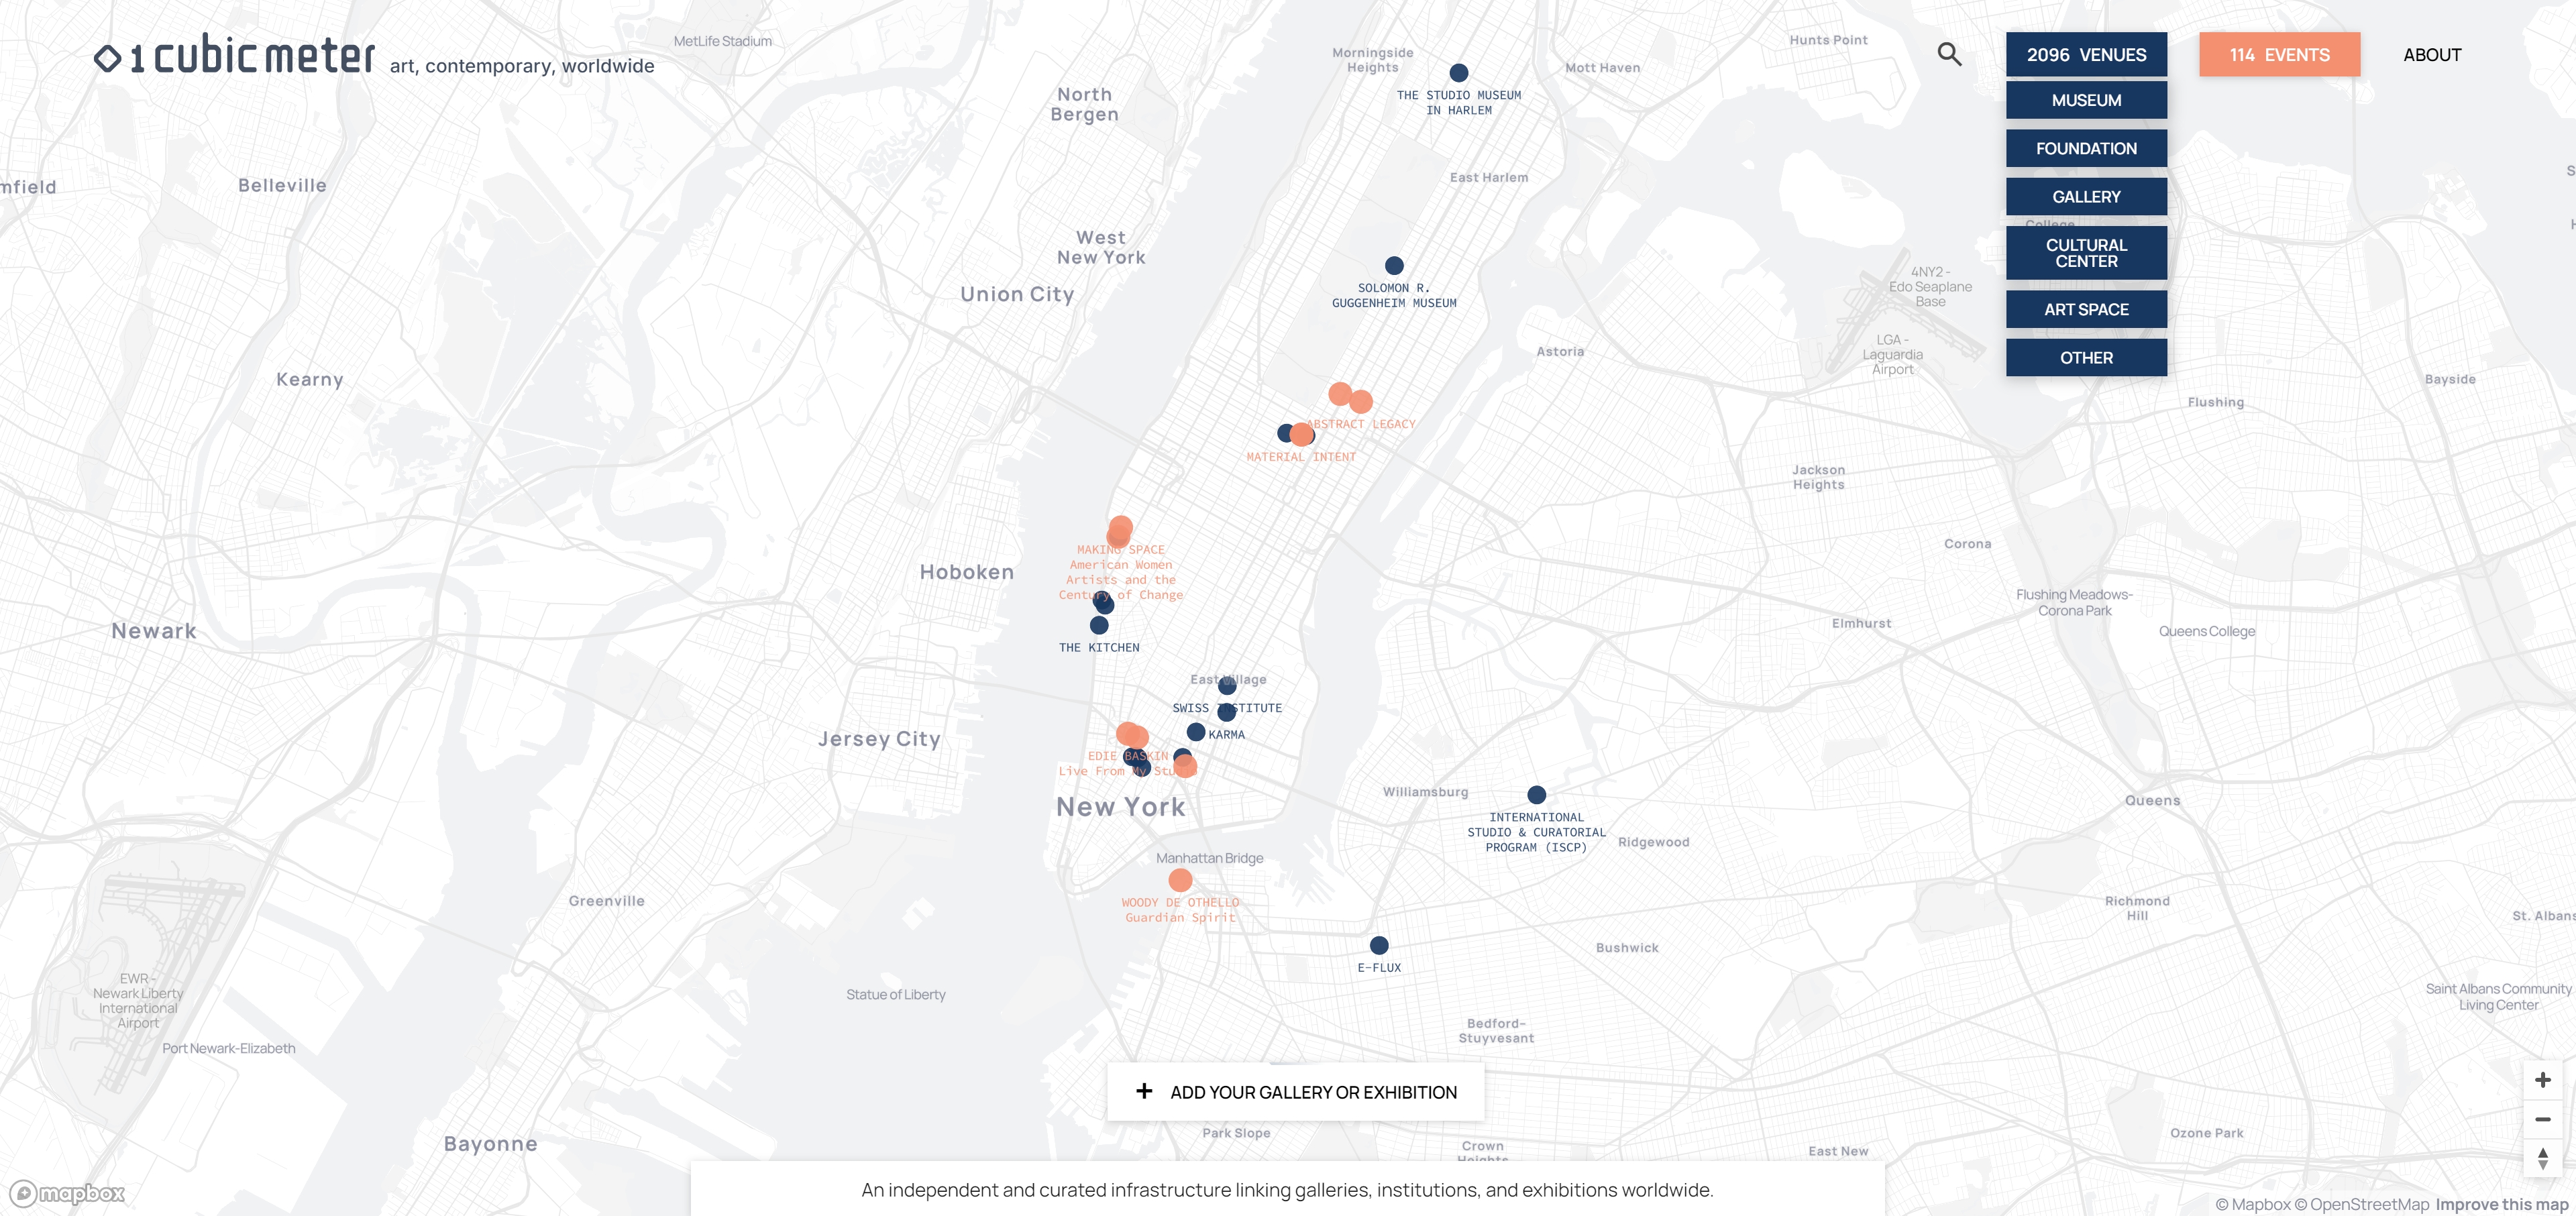
Venues, events and residencies use distinct colors and symbols. Venue filters separate institution types, while temporal filters allow events to be explored according to their active period. Custom popups organize images, descriptions, addresses, external links, directions and sharing actions without removing the user from the geographic context.
The interface was also adapted for mobile use, including responsive map controls, panels, popup positioning, search, manual coordinate placement and the complete submission and payment workflow.
Technical Approach
The custom JavaScript front end was developed around Mapbox GL JS, while a Cloudflare Worker provides the API layer between the public application, administrative interface, payment system and persistent data. Cloudflare Pages supports deployment of the front end.
The editorial datasets were divided into full and minimal versions. Minimal records contain only the identifiers, coordinates and attributes required to render the global map efficiently. When a user opens a popup, the application requests the corresponding full record through the API using a stable identifier, avoiding the need to send every descriptive field and image reference in the initial payload.
User-submitted textual data is stored in Cloud Firestore and uploaded images are managed through Firebase Storage. Public endpoints merge eligible submissions with the main editorial datasets, while authenticated administrative endpoints expose records and publication controls through a dedicated map-based review interface. Stripe Checkout sessions and payment verification are handled through the backend before submissions enter the publication and curatorial-review workflow.
Technologies
- Mapbox GL JS
- JavaScript
- HTML/CSS
- Cloudflare Pages
- Cloudflare Workers
- REST APIs
- Cloud Firestore
- Firebase Storage
- Stripe Checkout
- Python
- Google Geocoding API
- Mapbox Geocoder
- Requests
- Beautiful Soup
- CSV
- JSON
Data Workflow
I developed a unified Python scraping and data-processing pipeline that collects exhibitions from eight specialist arts sources twice per week and maintains approximately 700–800 current event records on average. Each source has dedicated extraction logic for its HTML pages, structured payloads or APIs, but all resulting records are converted into a shared schema.
The workflow standardizes inconsistent and multilingual date formats, derives explicit start and end dates and applies exact and fuzzy duplicate detection across artist, title and venue fields. Missing coordinates are generated through the Google Geocoding API with request caching, while expired records are moved into a historical dataset. Each run produces a report describing the records collected, rejected, deduplicated, geocoded, retained and archived.
Additional scripts handle venue and residency geocoding, image preparation, stable record identifiers, full and minimal dataset generation, CSV-to-JSON synchronization and the automatic selection of current venues and events for dedicated geographic pages.
Outcome
The completed system functions as both a global geographic directory and a maintainable digital publishing platform. Users can discover venues and current exhibitions, search and filter the dataset, navigate directly to individual records and submit paid listings through the same interface.
For the client, the platform connects data acquisition, geographic processing, database management, payments, publication and editorial moderation within one infrastructure. The automated event pipeline keeps a highly time-sensitive dataset current without requiring hundreds of listings to be researched, standardized, geocoded and removed manually during every update.