
Social connectivity research / interactive conference exhibit
Interactive Facebook Social Connectedness Map
Overview
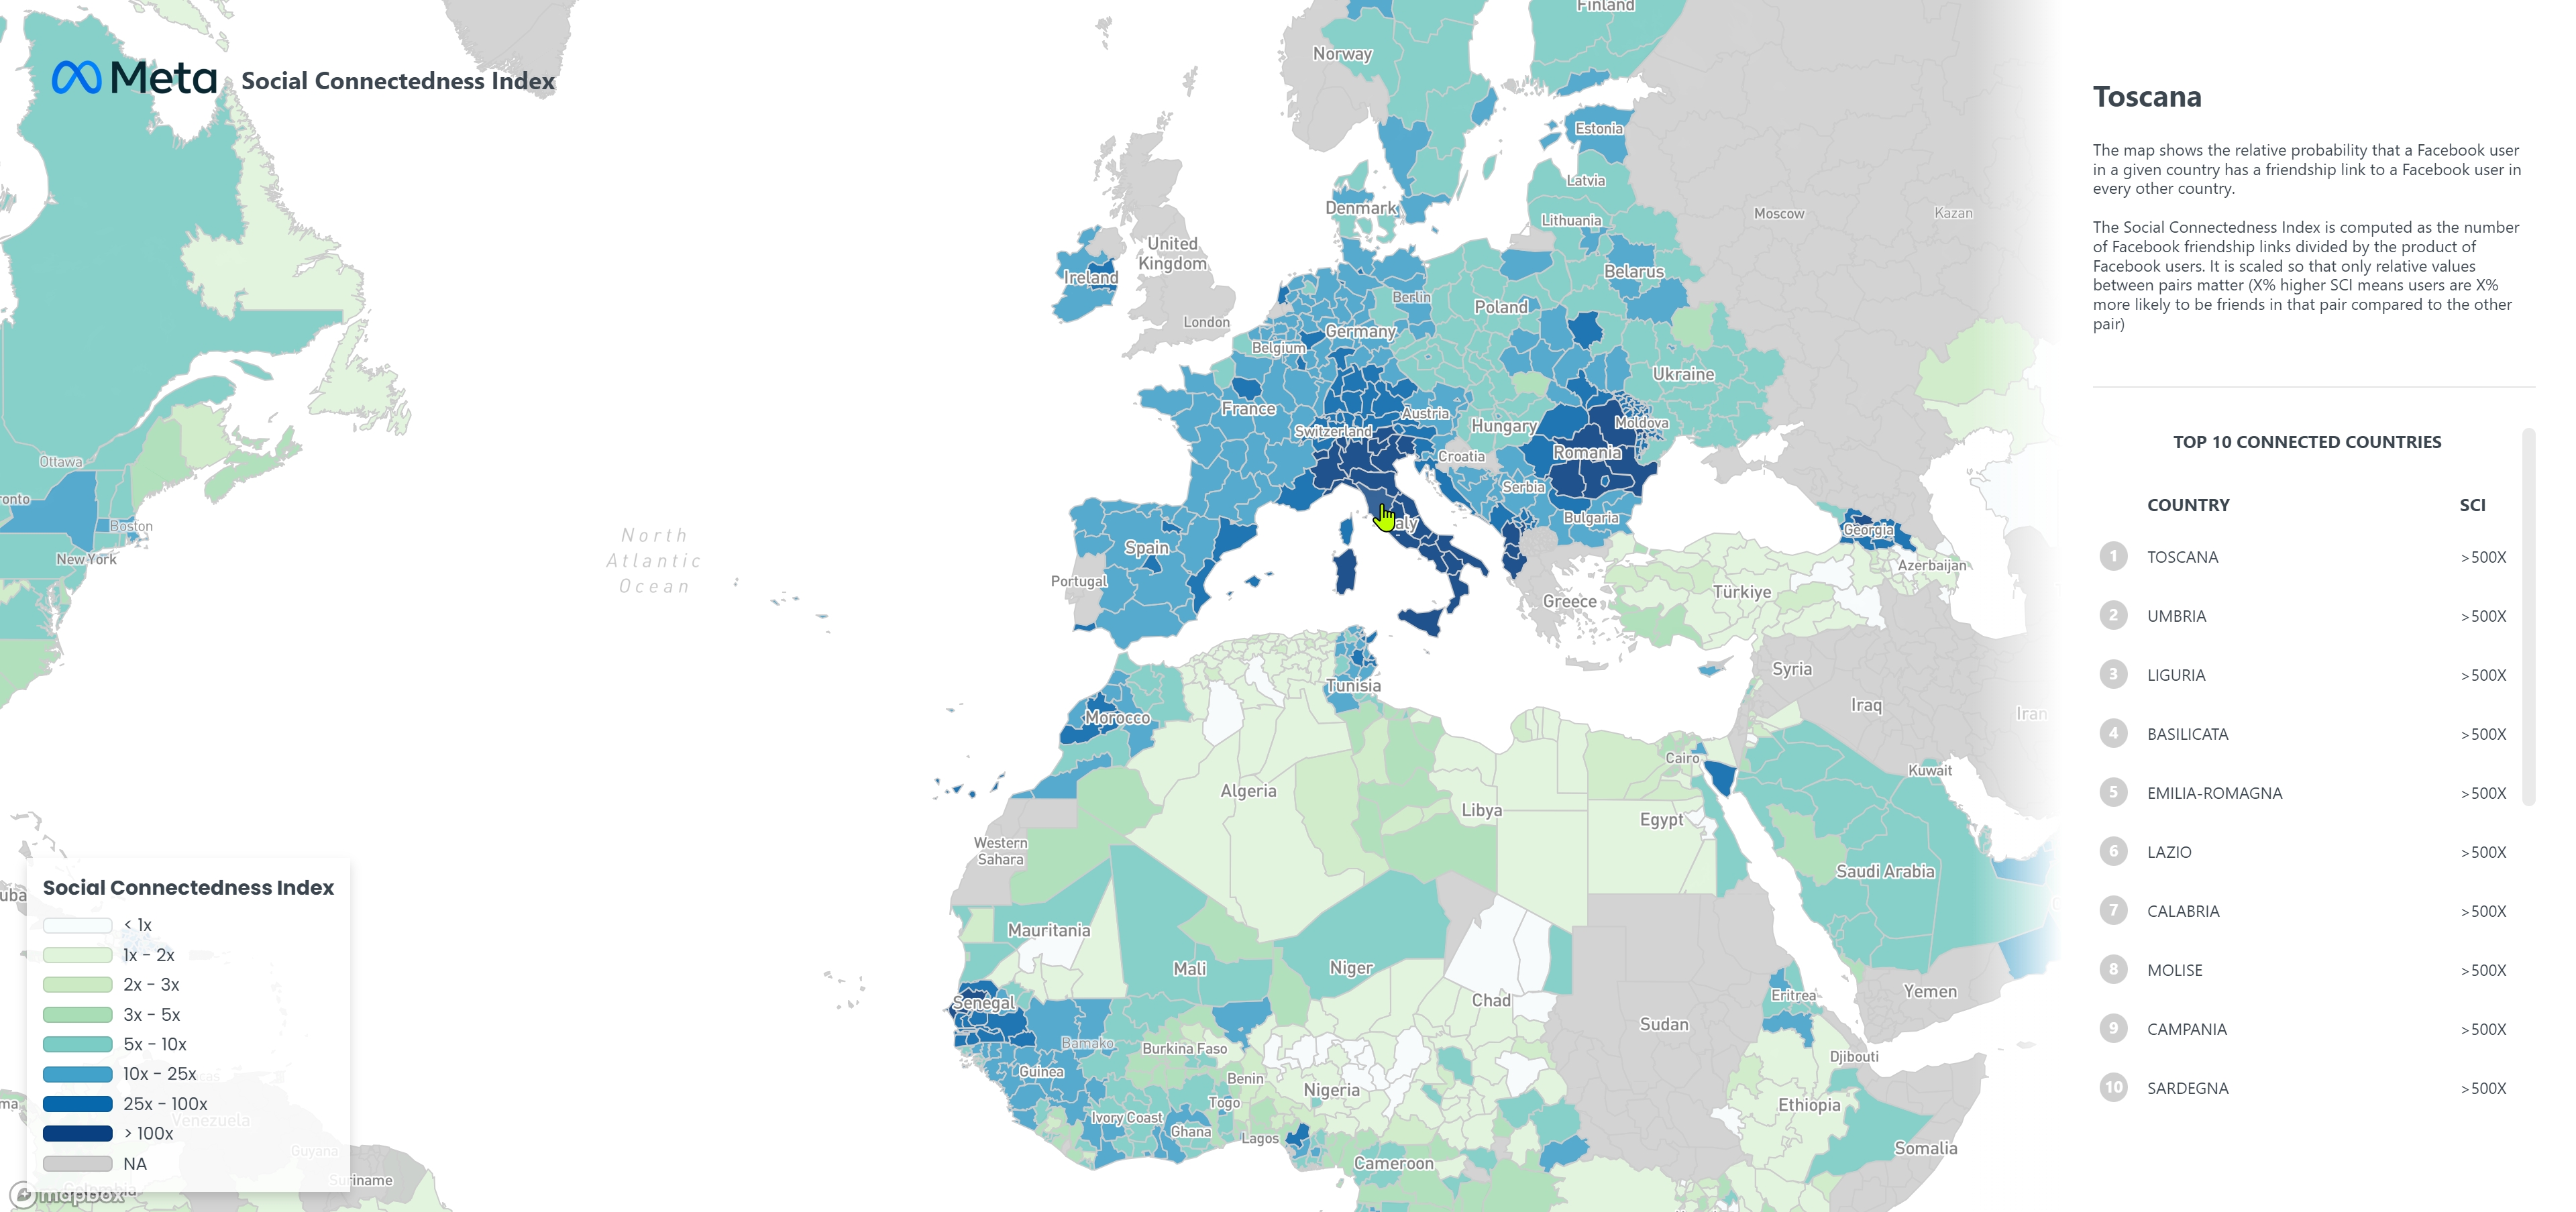
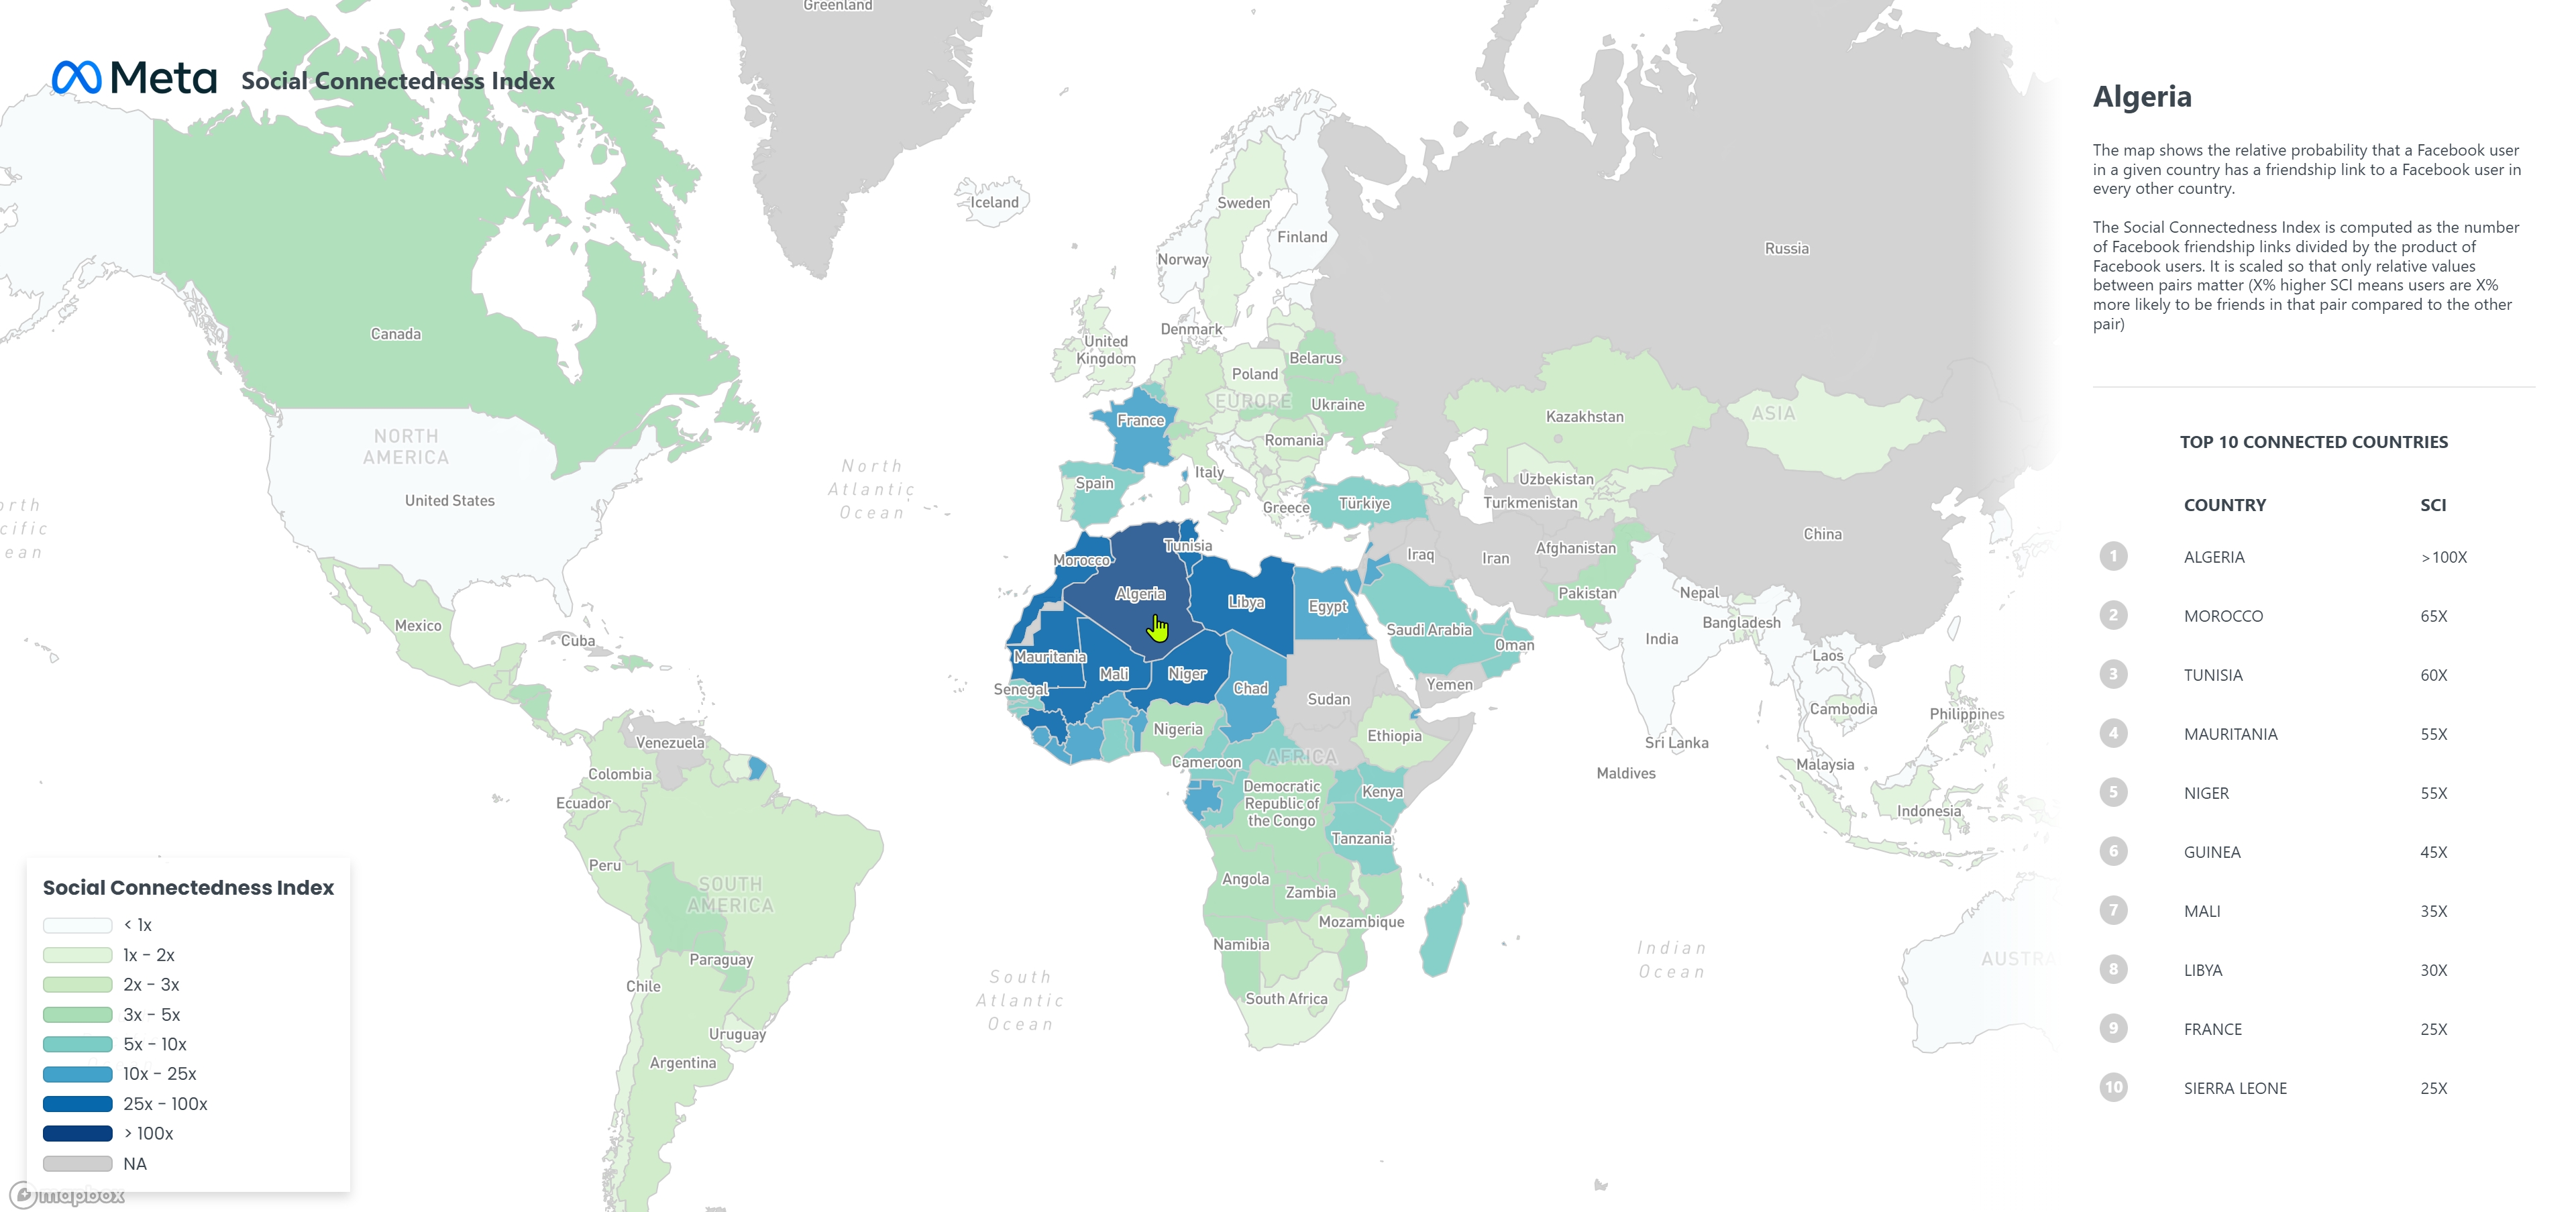
This project was an interactive data visualization developed for a large touchscreen exhibit using the Facebook Social Connectedness Index. Visitors could select a location directly on a world map and see how strongly it was socially connected with other geographic areas through a dynamically recolored map, a relative-value legend, and a ranked panel of the strongest connections.
I developed the interface, cartographic design, visualization logic, geographic data preparation, and application code. The project evolved through several prototypes covering different geographic resolutions before being simplified into the country-level version ultimately used at the event.
Challenge
The Social Connectedness Index is fundamentally a pairwise dataset: a geography does not have one fixed value, but a different relationship value with every other geography. Selecting a new location therefore requires recalculating the information displayed across the entire map.
Development initially explored several geographic scales, including country-level data as well as regional and more granular subdivisions combining GADM and European NUTS geographies. Working across these levels introduced substantial data-processing challenges, including inconsistent administrative identifiers, differences between geographic datasets, missing matches, mixed levels of geographic detail, and very large SCI source files.
The interface also had a specific physical context. It was intended for a large interactive touchscreen at a conference exhibit, where visitors would walk up to the visualization and touch geographic areas directly. The experience therefore needed to remain visually clear and immediately understandable without relying on a conventional desktop workflow.
Solution
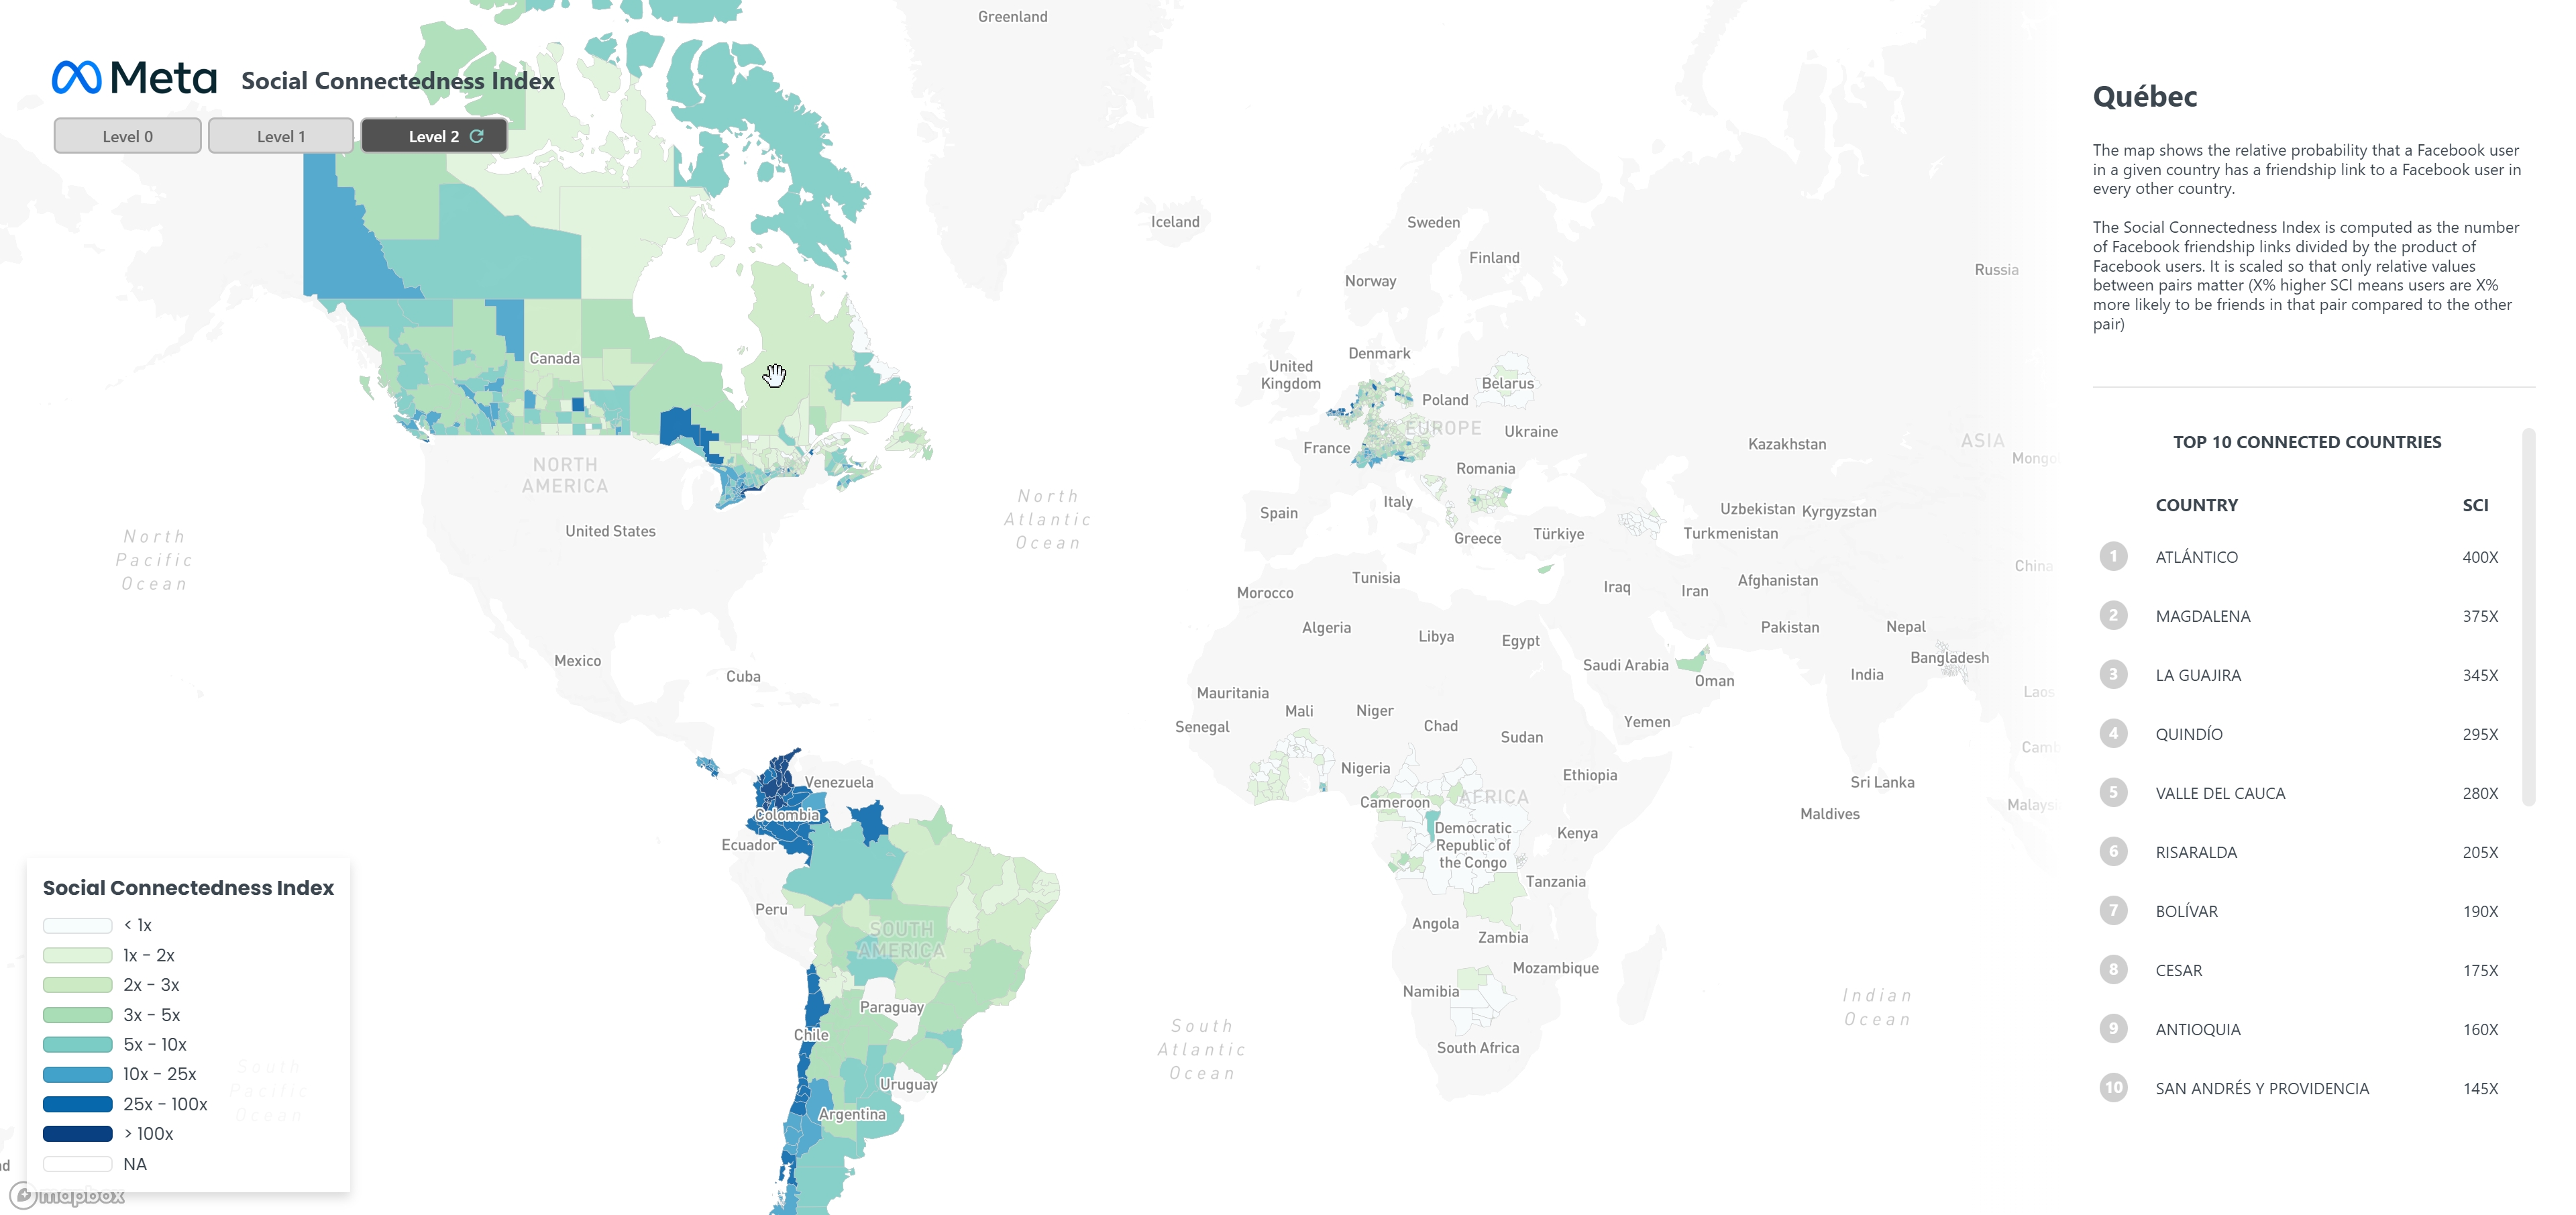
The application was built around an interactive Mapbox world map. Selecting a geography retrieves its SCI relationship with all available comparison areas and immediately updates both the geographic visualization and the accompanying ranking.
Instead of emphasizing raw SCI values, the application translates relationships into relative multipliers. A selected geography generates a new reference distribution and the map classifies connections from below 1× the reference level through progressively stronger categories up to more than 100×. A ranked information panel provides a second, complementary way of reading the strongest geographic relationships.
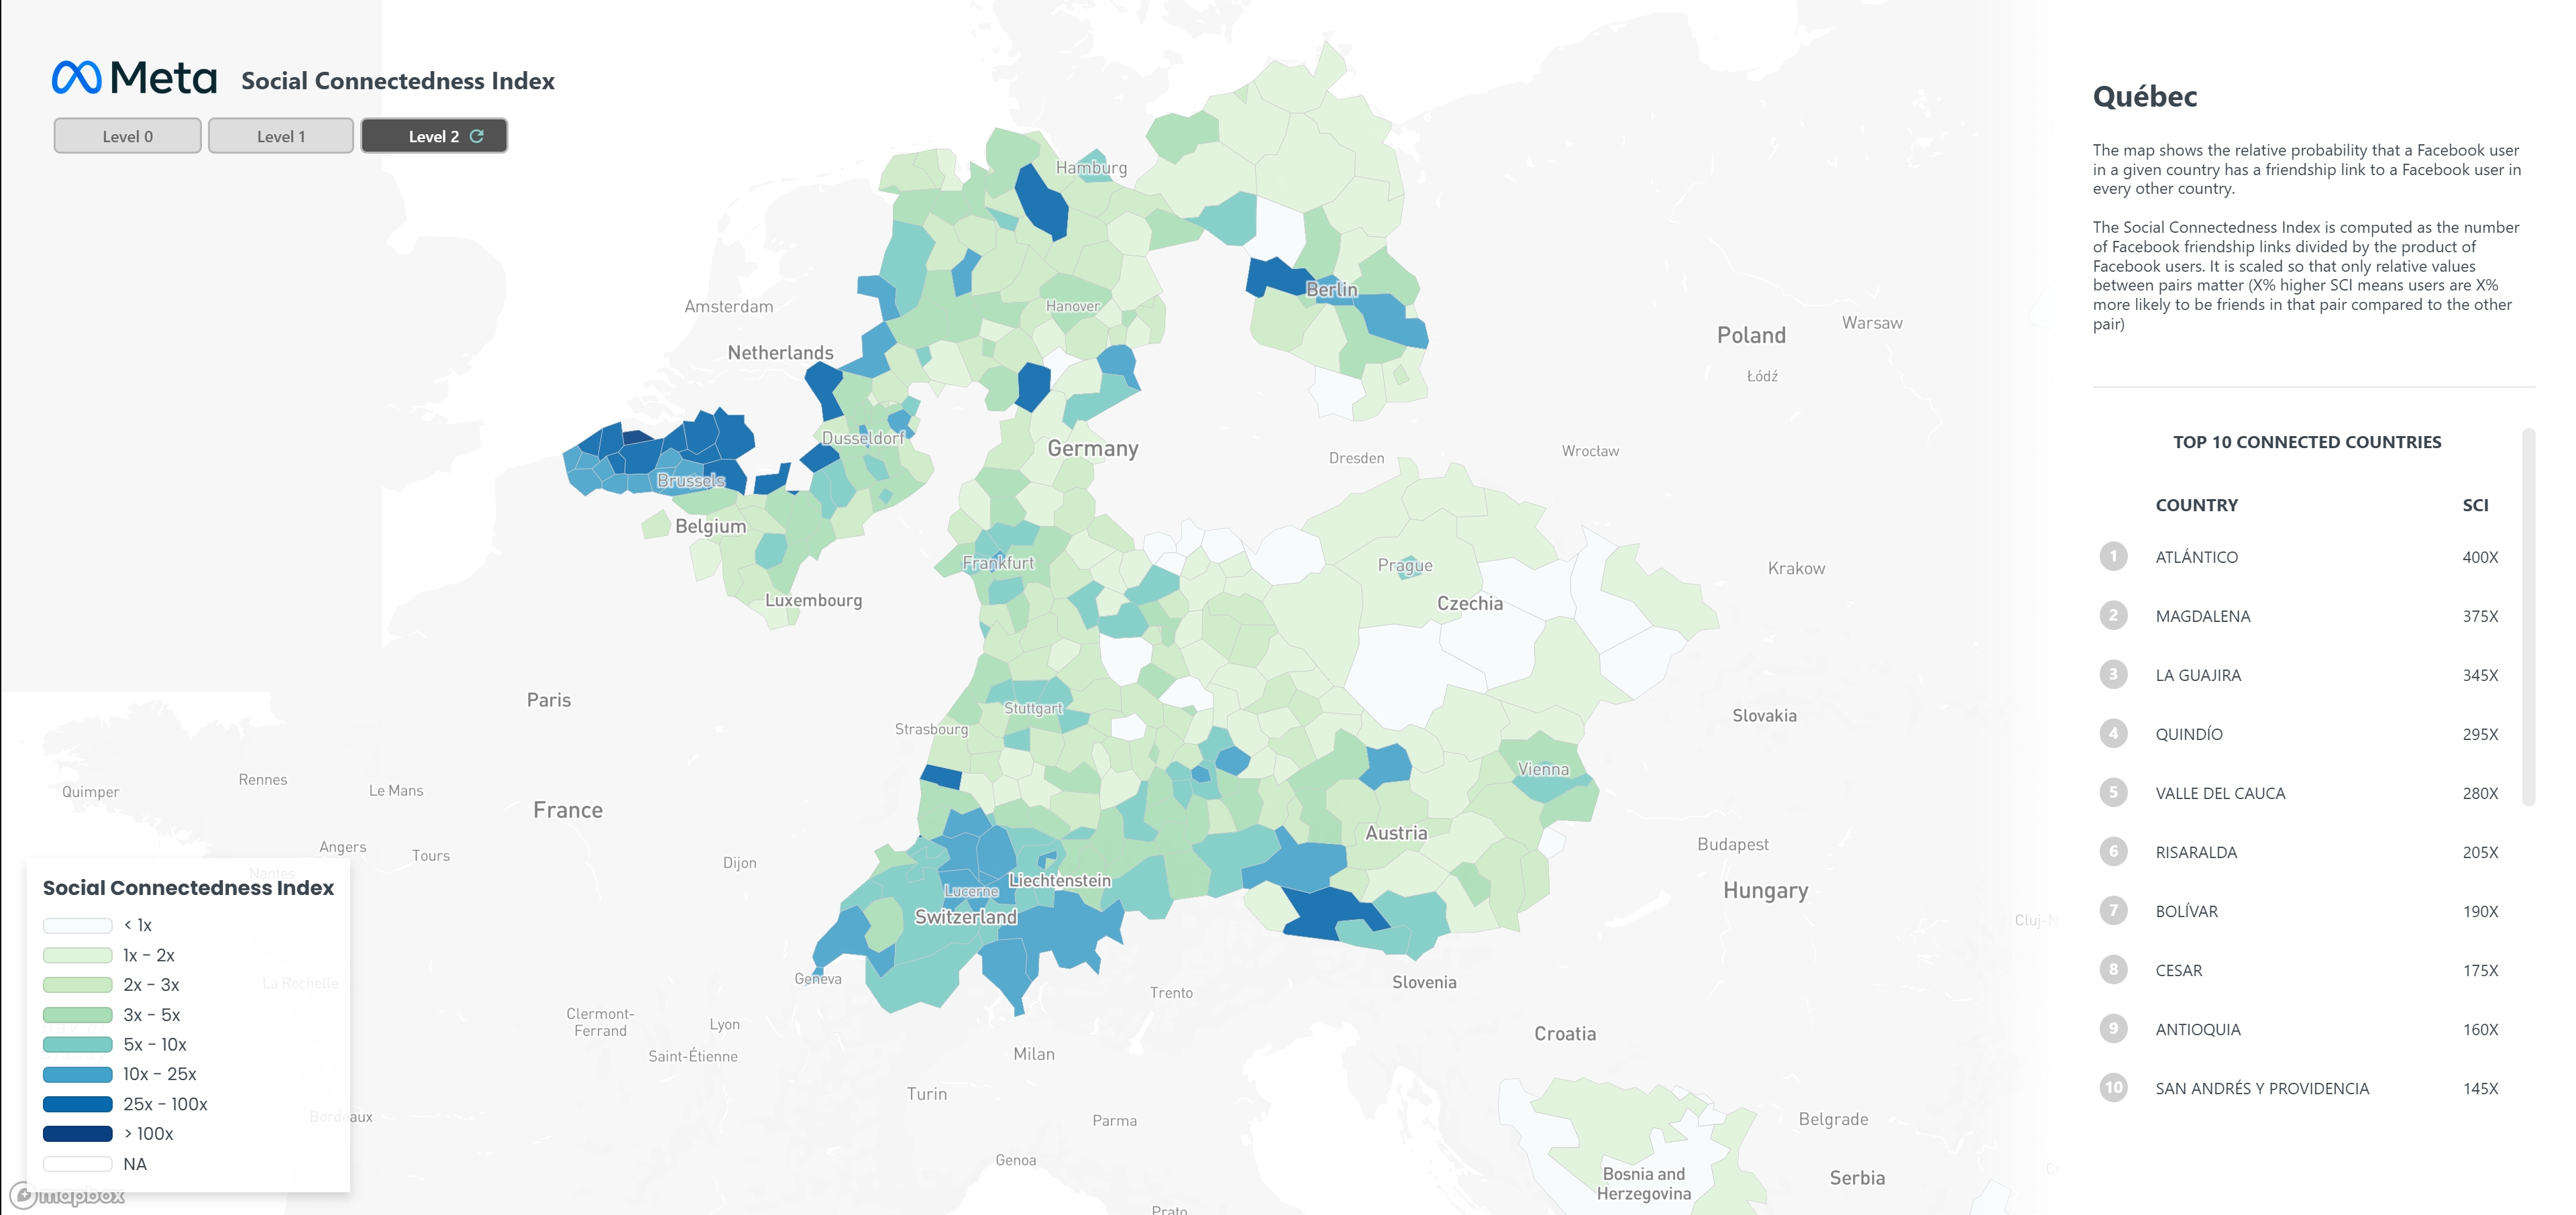
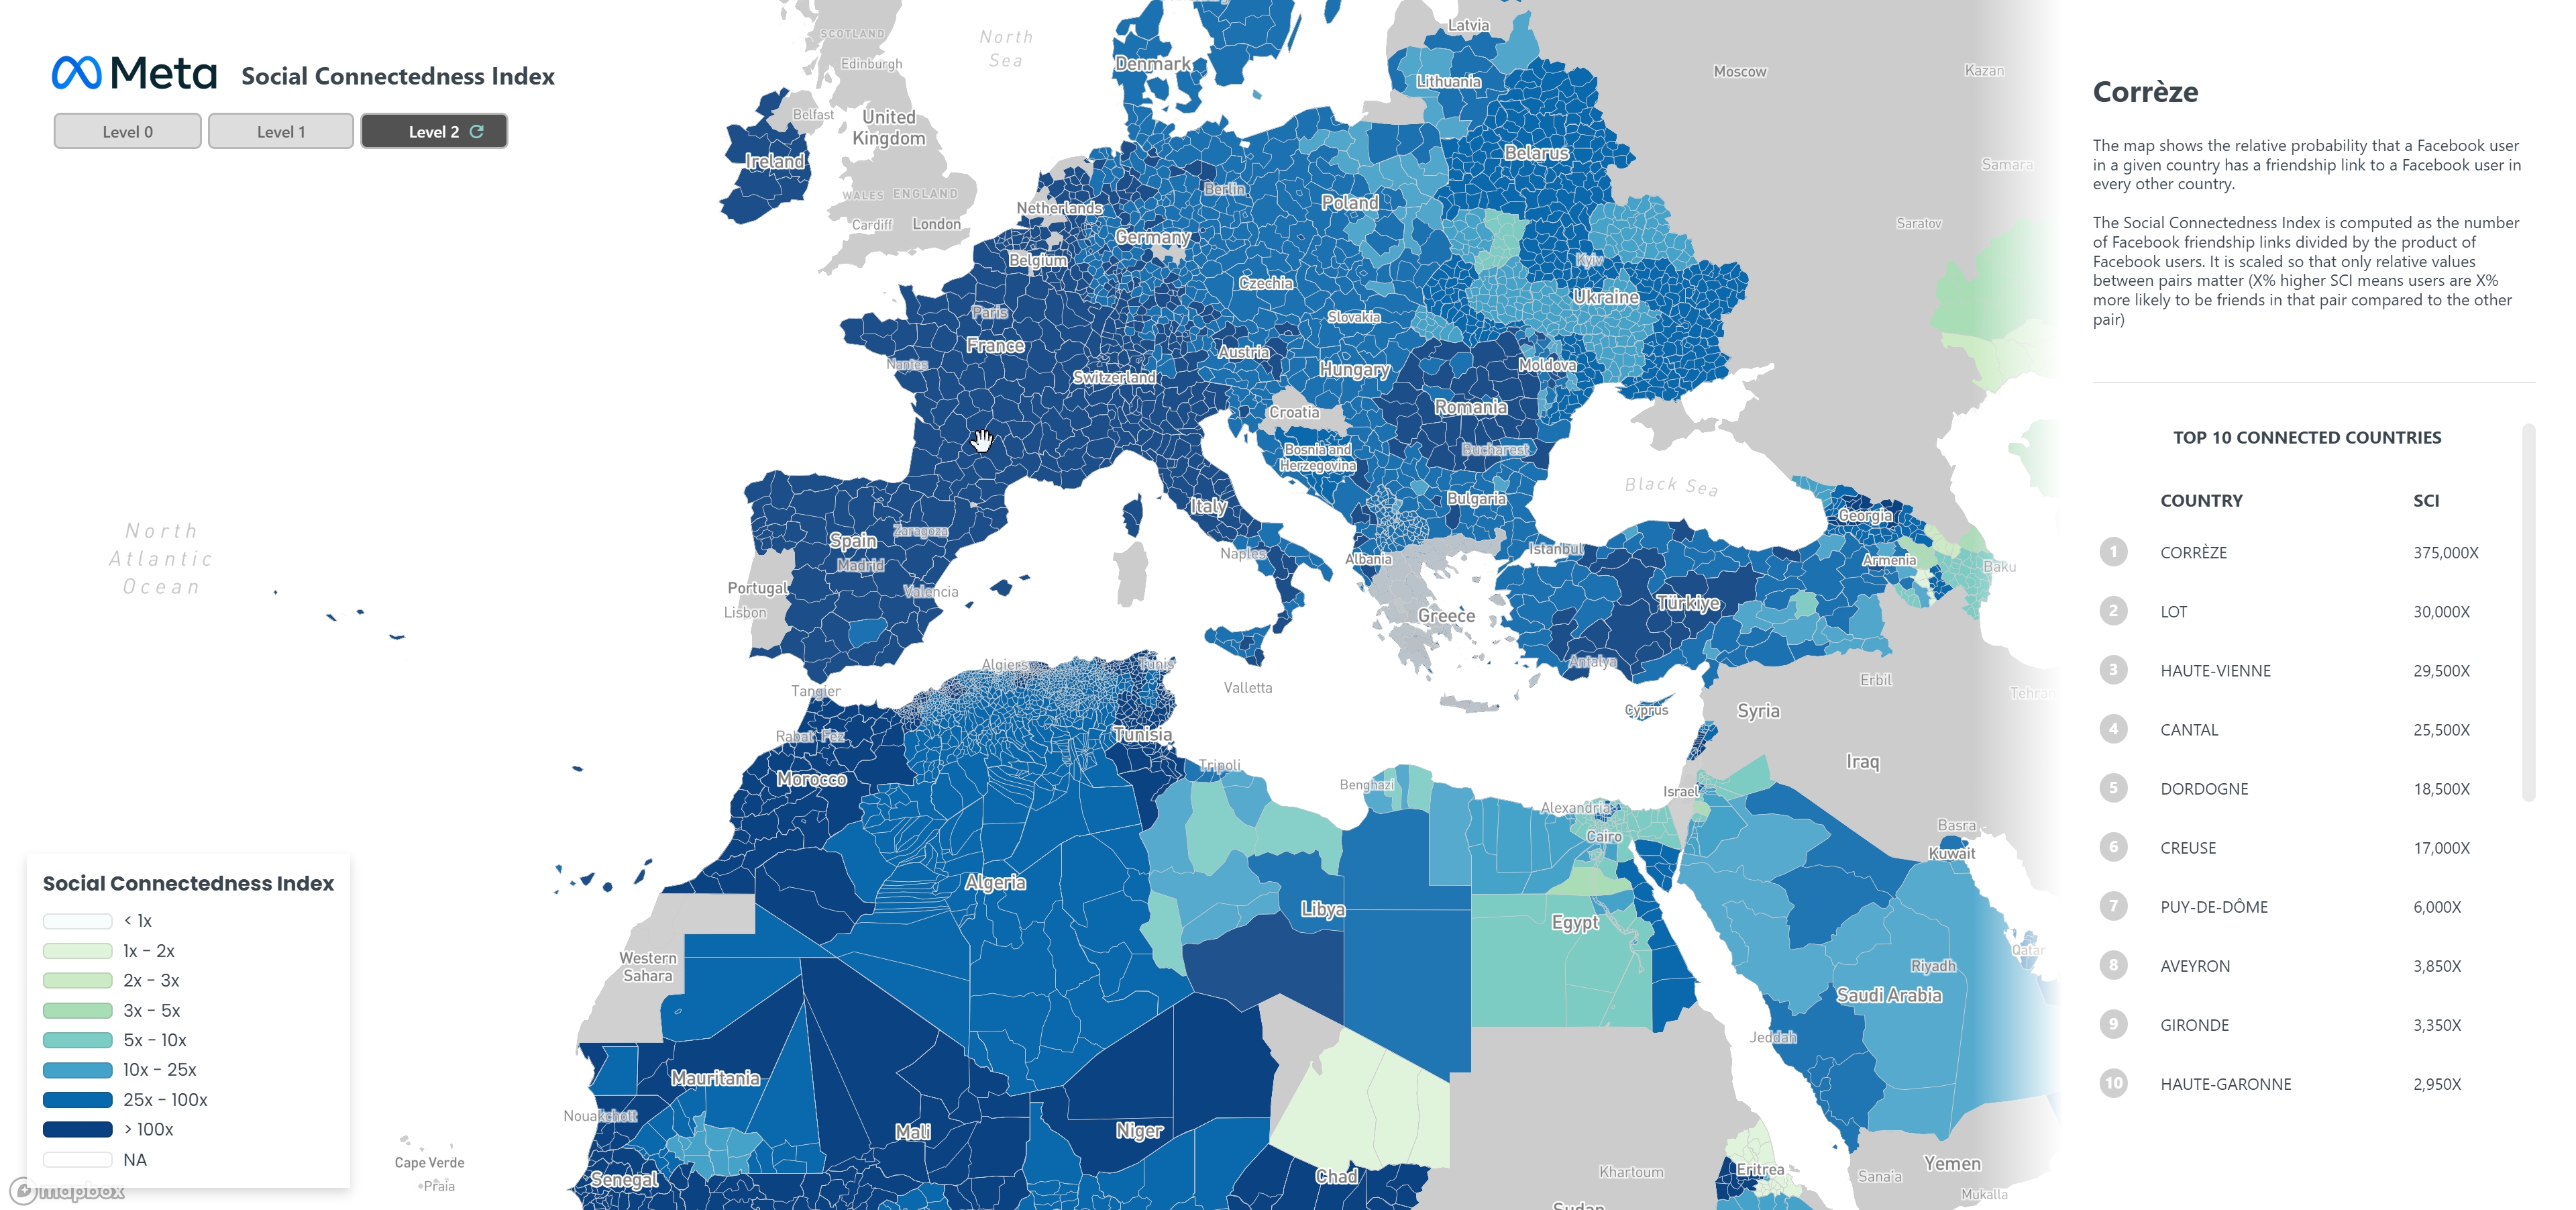
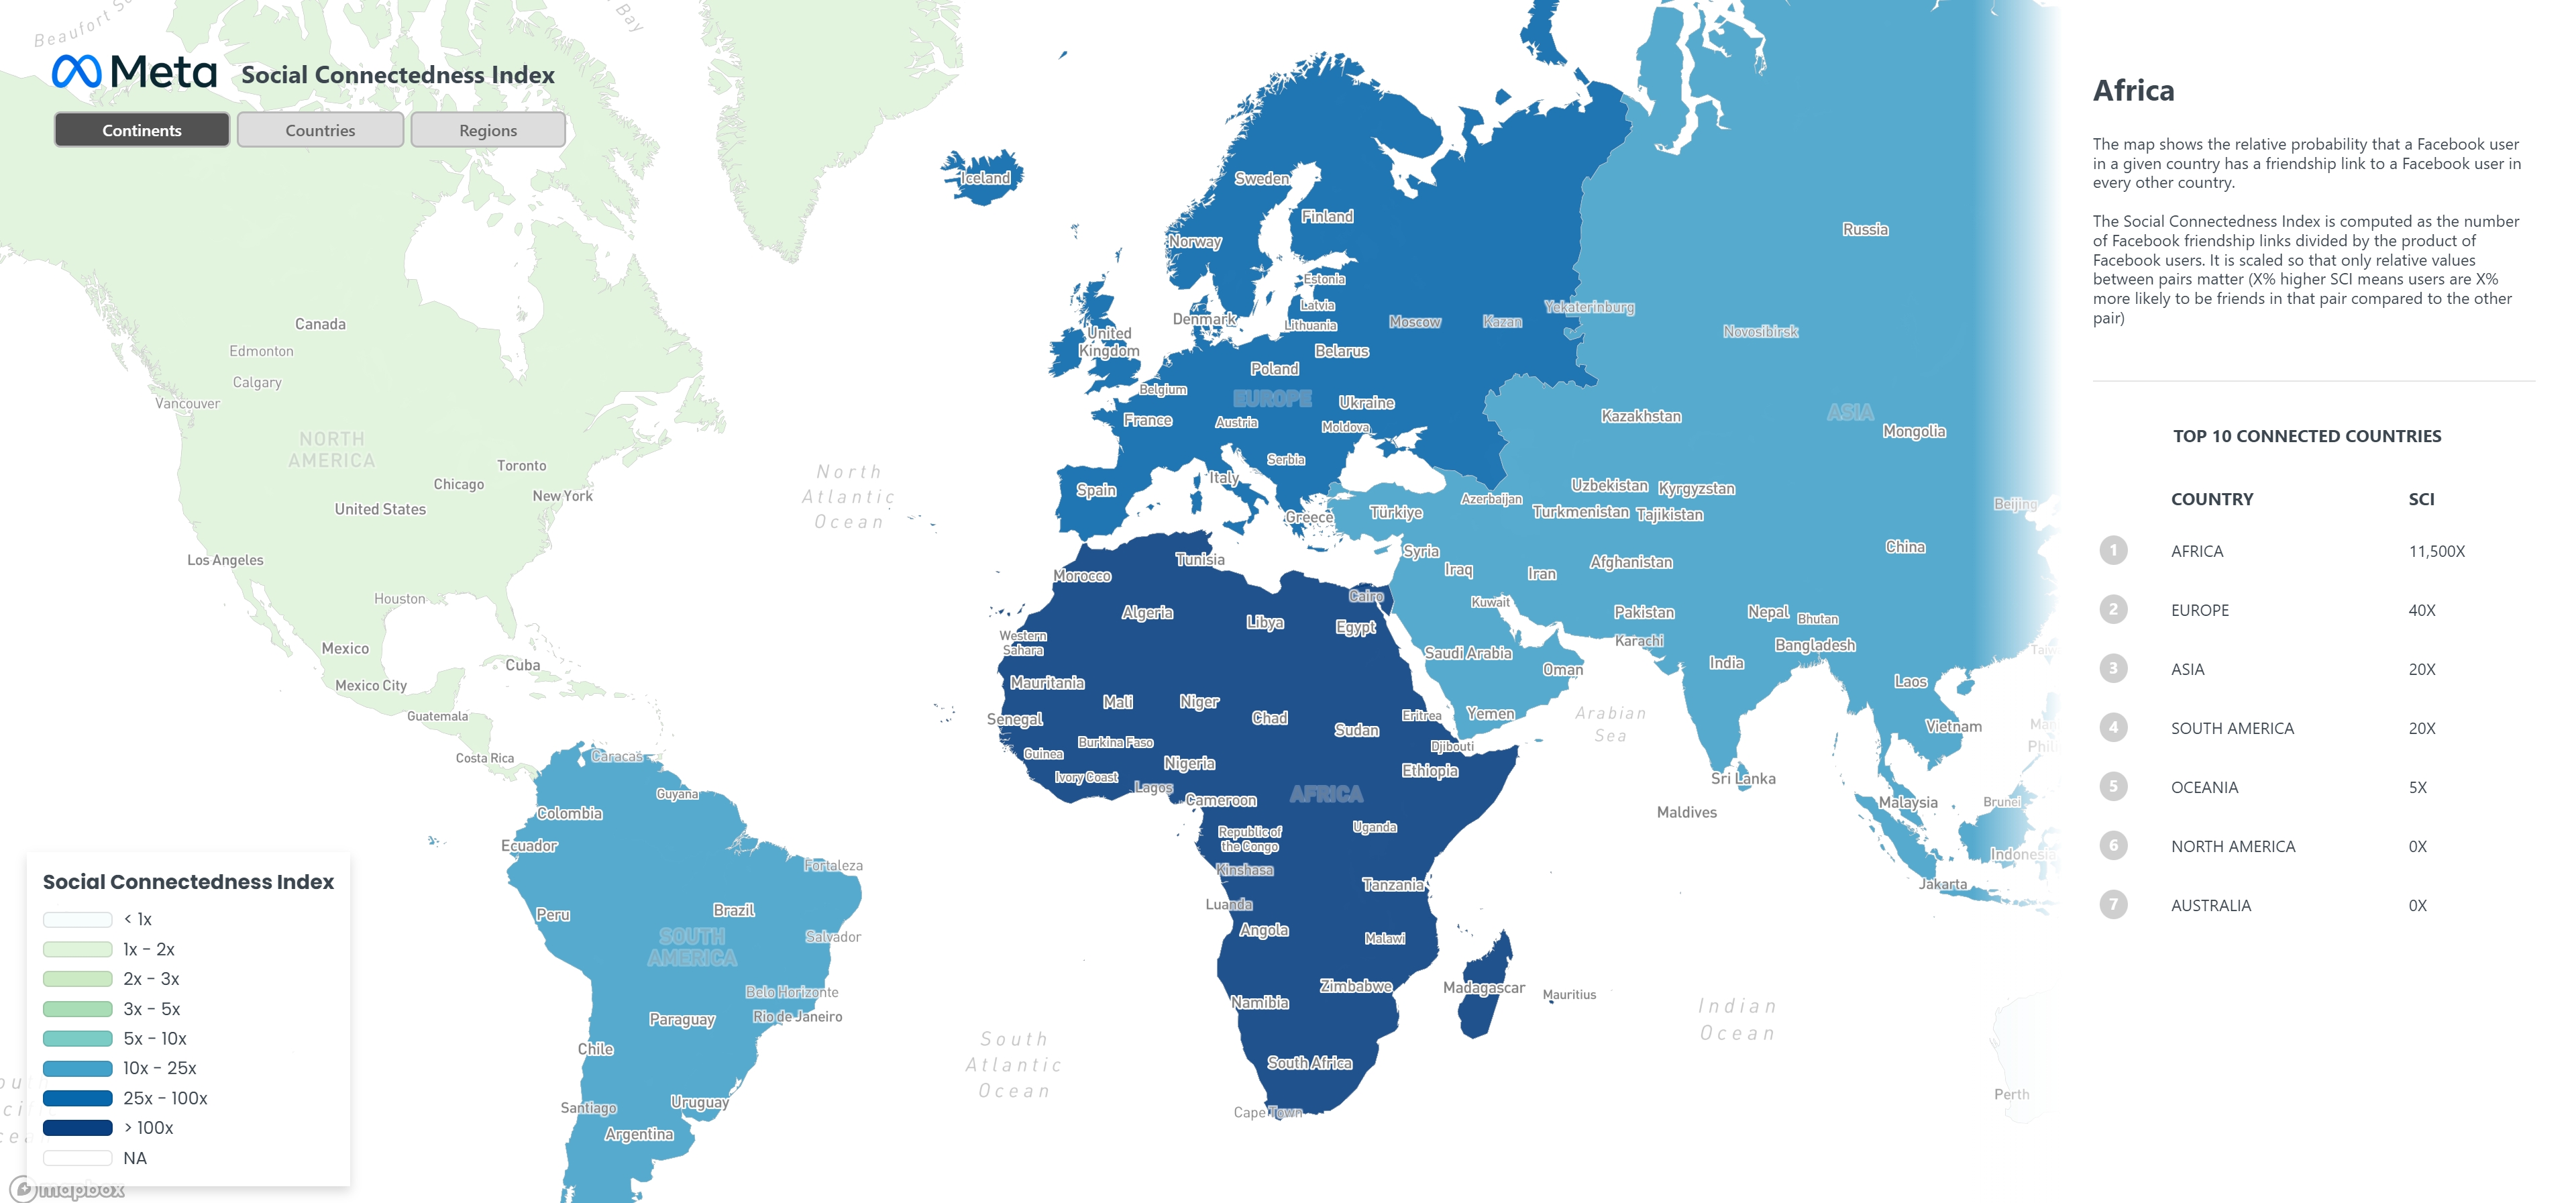
Several versions of the application were developed to test country, regional, subregional, and continent-level approaches. These experiments helped determine an appropriate balance between geographic detail, browser performance, data consistency, and usefulness for the physical exhibit.
The final event version deliberately reduced the interface to countries only. The United Arab Emirates was automatically selected when the application loaded, and after 60 seconds without interaction the visualization automatically returned to the UAE. This created a predictable default state for successive exhibit visitors.
Design & Data Visualization
I developed the interface, cartographic design, and data-visualization system for the finished application. Early mockups and visualization references supplied by the client helped establish the desired direction, but the final hierarchy, map behavior, classification approach, ranking panel, legend, and interaction logic were developed specifically for this project.
One important design decision was to avoid presenting SCI as an abstract raw number wherever possible. Expressing connections as multiples of a dynamically calculated reference made the relative strength of relationships easier to interpret visually while allowing the same classification logic to adapt to whichever country a visitor selected.
The project also demonstrated the value of reducing complexity during iteration. Although highly granular maps produced visually interesting results, they introduced both performance and interpretability problems. The final country-level interface provided a clearer exhibit experience while the earlier regional work remained useful as a tested extension of the underlying system.
Technical Approach
The application was implemented in JavaScript with Mapbox GL JS and a custom Mapbox style. Geographic boundaries were handled through GeoJSON sources and separate Mapbox fill and border layers, while SCI relationships were loaded from tabular CSV and TSV datasets.
When a visitor selects a geography, the application identifies all corresponding pairwise SCI values and associates them with the relevant geographic features. It then calculates the 20th percentile of the resulting SCI distribution as a reference value.
Classification thresholds are generated dynamically at 1×, 2×, 3×, 5×, 10×, 25×, and 100× this reference. Mapbox paint expressions are subsequently updated to recolor the map according to these relative classes. The same reference value is used to convert the ranked SCI results into readable connection multipliers.
Interaction states, dynamic legends, ranking updates, map transitions, default selection, and the inactivity reset were handled directly in the client-side application.
Technologies
- Mapbox GL JS
- JavaScript
- HTML/CSS
- GeoJSON
- CSV
- TSV
- custom Mapbox style
Data Workflow
Data preparation was a substantial part of the project rather than a separate preliminary task.
The regional and subregional prototypes required combining and matching different geographic systems, particularly GADM administrative boundaries and European NUTS geometries. Custom preprocessing work was used to merge geographic sources, normalize identifiers, remove unnecessary attributes, simplify geometry precision, and prepare data structures that could be used efficiently by the visualization.
The deepest geographic level proved particularly difficult because the supplied SCI dataset mixed different administrative resolutions and was too large to function efficiently as one locally loaded browser asset. A database and API architecture was considered, but the project first explored alternative approaches including splitting datasets geographically and simplifying the number of areas loaded at once.
These experiments demonstrated that maximum geographic granularity was not necessarily the most appropriate solution for the actual exhibit. The final scope was therefore simplified while retaining the broader data-processing and geographic architecture work as part of the delivered project.
Outcome
The finished interactive map turned a complex pairwise social-network dataset into a direct geographic exploration experience. Visitors could select a country and immediately understand where its strongest international social connections were concentrated through both map color and ranked results.
The final v08 country-level version was used at the actual event. After the exhibit, the client reported that no glitches or bugs had been found, that the visualization worked successfully on the touchscreen surface, and that the vendors and event staff were very pleased with the result.
The final deliverable was the complete visualization code package and associated prepared datasets, allowing the client to host or redeploy the application independently.