
EV charging infrastructure / site prioritization and network planning in Malaysia
EV Charging Site Selection & Location Intelligence Platform
Overview
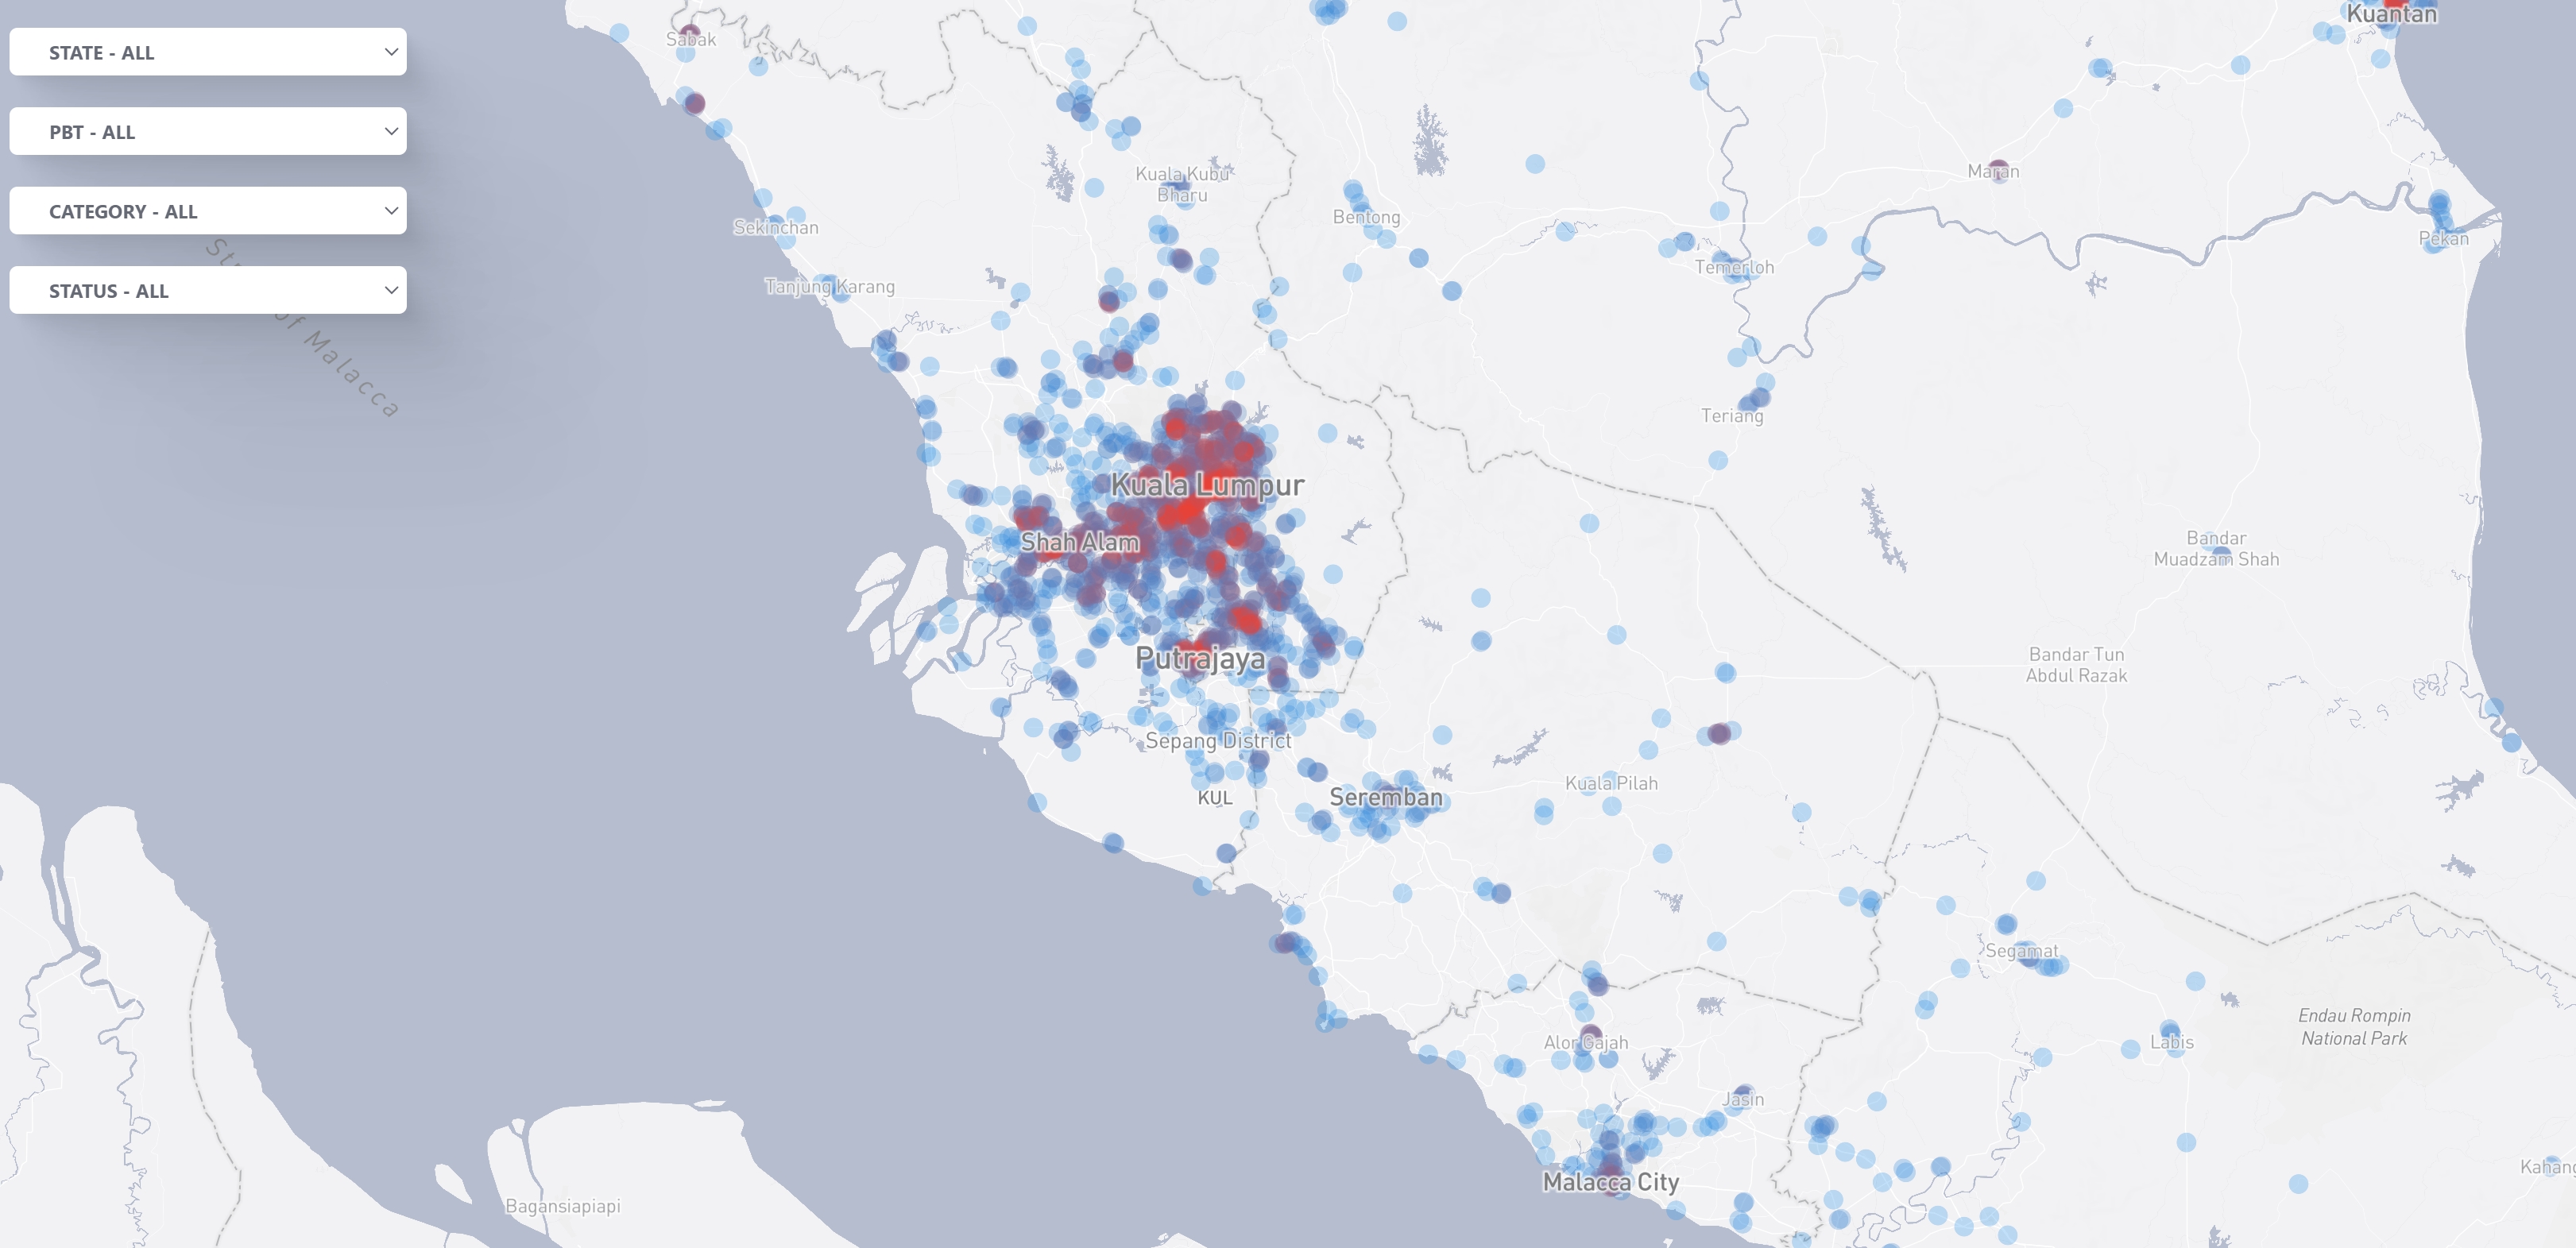
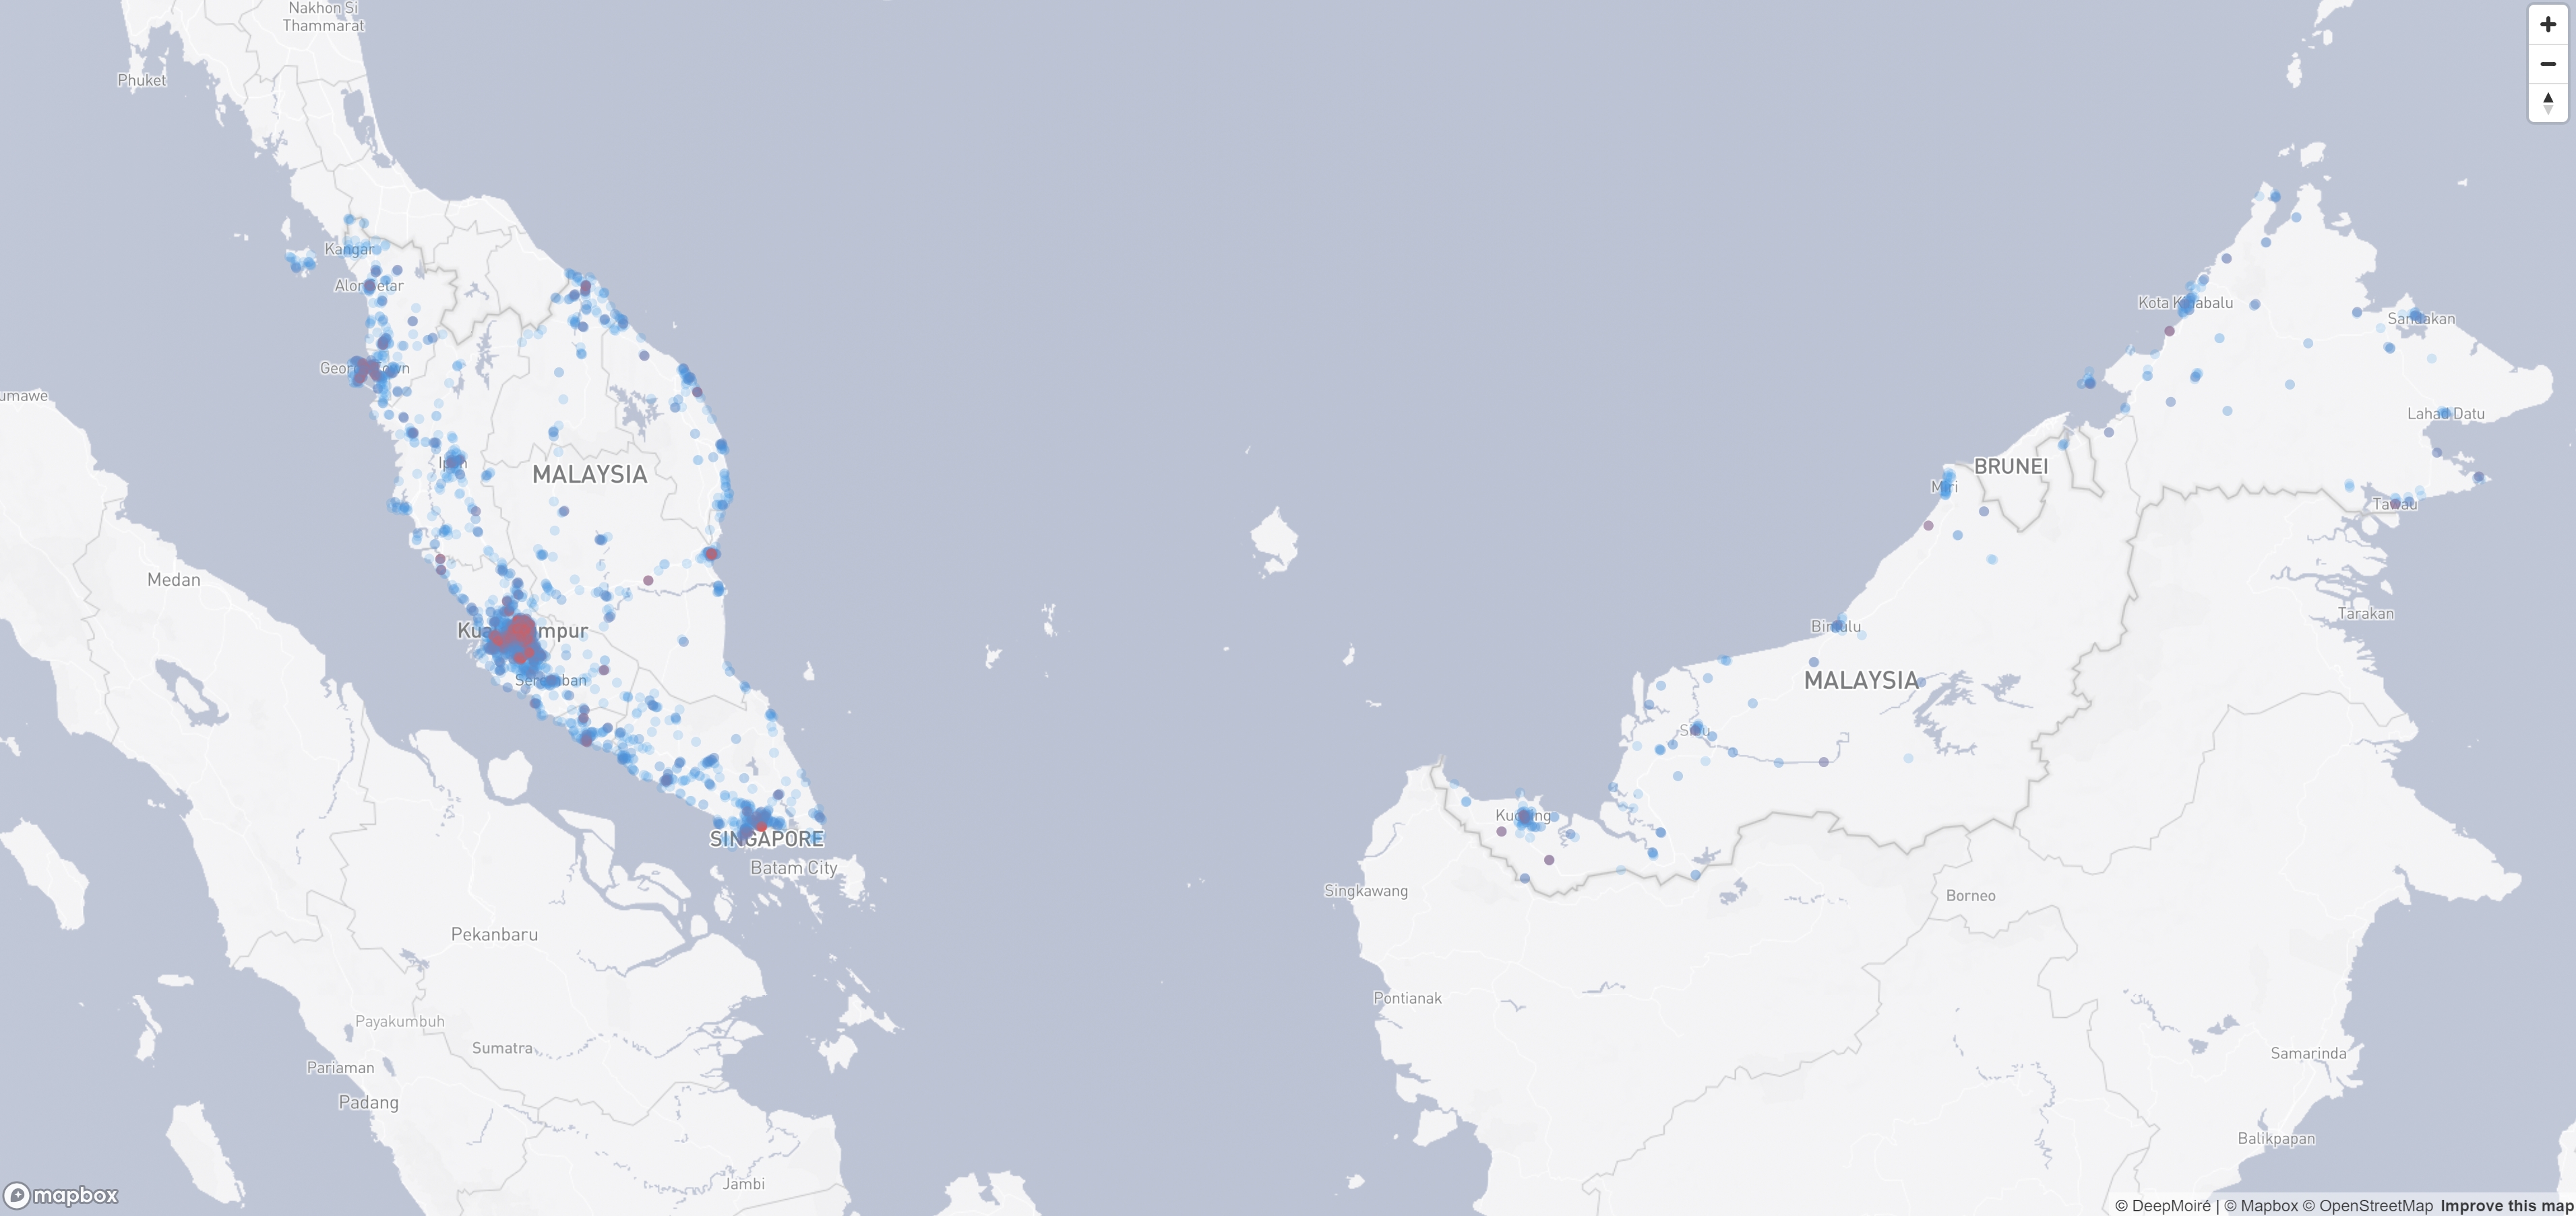
I designed and developed a location intelligence platform for evaluating EV charging sites across Malaysia. The source workbook contained 3,865 locations, including 750 existing charging locations and 3,115 newly proposed sites. The application combined this network with district-level socioeconomic data, traffic activity, location categories, custom candidate sites, and site-specific assumptions inside a Mapbox-based decision-support interface.
Users could move from nationwide exploration to individual site analysis, compare locations through a multi-factor ranking model, inspect traffic patterns by day and time, add new candidate locations, and generate analytical PDF reports.
Challenge
The main challenge was turning several heterogeneous datasets into a coherent site-selection workflow rather than simply plotting charger locations. Charger competition had to be calculated spatially around each point, socioeconomic indicators existed at district level, and traffic activity came from a separate large-scale data source that could not be loaded efficiently as one national dataset.
The scoring methodology also evolved during the project. The final model needed to combine network density, socioeconomic conditions, traffic, power-supply status, and amenities while keeping the underlying components visible enough for users to understand and review an individual location.
Solution
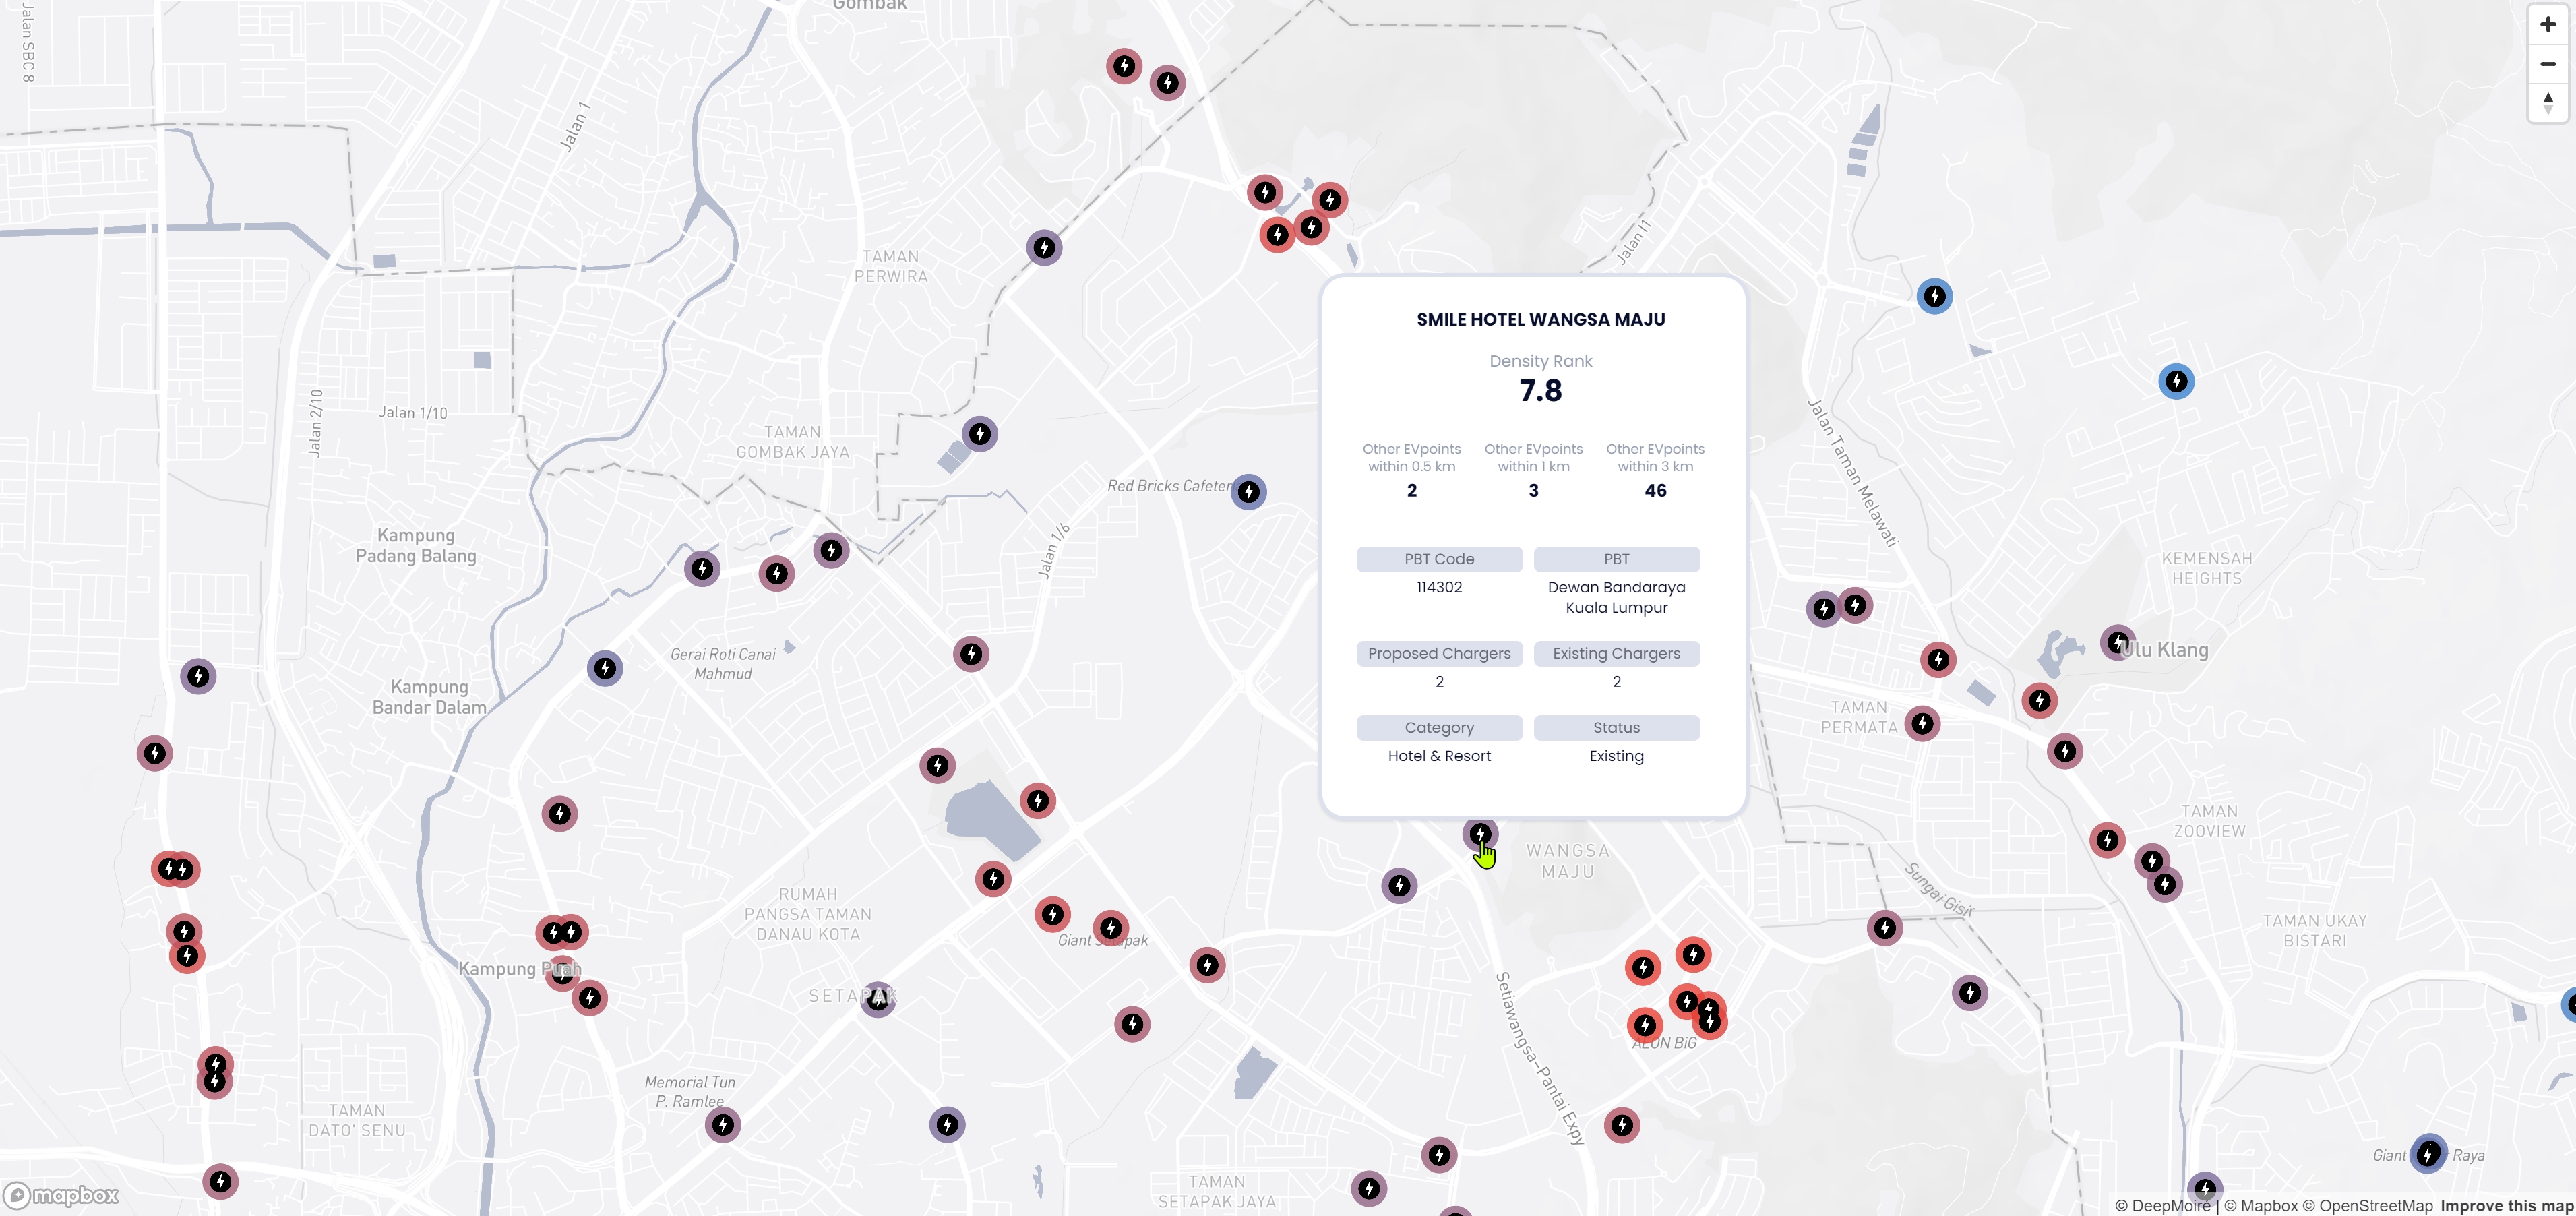
The finished application used an interactive Mapbox map as the central location-analysis interface. Users could filter sites by state, district, location, category, status, and ranking, then select a point to inspect its overall score and underlying indicators. Existing locations, proposed locations, and custom-created candidate sites were handled as distinct data types.
I also developed the custom-location workflow: users could enter latitude, longitude, location, and category data, review the new point before confirmation, store it for future analysis, and run the same scoring and reporting workflow used for existing sites. A location-specific PDF report combined a captured map view with coordinates, charger-network context, dwell-time and charger-capacity estimates, scoring inputs, and the final score.
Design & Data Visualization
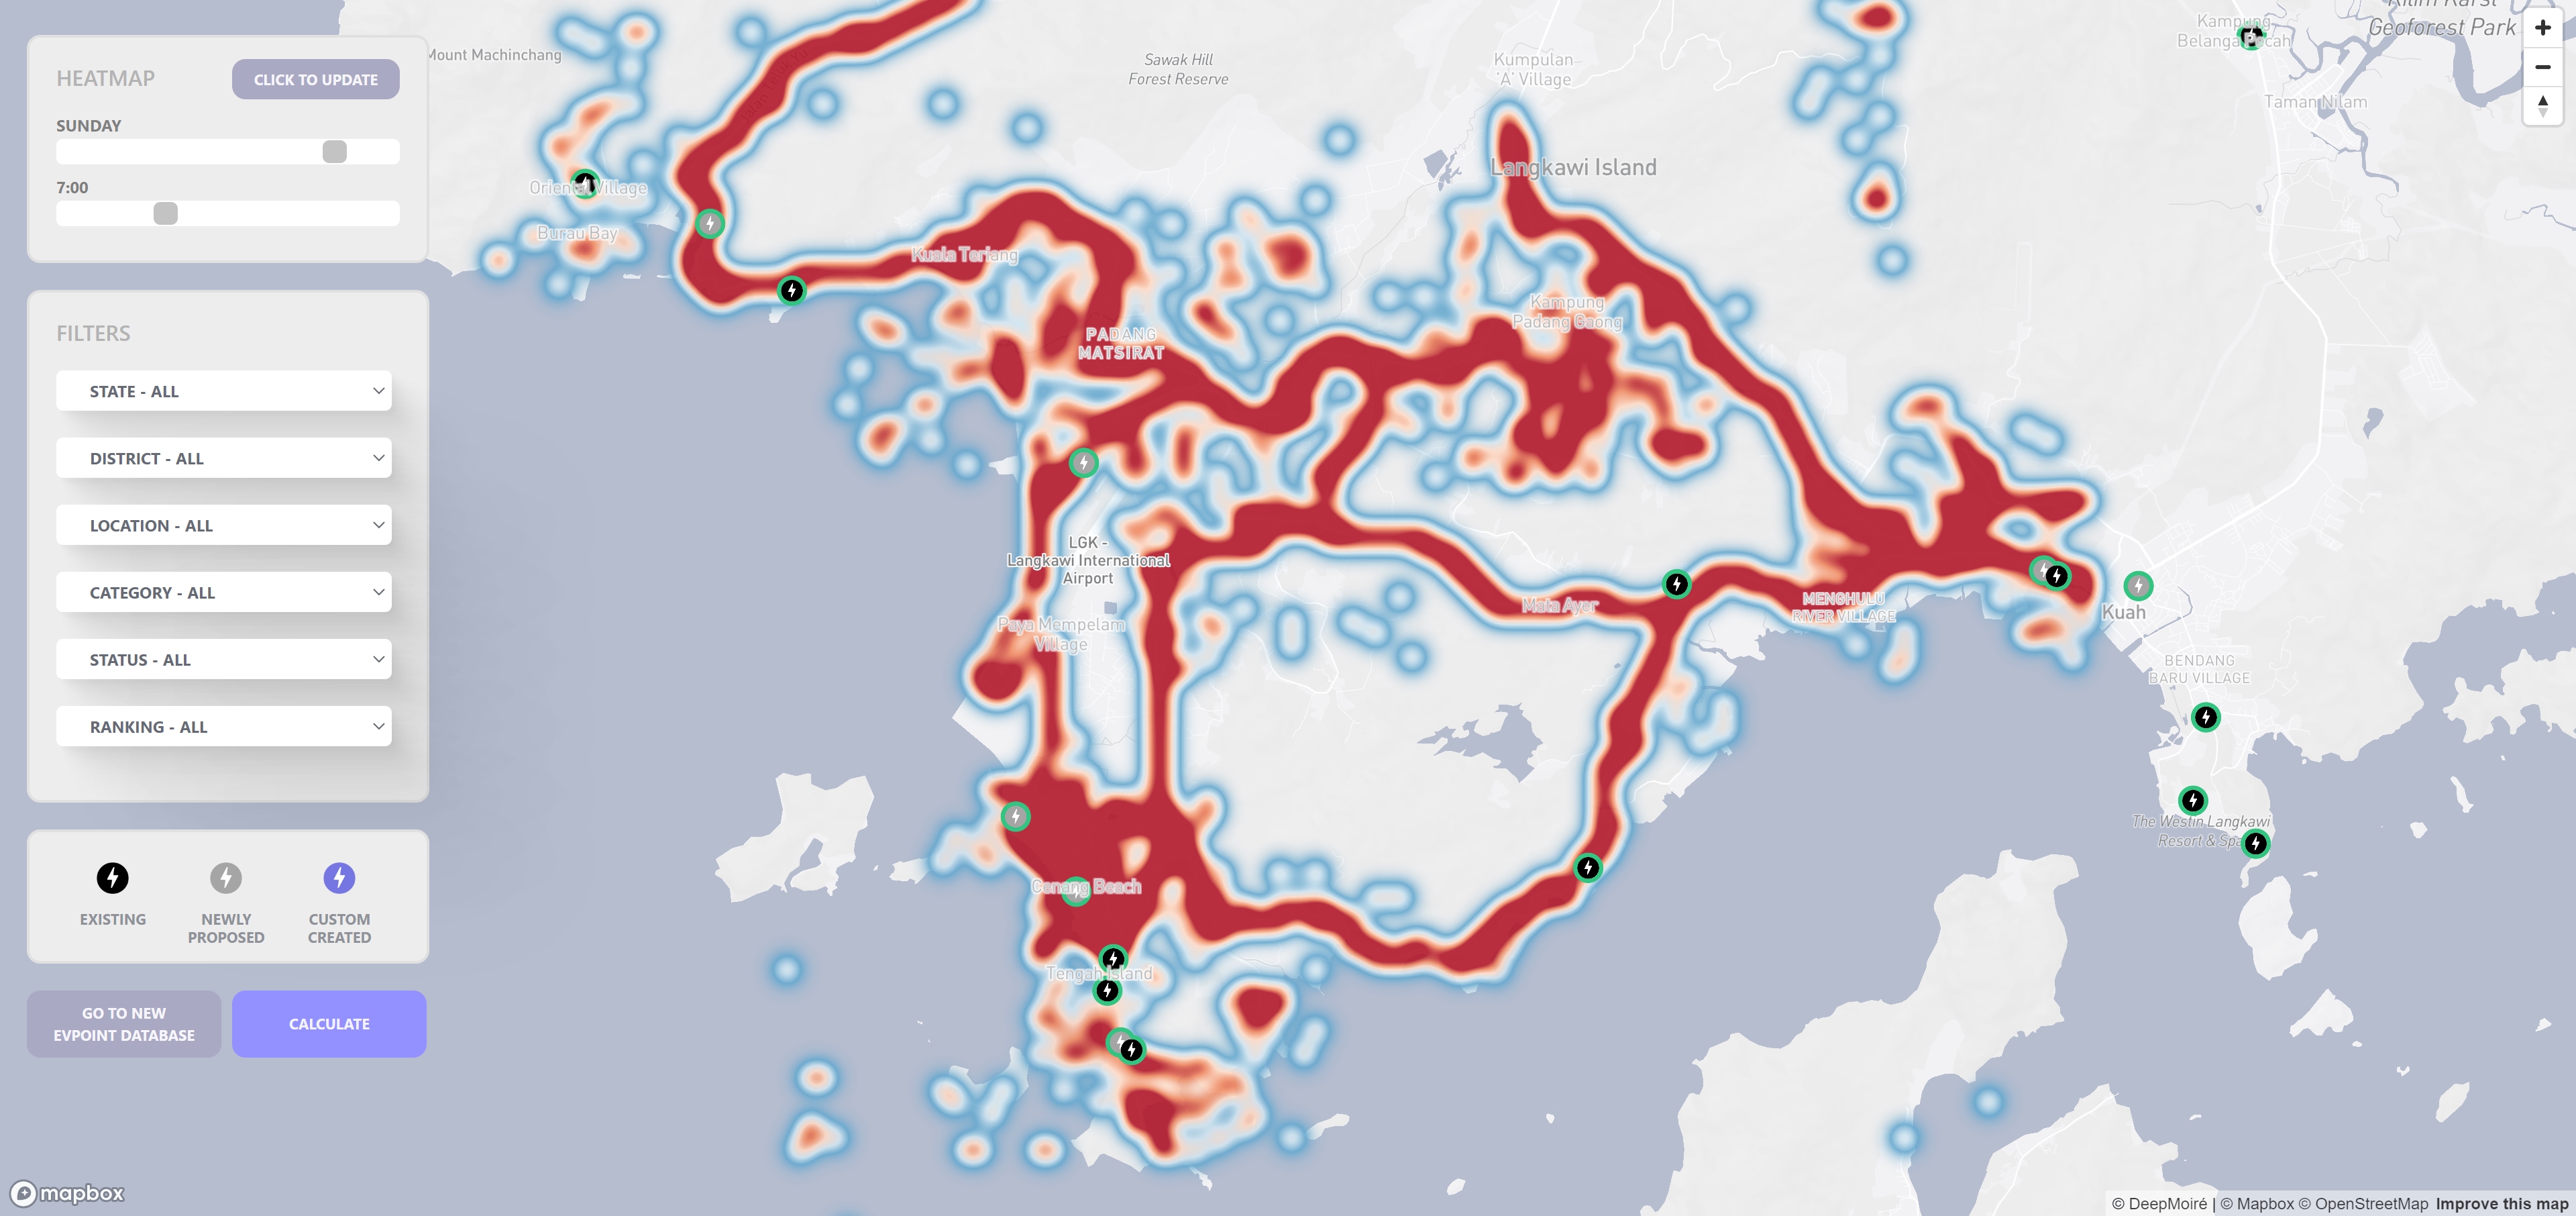
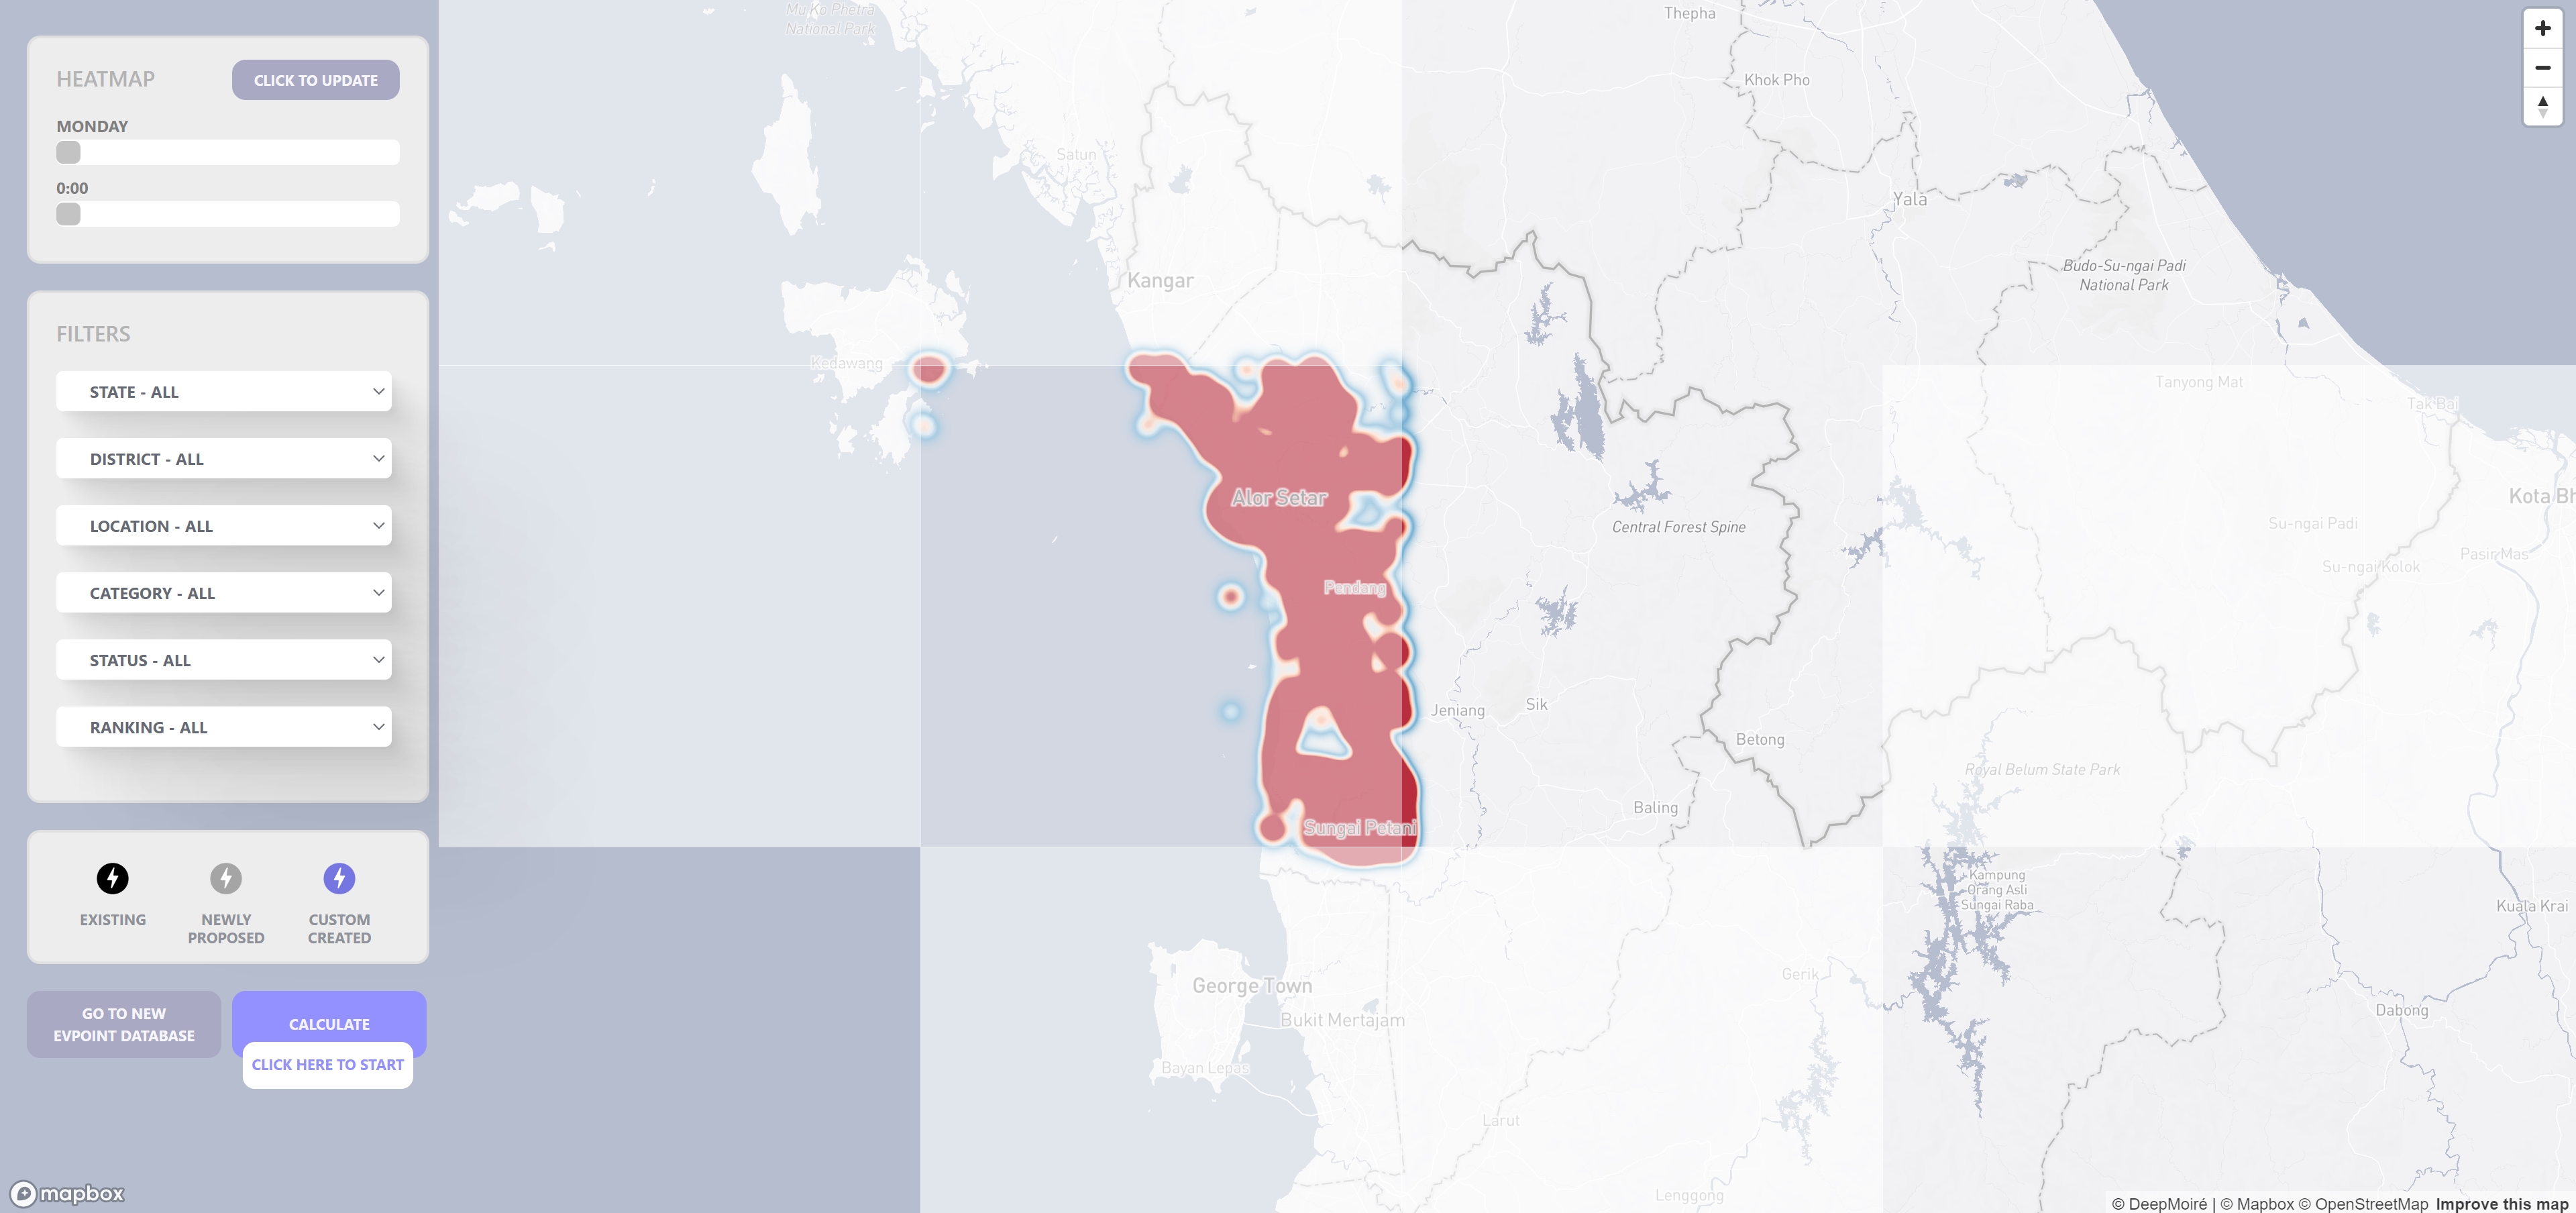
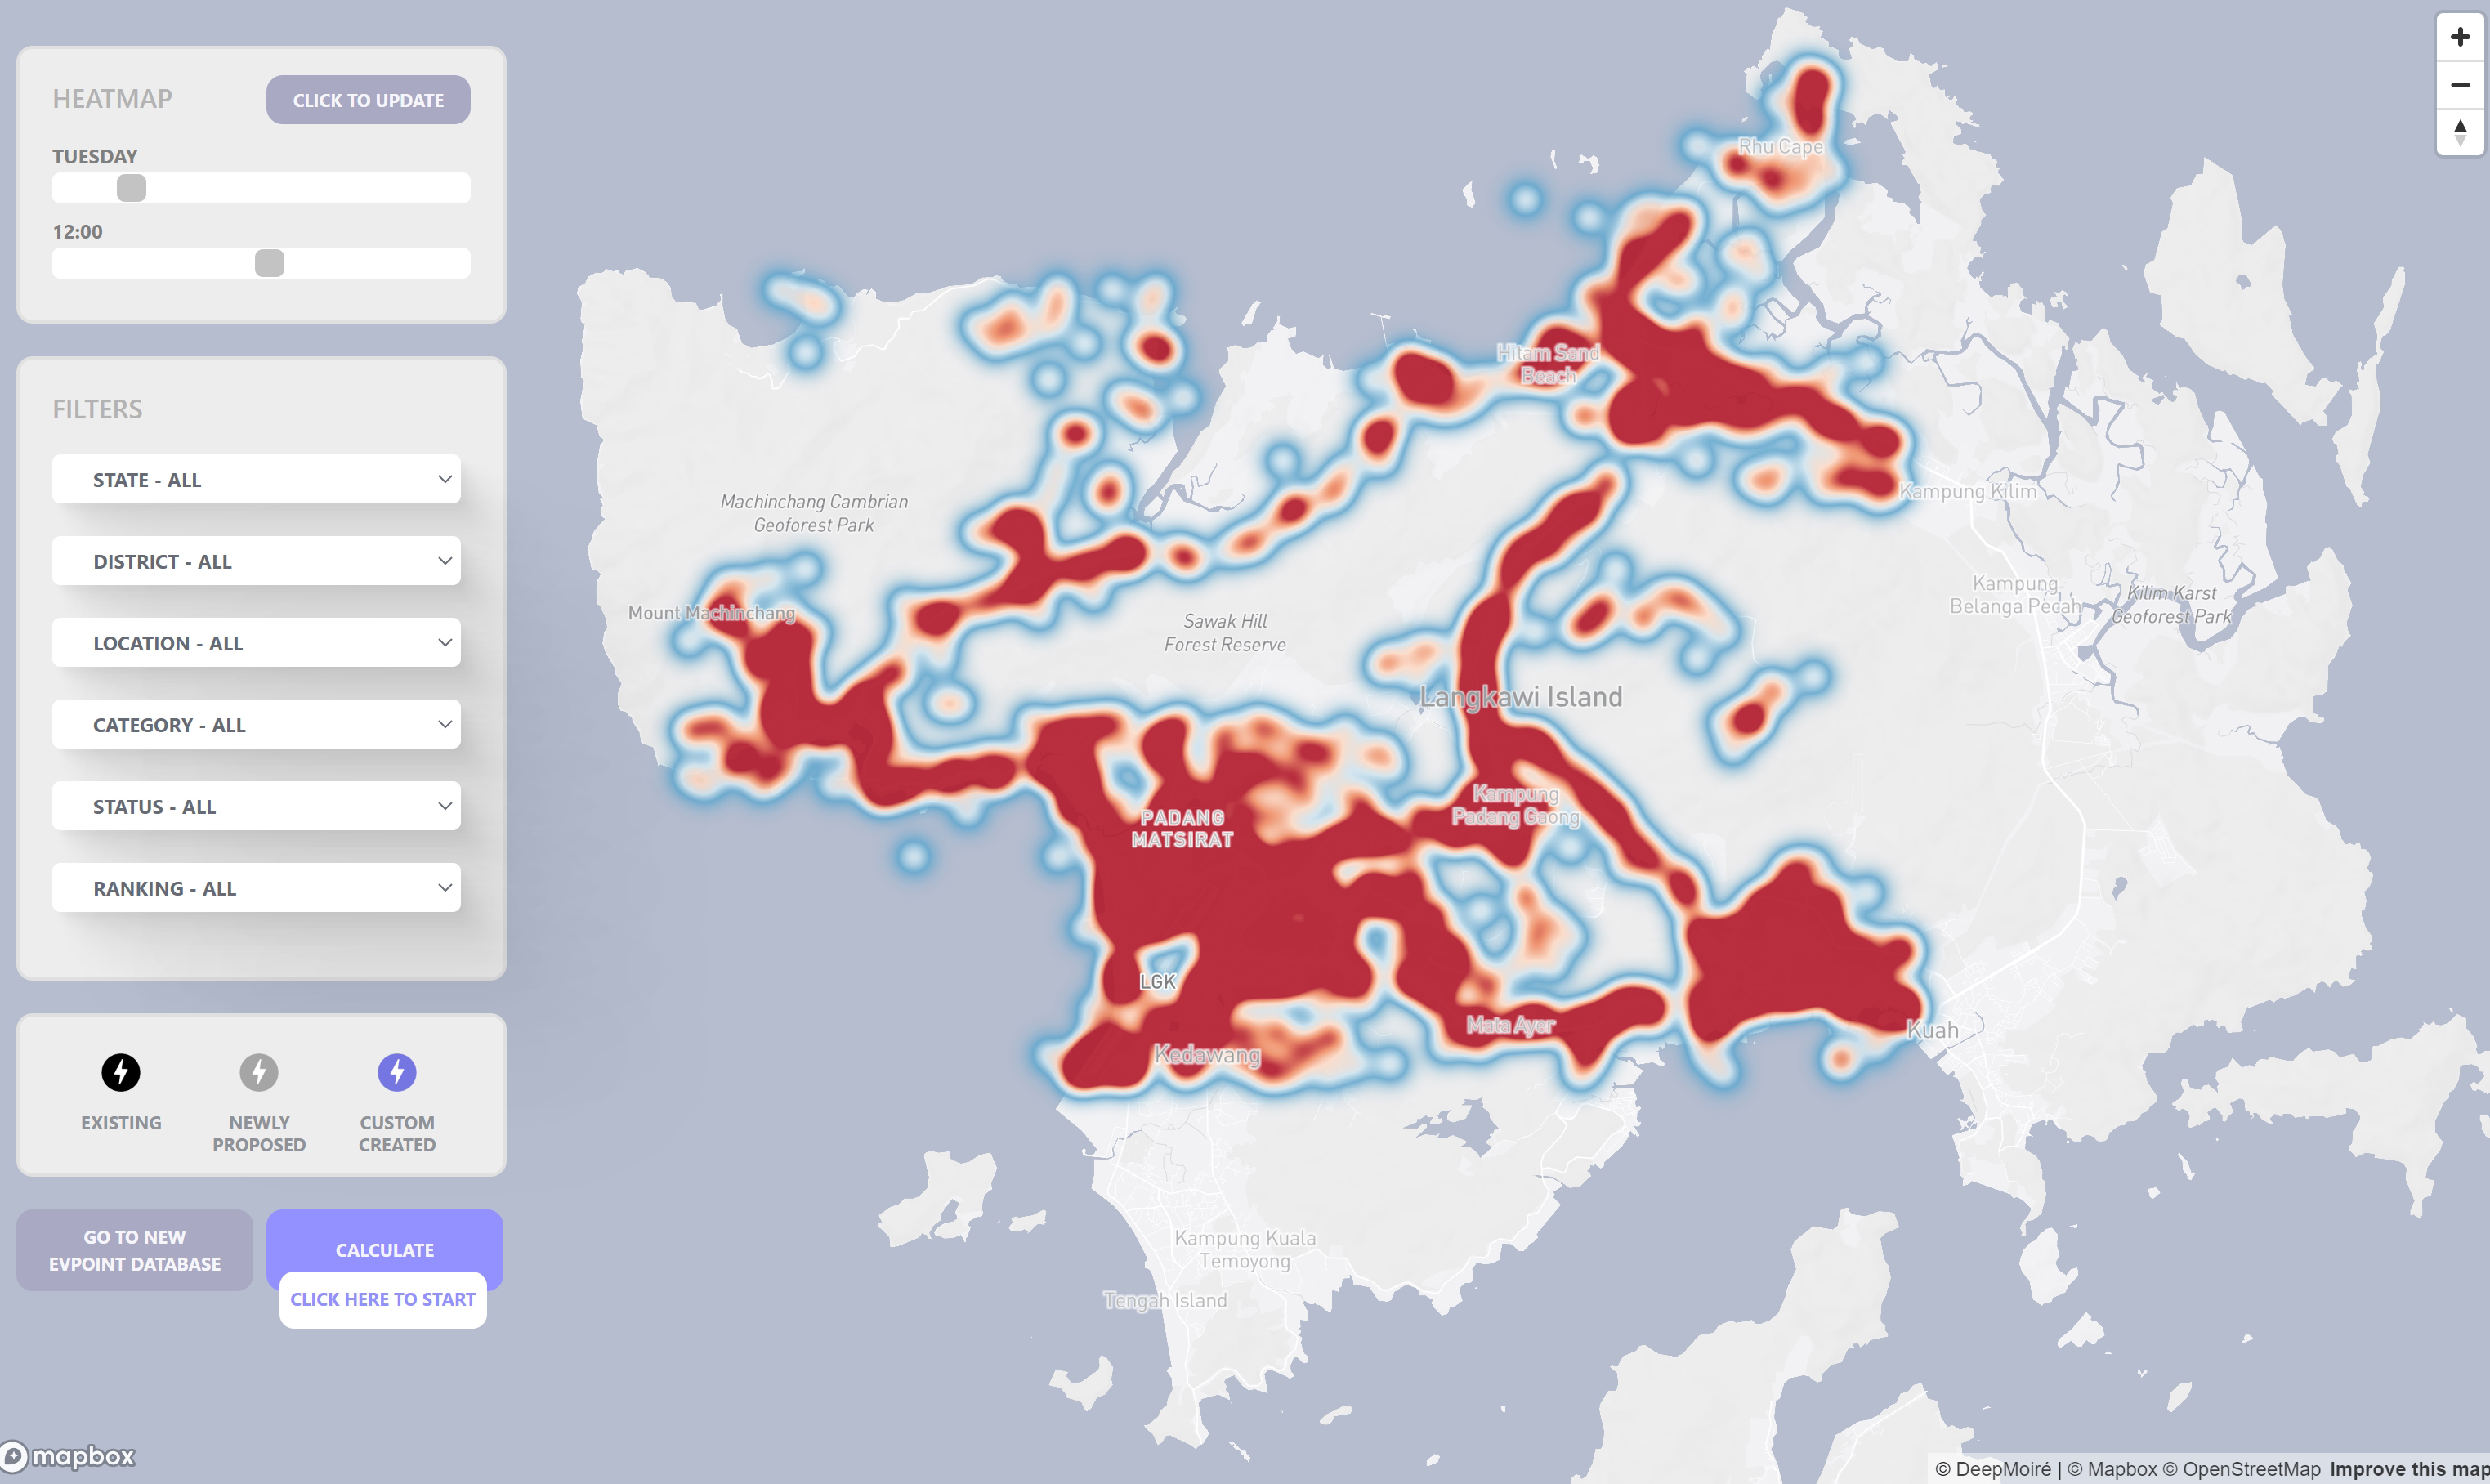
The operational interface combined charger symbols, ranking categories, filter controls, and a traffic heatmap that could be updated by day and time. This allowed network-scale traffic patterns to remain visible while individual sites were evaluated numerically.
The project also included a dedicated presentation-oriented traffic visualization using darker styling, angled map views, smooth automated camera movements, and sequential day-by-day transitions across selected areas. It was developed as part of the same project to communicate how traffic activity changed spatially over time.
Technical Approach
The EV dataset was converted from tabular coordinates into GeoJSON. Turf.js point-in-polygon operations assigned state and district attributes from administrative boundaries, while D3.js was used to normalize several analytical values into comparable ranking ranges. Charger density was calculated from existing EV points within the final 1 km, 5 km, and 10 km distance bands, with nearer infrastructure weighted more strongly.
District socioeconomic scores were connected to each site through its spatially assigned district. Location categories were mapped to expected dwell-time ranges and corresponding charger-capacity ranges. Traffic activity was retrieved through geographic API requests based on map quadkeys rather than loading the complete national traffic dataset at once. The final overall score used 20% charger density, 10% socioeconomic score, 40% traffic score, 15% power-supply status, and 15% amenities.
Technologies
- Mapbox GL JS
- JavaScript
- D3.js
- Turf.js
- jQuery
- csv2geojson
- GeoJSON
- CSV
- Google Sheets
- REST API
- jsPDF
Data Workflow
The workflow combined several stages: EV location records were converted to geographic features; administrative polygons supplied state and district assignments; district socioeconomic data was joined to the mapped locations; proximity analysis calculated surrounding charger density; category lookups supplied dwell-time and charger-capacity estimates; and custom candidate locations entered through the interface were processed through the same analytical pipeline.
Traffic data followed a separate API-based workflow. Aggregated traffic information was requested for specific geographic areas or individual point geographies, allowing the application to visualize and score traffic without transferring the full national dataset to the browser. The resulting indicators were combined in the site-ranking model and passed into the PDF reporting workflow.
Outcome
The completed platform turned separate EV, demographic, socioeconomic, traffic, and site-assessment inputs into one repeatable location-intelligence workflow. Users could explore the Malaysian charging network, evaluate existing or custom candidate sites, understand the factors behind each ranking, inspect traffic conditions, and generate a structured report for an individual location.
The system progressed through testing and UAT while the traffic integration and scoring logic were refined. The final delivered work included the revised point/geography-based traffic scoring, the reporting workflow, the custom-location interface, technical documentation, and the presentation-oriented traffic visualization, and it was retained as an internal-use application.