
Climate risk / relocation and community decision support
Climate Decision-Support Map & Personalized County Ranking Platform
Overview
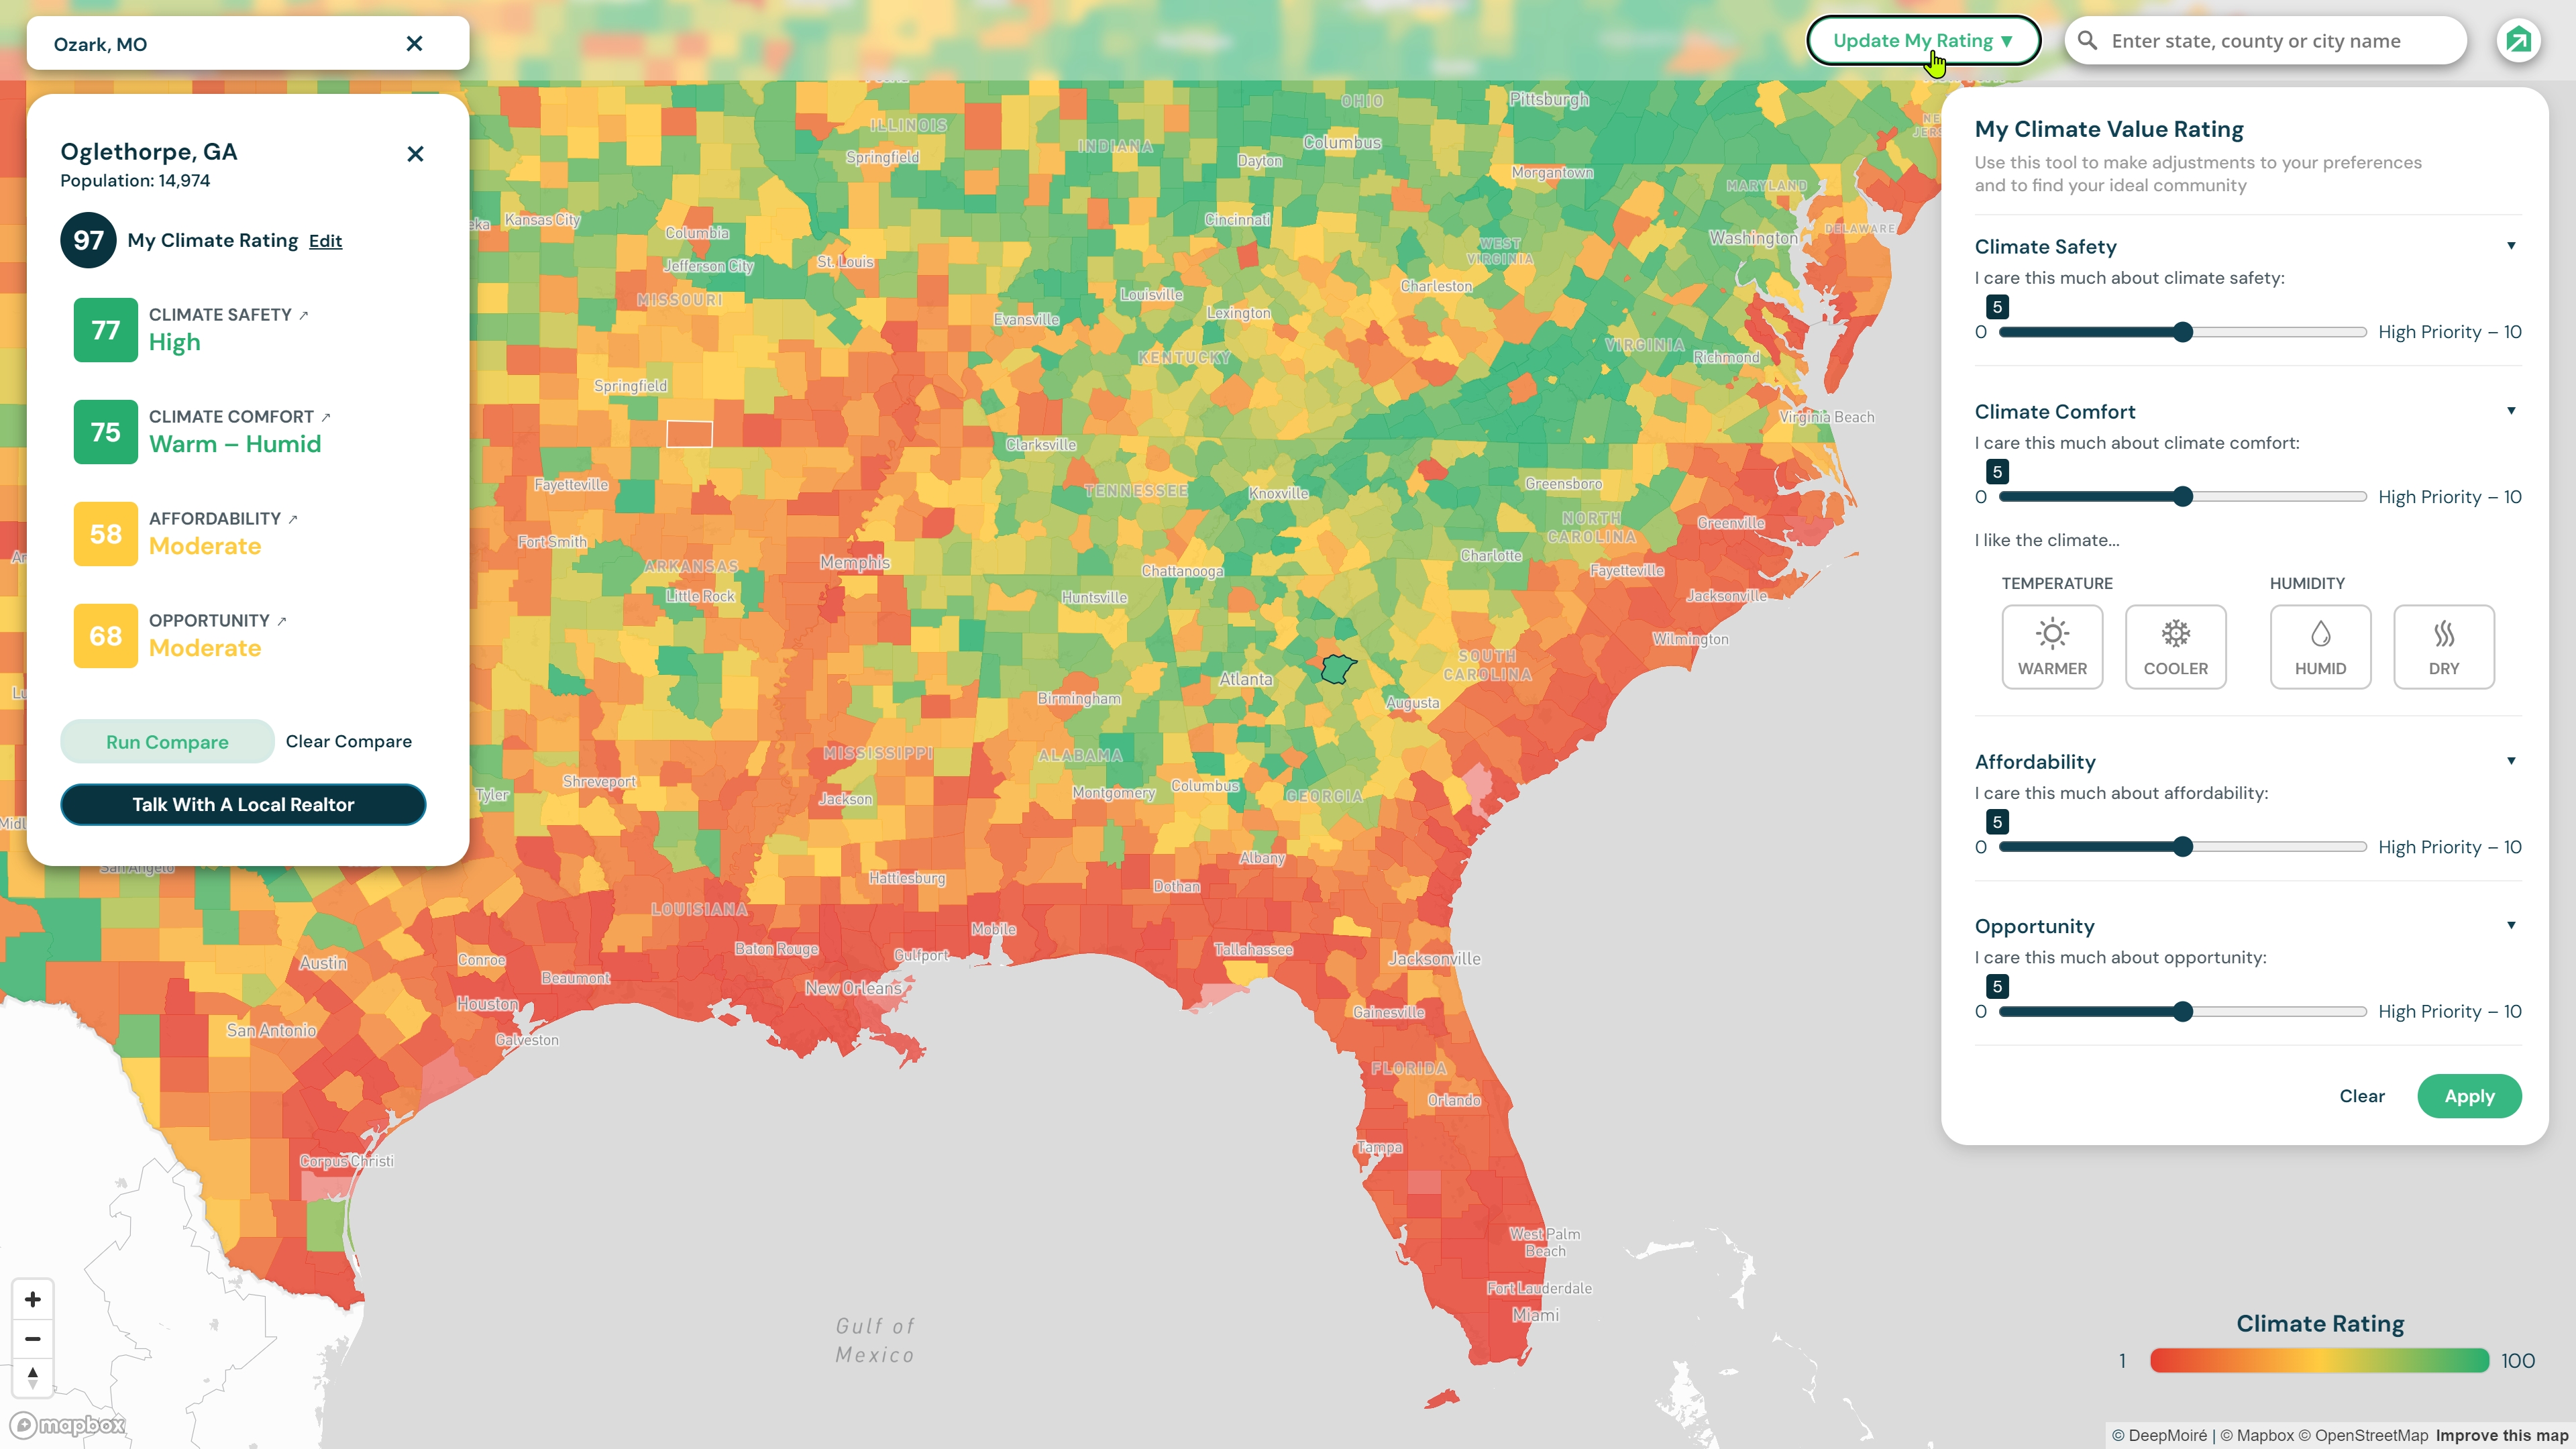
This project developed a county-level geospatial web application that helps users evaluate and compare locations across the United States through climate, affordability, and economic-opportunity data. Built and expanded across 2024 and 2025, the platform combines an interactive Mapbox map with county-level detail panels, geographic search, personalized scoring, comparison, ranking, and result-delivery workflows. The final version was deployed as a public-facing platform.
Challenge
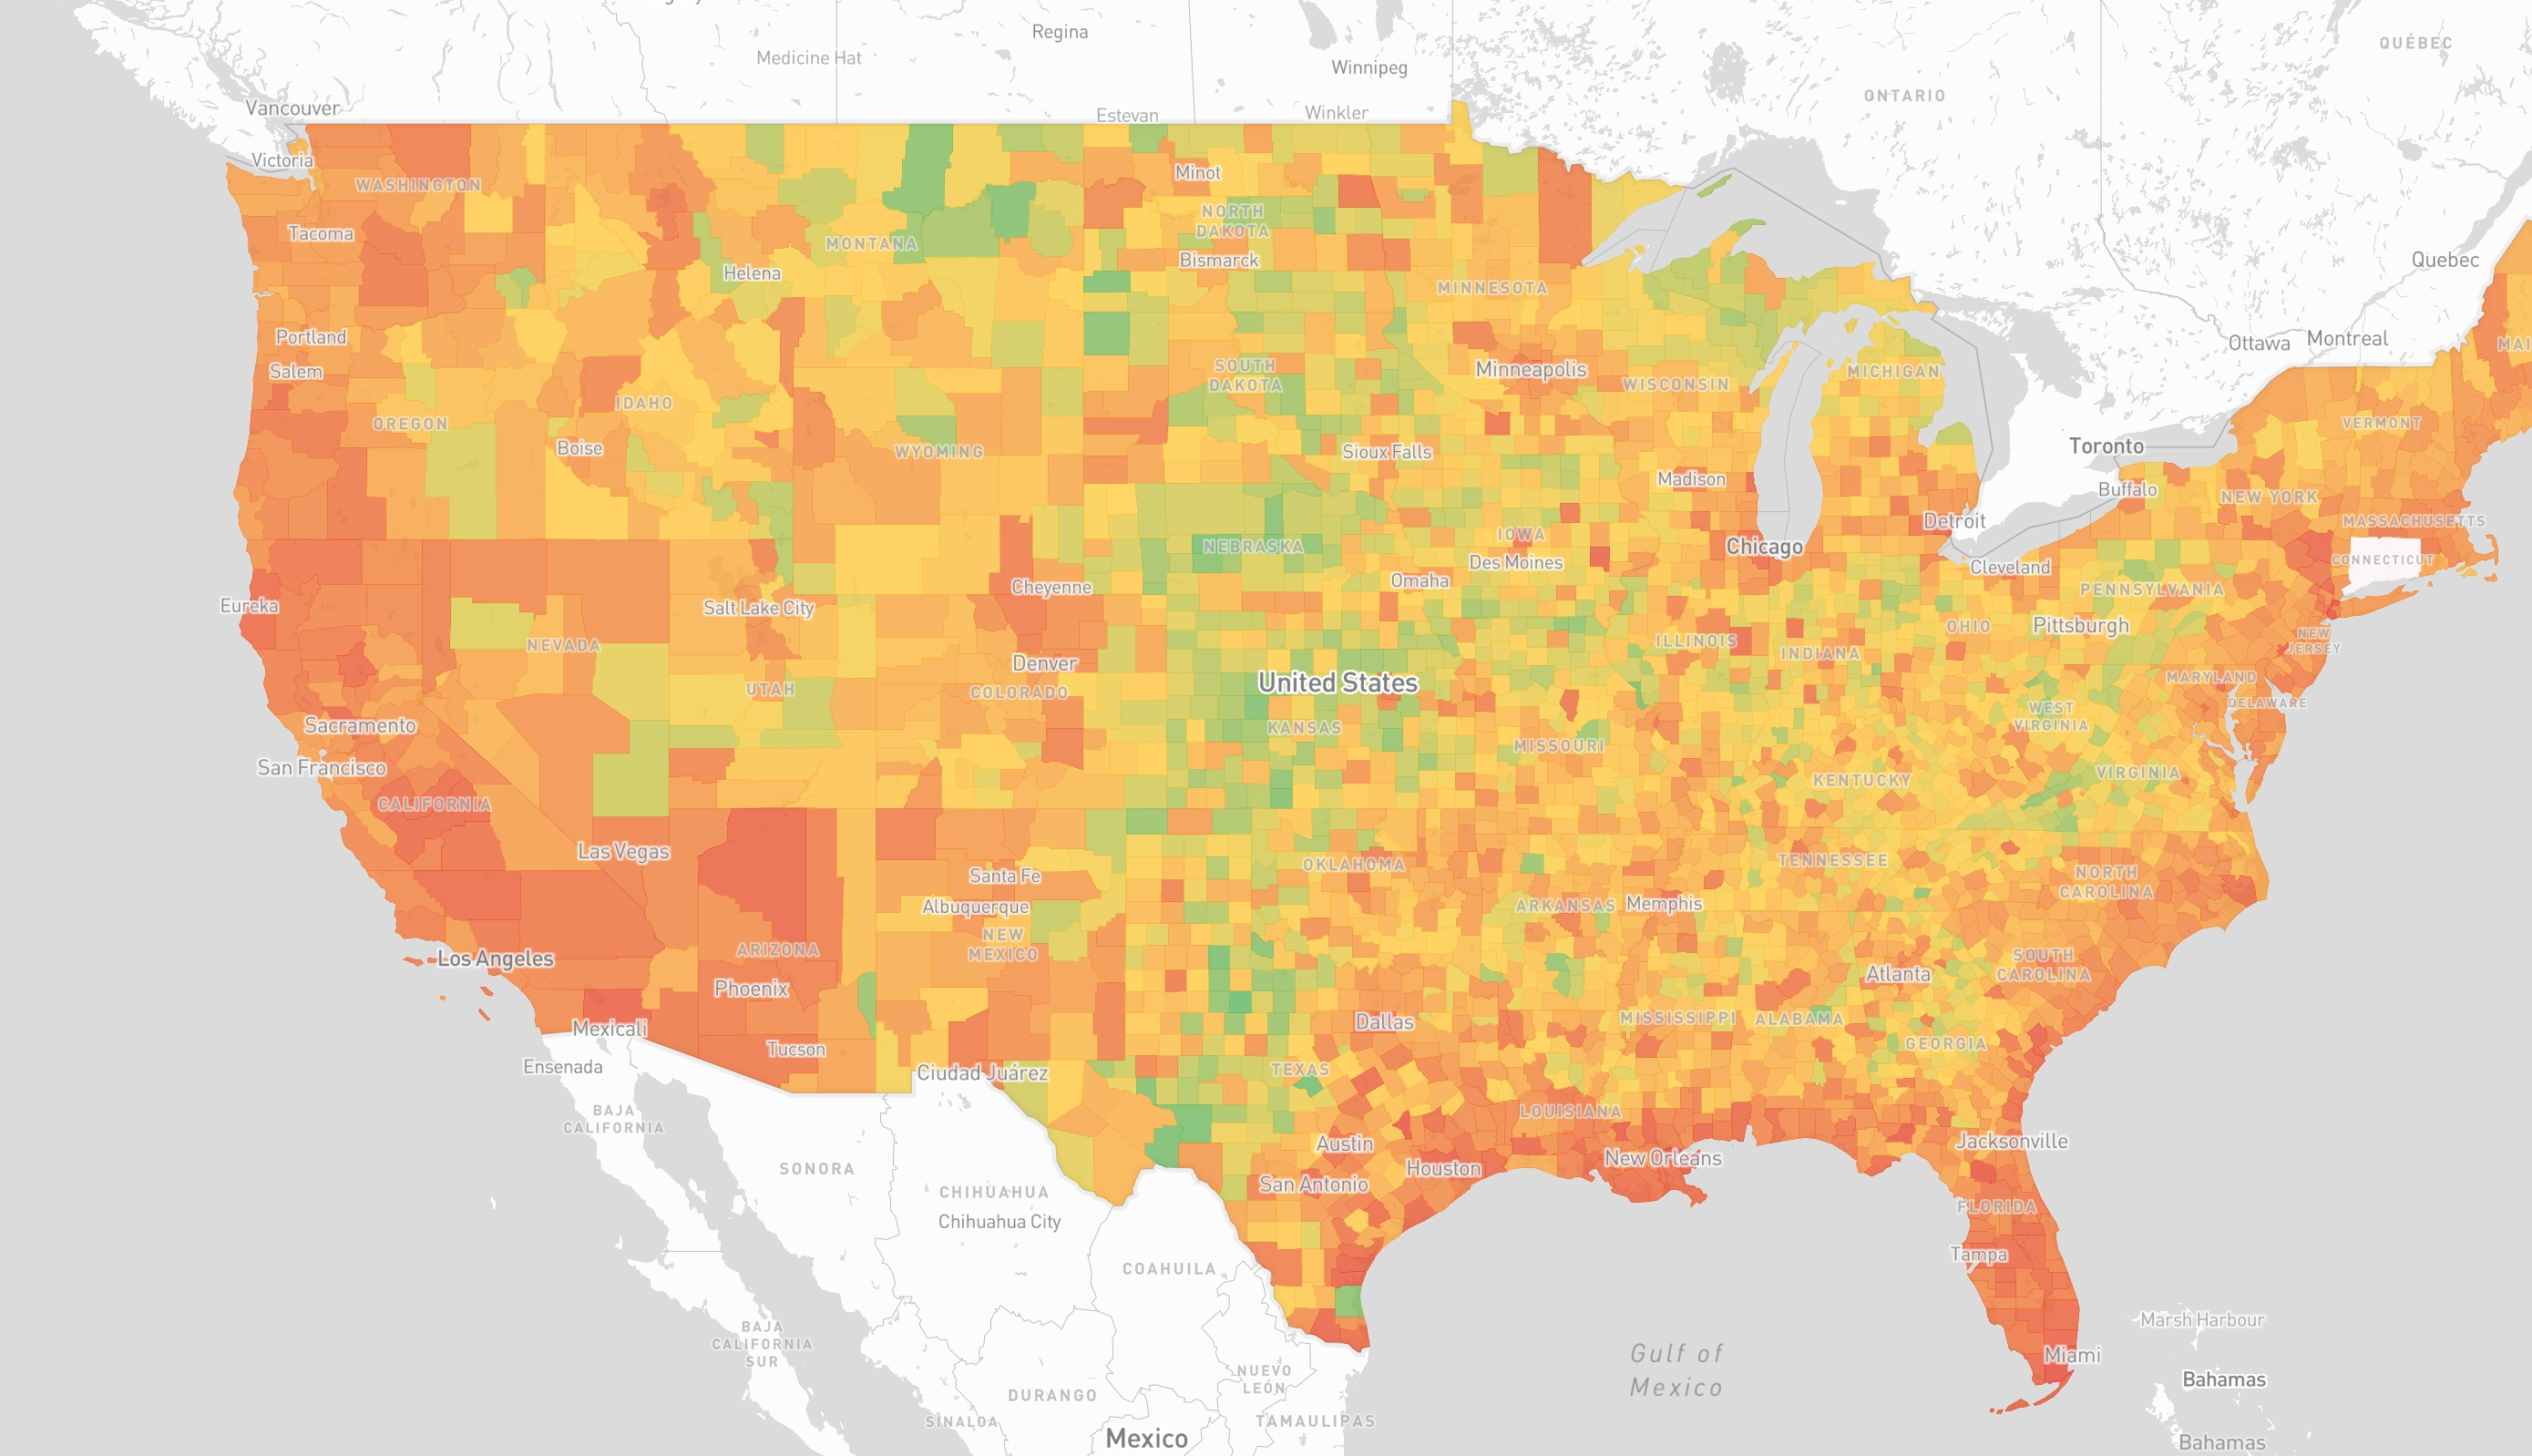
The underlying indicators were supplied by the project team, but they had to be transformed into a reliable geographic structure that could drive a responsive web application. County records needed to be matched to geographic boundaries, inconsistencies and missing matches had to be identified, and geographic identifiers had to remain stable across map interaction, search, comparison, and ranking. The system also had to support personalized decision-making rather than a fixed thematic map, requiring the interface and processing logic to recalculate results from each user's priorities.
Solution
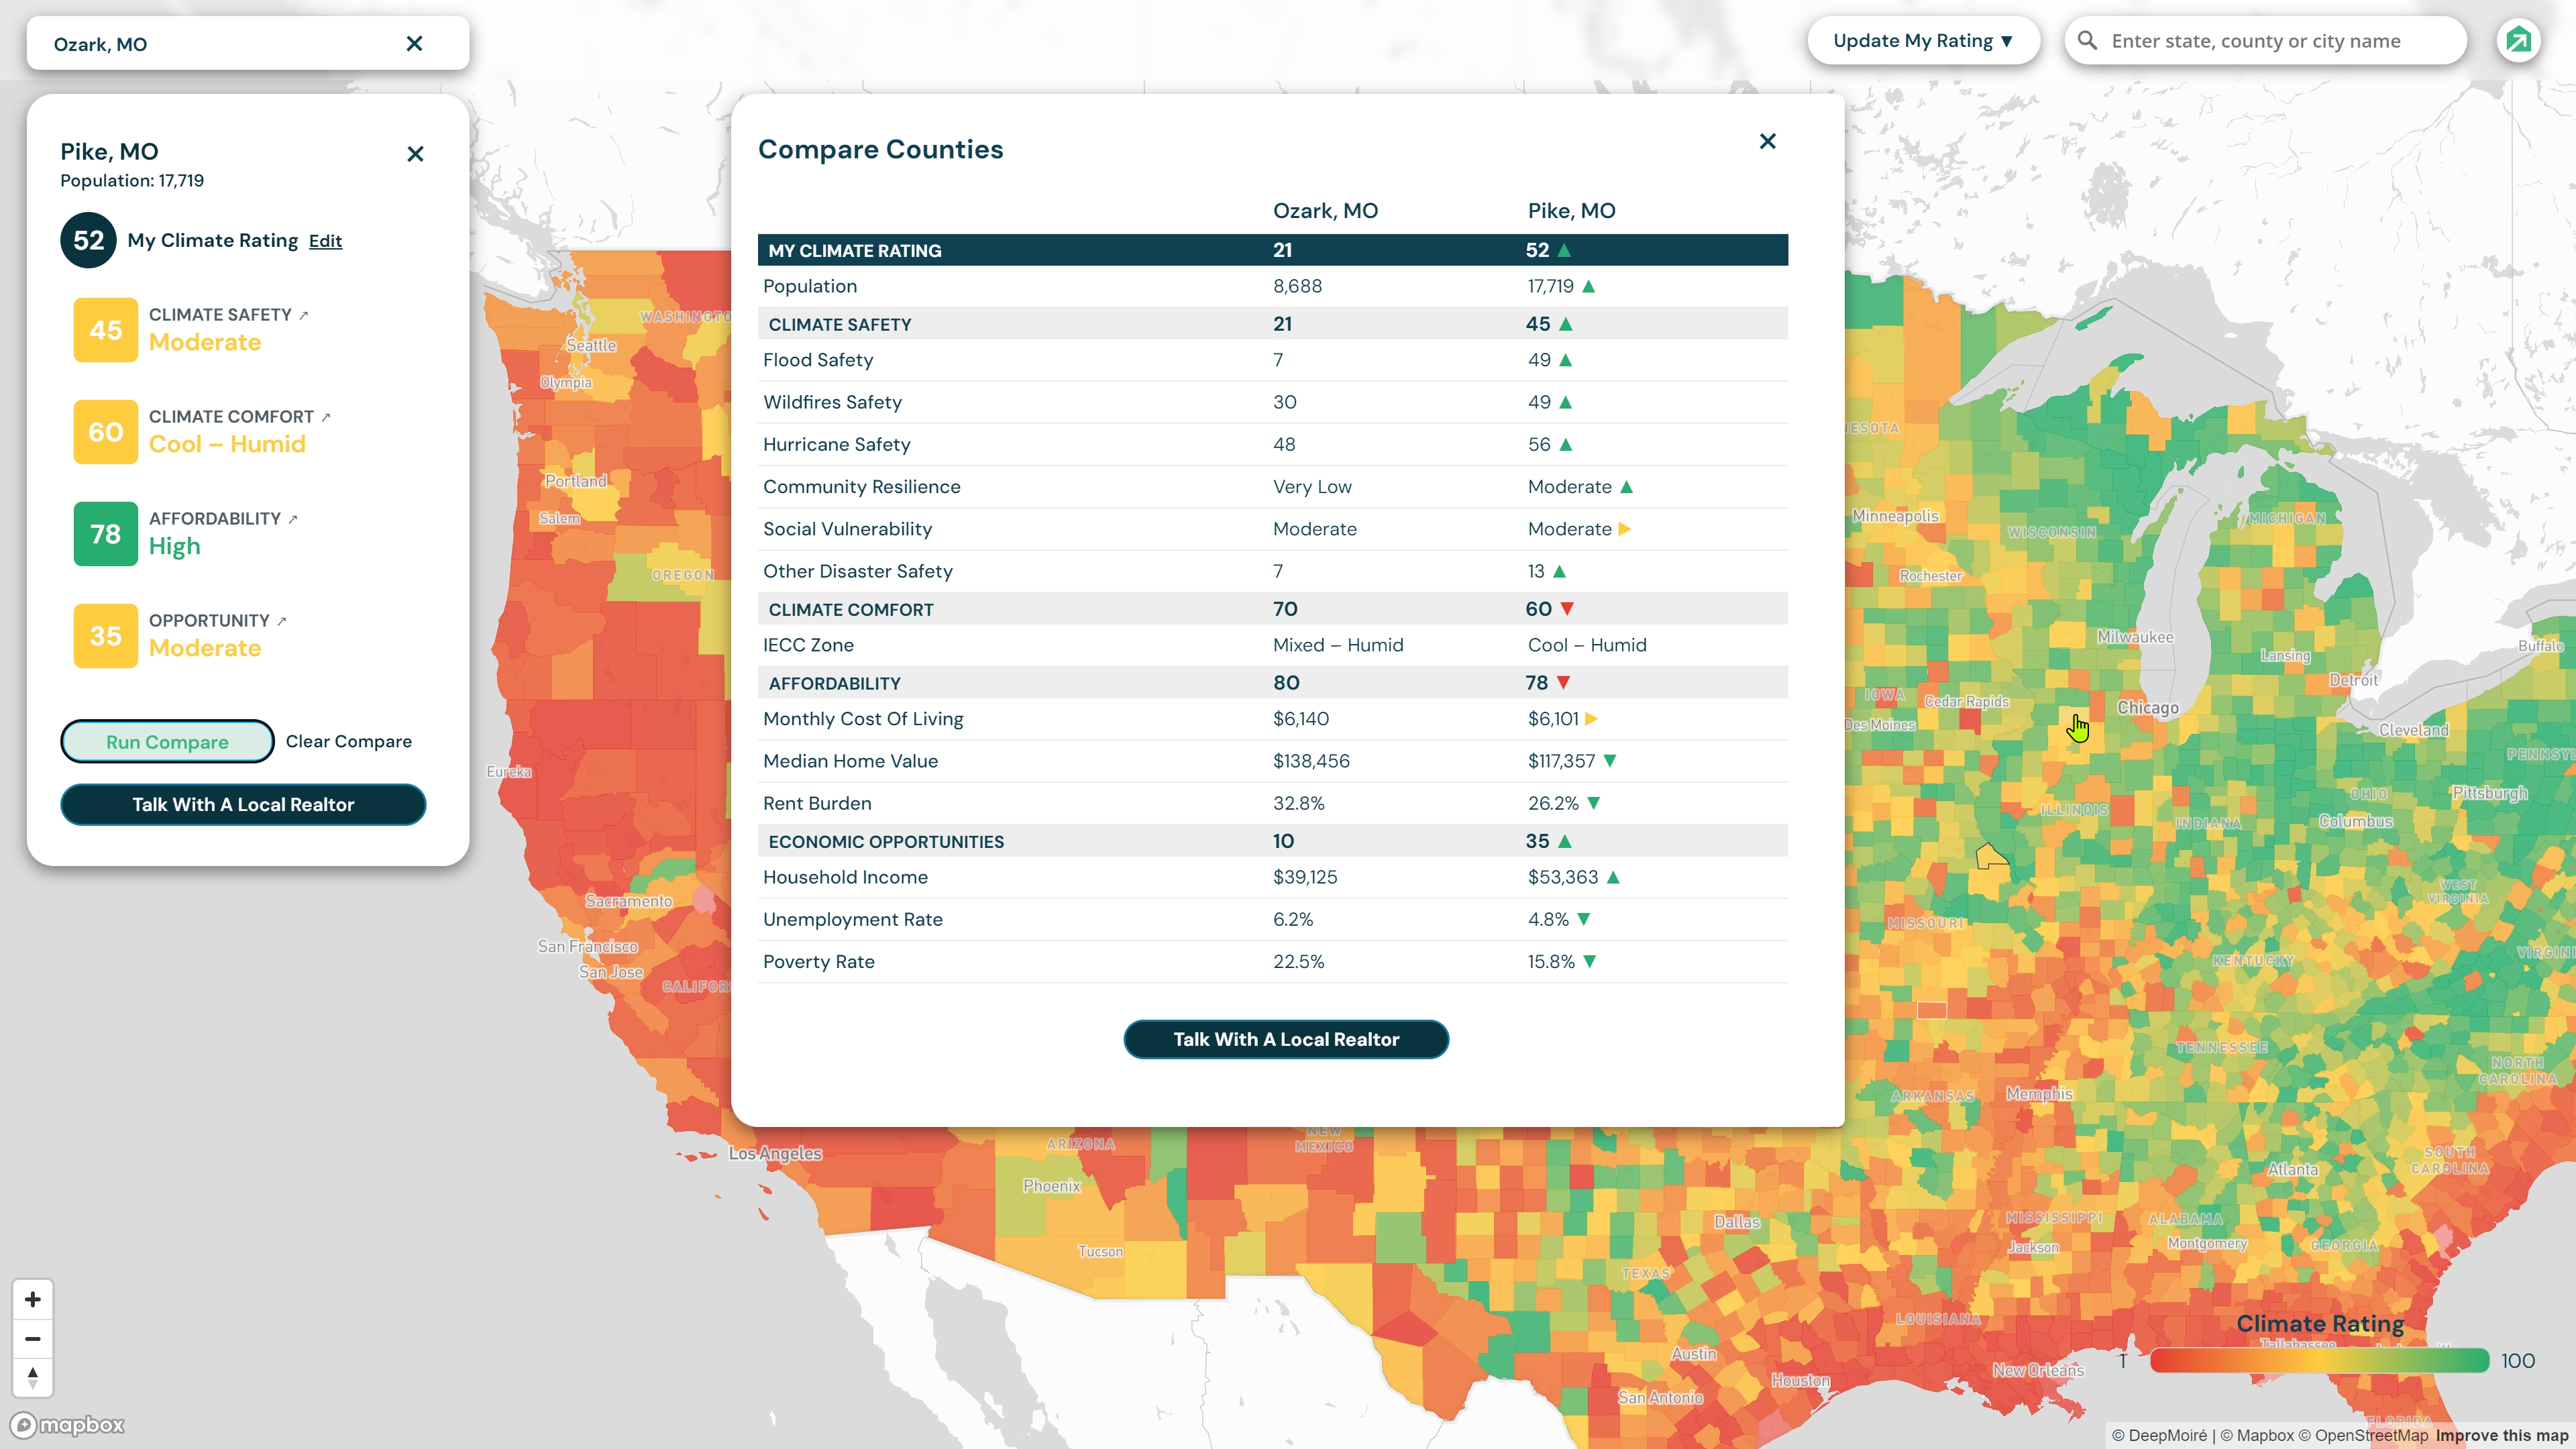
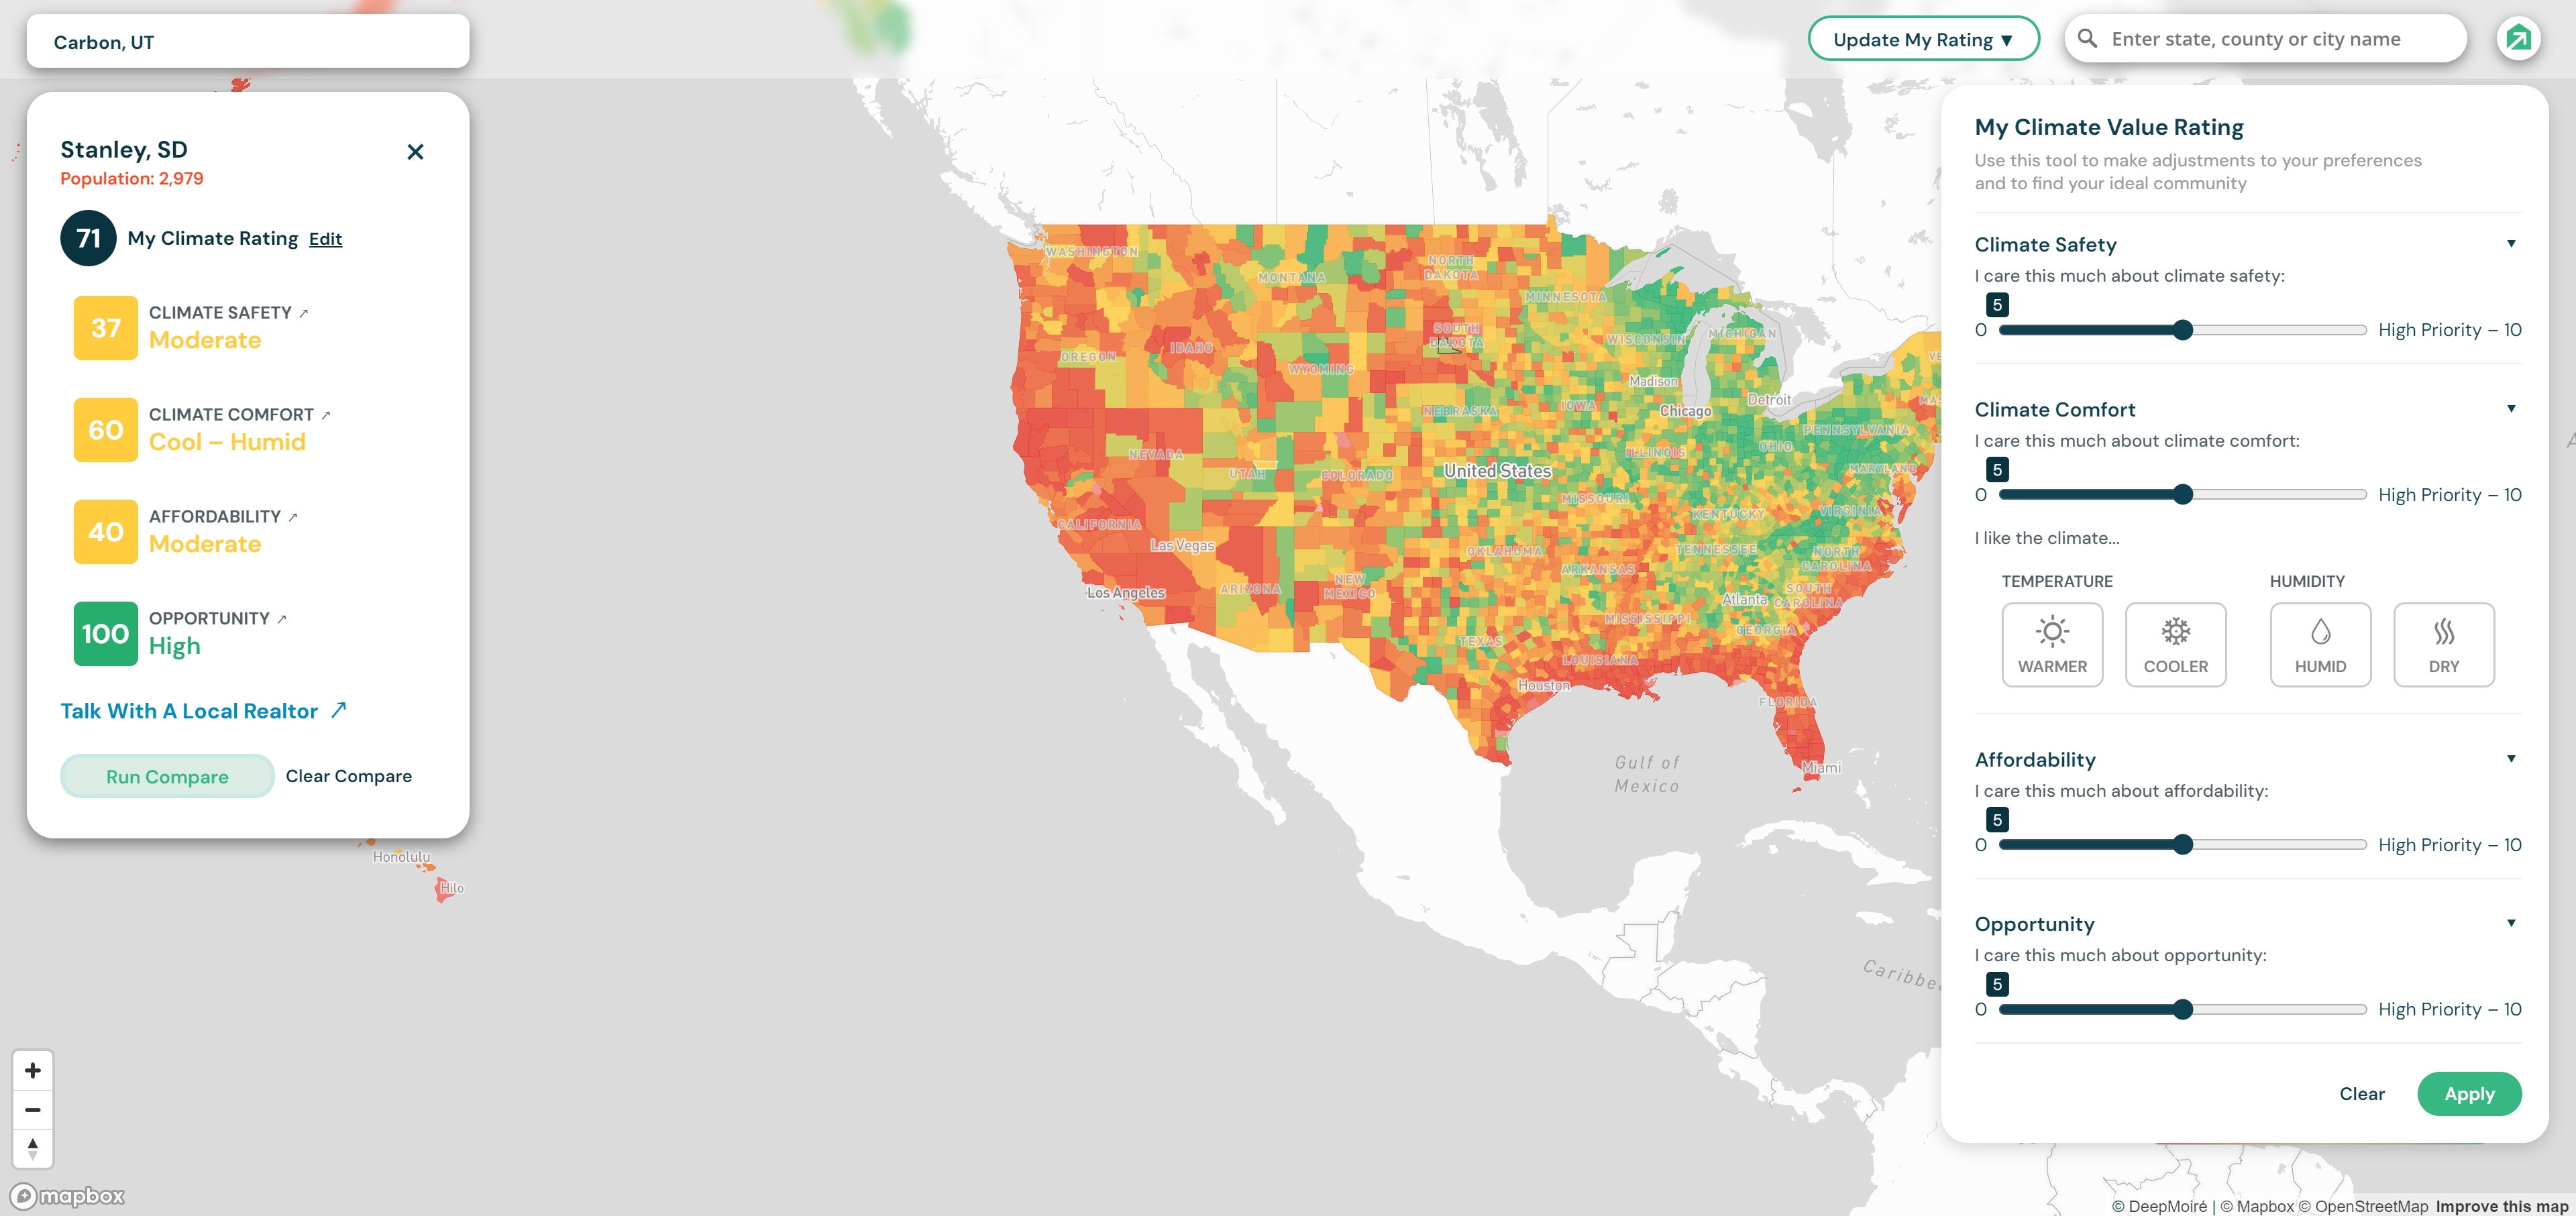
The finished application uses an interactive US county map as the main navigation and visualization layer. Selecting a county opens a structured information interface containing its personalized rating together with climate safety, climate comfort, affordability, economic opportunity, population, and supporting indicators. Users can search by state, county, or city, with city searches resolved back to the corresponding county; compare counties side by side; adjust the importance assigned to the main scoring categories; apply climate preferences; and generate updated rankings directly on the map. The platform also includes ranking and filtering tools, shareable county views, a personalized Top 25 workflow, and automated email delivery of selected results.
Design & Data Visualization
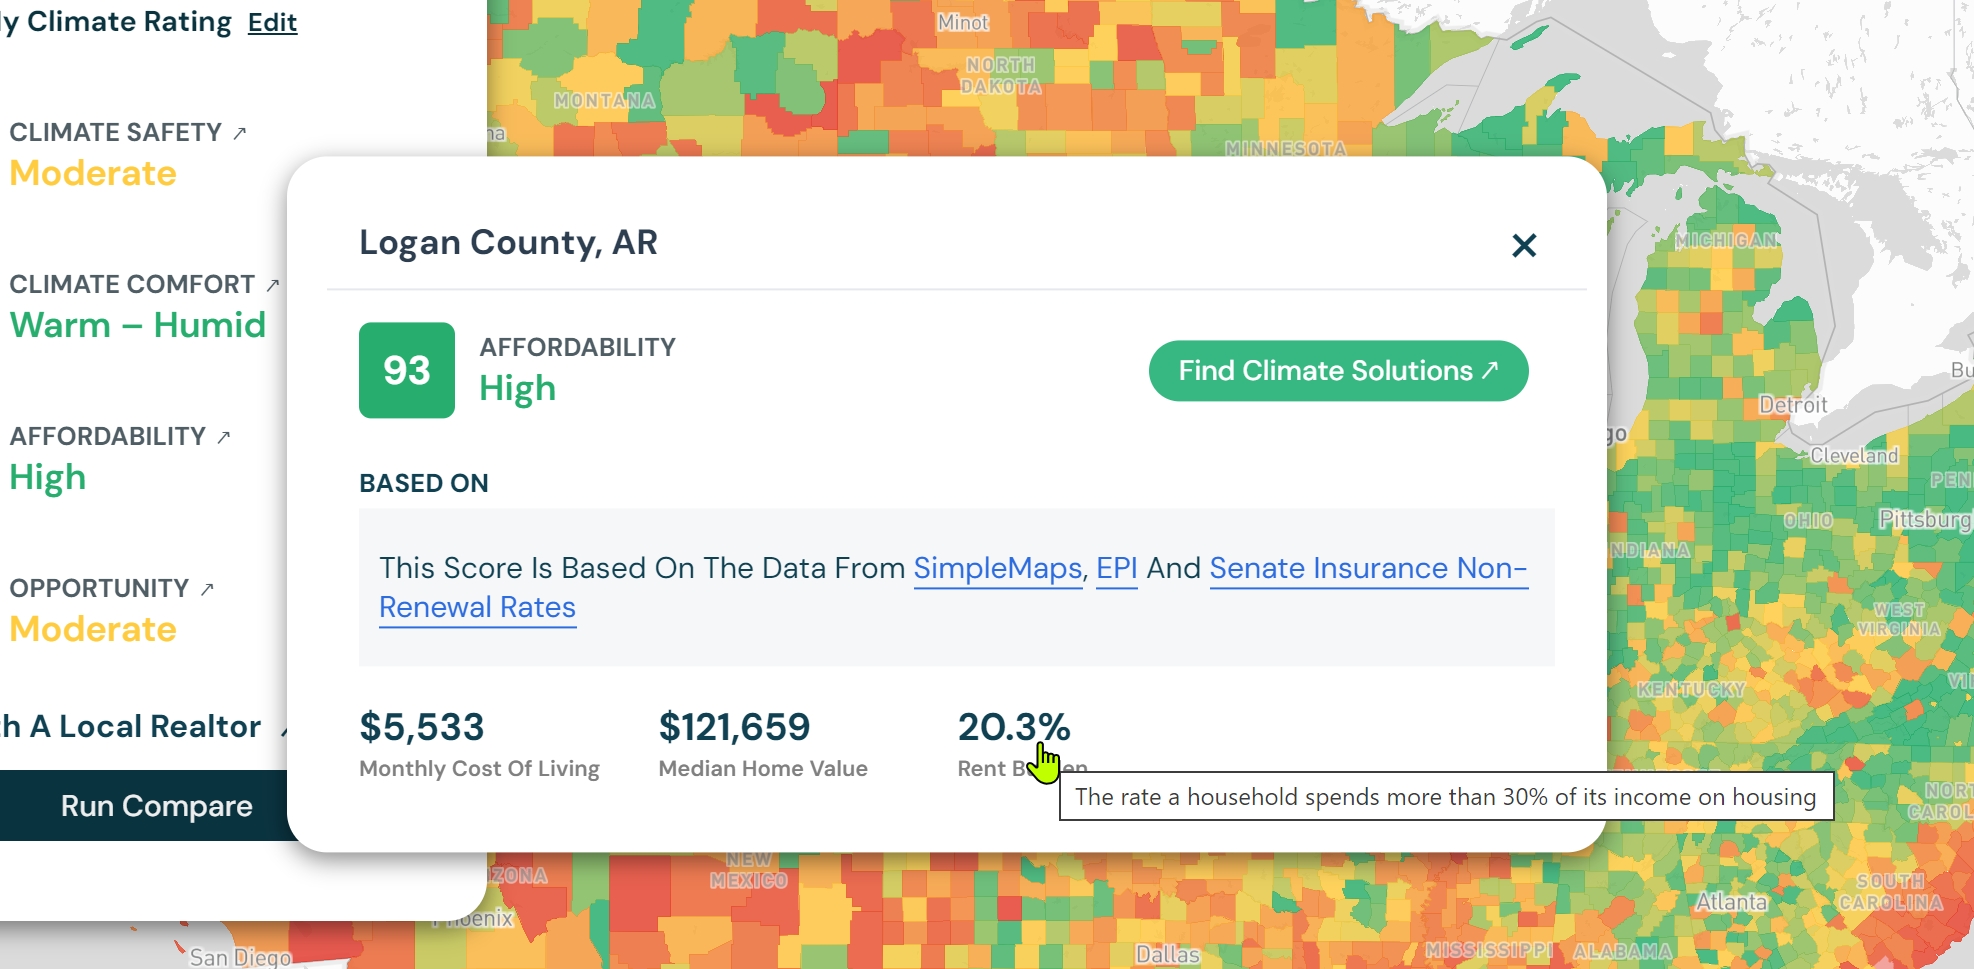
The interface was developed through an integrated design-and-development process with the project team, so interaction patterns and visual components were shaped together with their technical behavior. The map provides the geographic overview, county cards expose the principal indicators, expandable panels reveal more detailed values, and the customization interface groups user preferences into a clear hierarchy. The later development phase refined the visual hierarchy, county cards, comparison workflow, scoring conventions, and cartographic treatment while keeping the map, controls, and data model synchronized.
Technical Approach
The application was implemented primarily in JavaScript with Mapbox GL JS for the interactive map and Mapbox Geocoder for geographic search. County geometry is loaded as GeoJSON and combined at runtime with the supplied CSV dataset. Search and map-selection workflows are connected to the same county-level data model so geographic navigation, information panels, comparison, and ranking remain synchronized. The processed GeoJSON is updated when user preferences change and reused as the basis for visualization, selection, and comparison. EmailJS was integrated for automated delivery of personalized Top 25 results.
Technologies
- Mapbox GL JS
- Mapbox Geocoder
- JavaScript
- HTML/CSS
- GeoJSON
- CSV
- EmailJS
Data Workflow
County GeoJSON geometries are matched with the supplied tabular data through FIPS identifiers, with identifier formatting and state information normalized before the records are attached to geographic features. The personalized rating is calculated in the browser from user-defined weights across climate safety, climate comfort, affordability, and opportunity, while selected climate preferences can modify the comfort component. The resulting scores are converted into percentile-based rankings across the county dataset, then written back to the geographic data so the map and Top 25 results update dynamically from the active configuration.
Outcome
The deployed system turns a large county-level dataset into an interactive location-evaluation platform rather than a static climate map. Users can move from a national overview to individual counties, inspect underlying indicators, compare alternatives, change the criteria that matter to them, and obtain a geographic ranking recalculated around those preferences. The final application combines geographic visualization, data processing, personalized scoring, search, comparison, ranking, and result delivery within one web interface.