
Football analytics / automated match analysis
Automated Football Match Data Visualization Platform
Overview
I designed and developed an automated interactive data visualization platform for professional football match analysis. The system brought together spatial event data, player lineups, event classifications, temporal information, pass relationships, statistical charts, and live match feeds within one interface.
Rather than producing a visualization for a single game, the prototype became a reusable sports analytics system used across hundreds of matches. New raw inputs automatically regenerated the match-specific interface, controls, charts, heatmaps, and spatial visualizations.
Challenge
The source material consisted of several related but structurally different datasets, including match events with pitch coordinates and timestamps, event and sub-event classifications, team lineups, player information, pass matrices, match results, and XML data updated while a game was in progress.
A representative match contained 1,756 individual events, while the supporting classification files contained 68 event types and 184 sub-event definitions. These records had to be connected through different identifiers and translated into visual forms appropriate to each type of information.
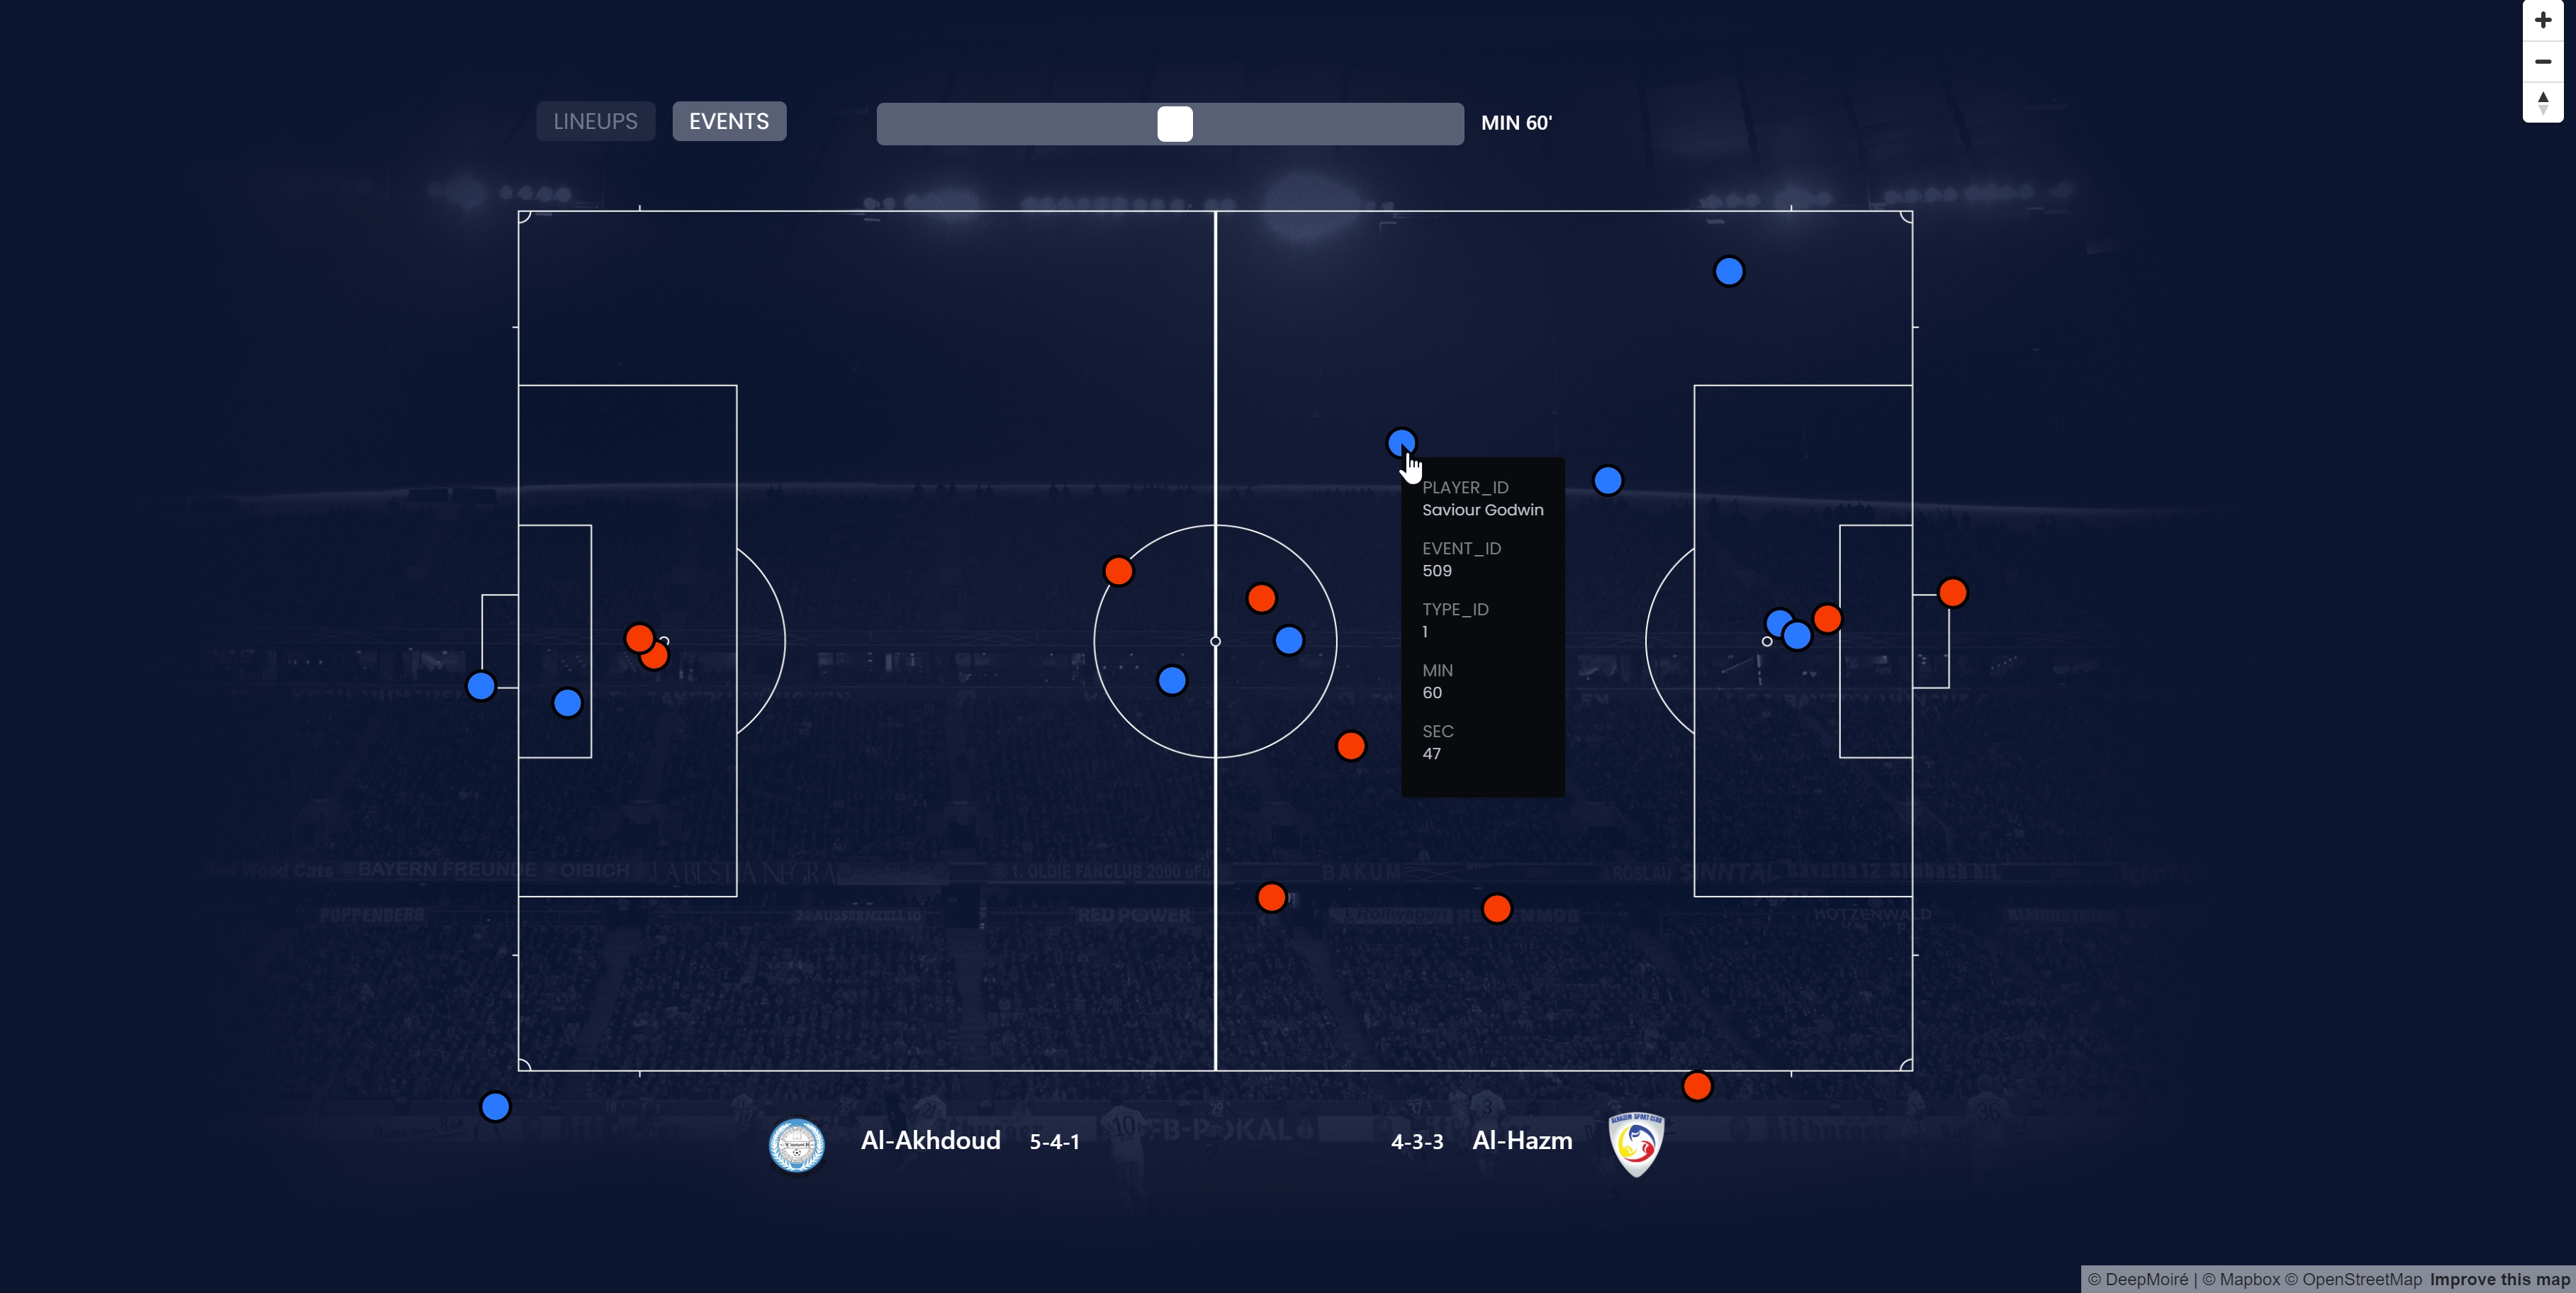
The data also contained inconsistencies that could not be resolved through direct plotting alone. Card-booking records, for example, contained zero coordinates because their location was determined by the preceding foul. The system therefore needed contextual processing rules capable of reconstructing the correct position from the event sequence.
The interface had to support both explanatory and exploratory data visualization: it needed to communicate the overall structure of a match while allowing analysts to investigate individual events, time ranges, pitch areas, players, teams, and relationships between variables.
Solution
The finished football analytics platform organized multiple visualization formats around a shared interactive interface.
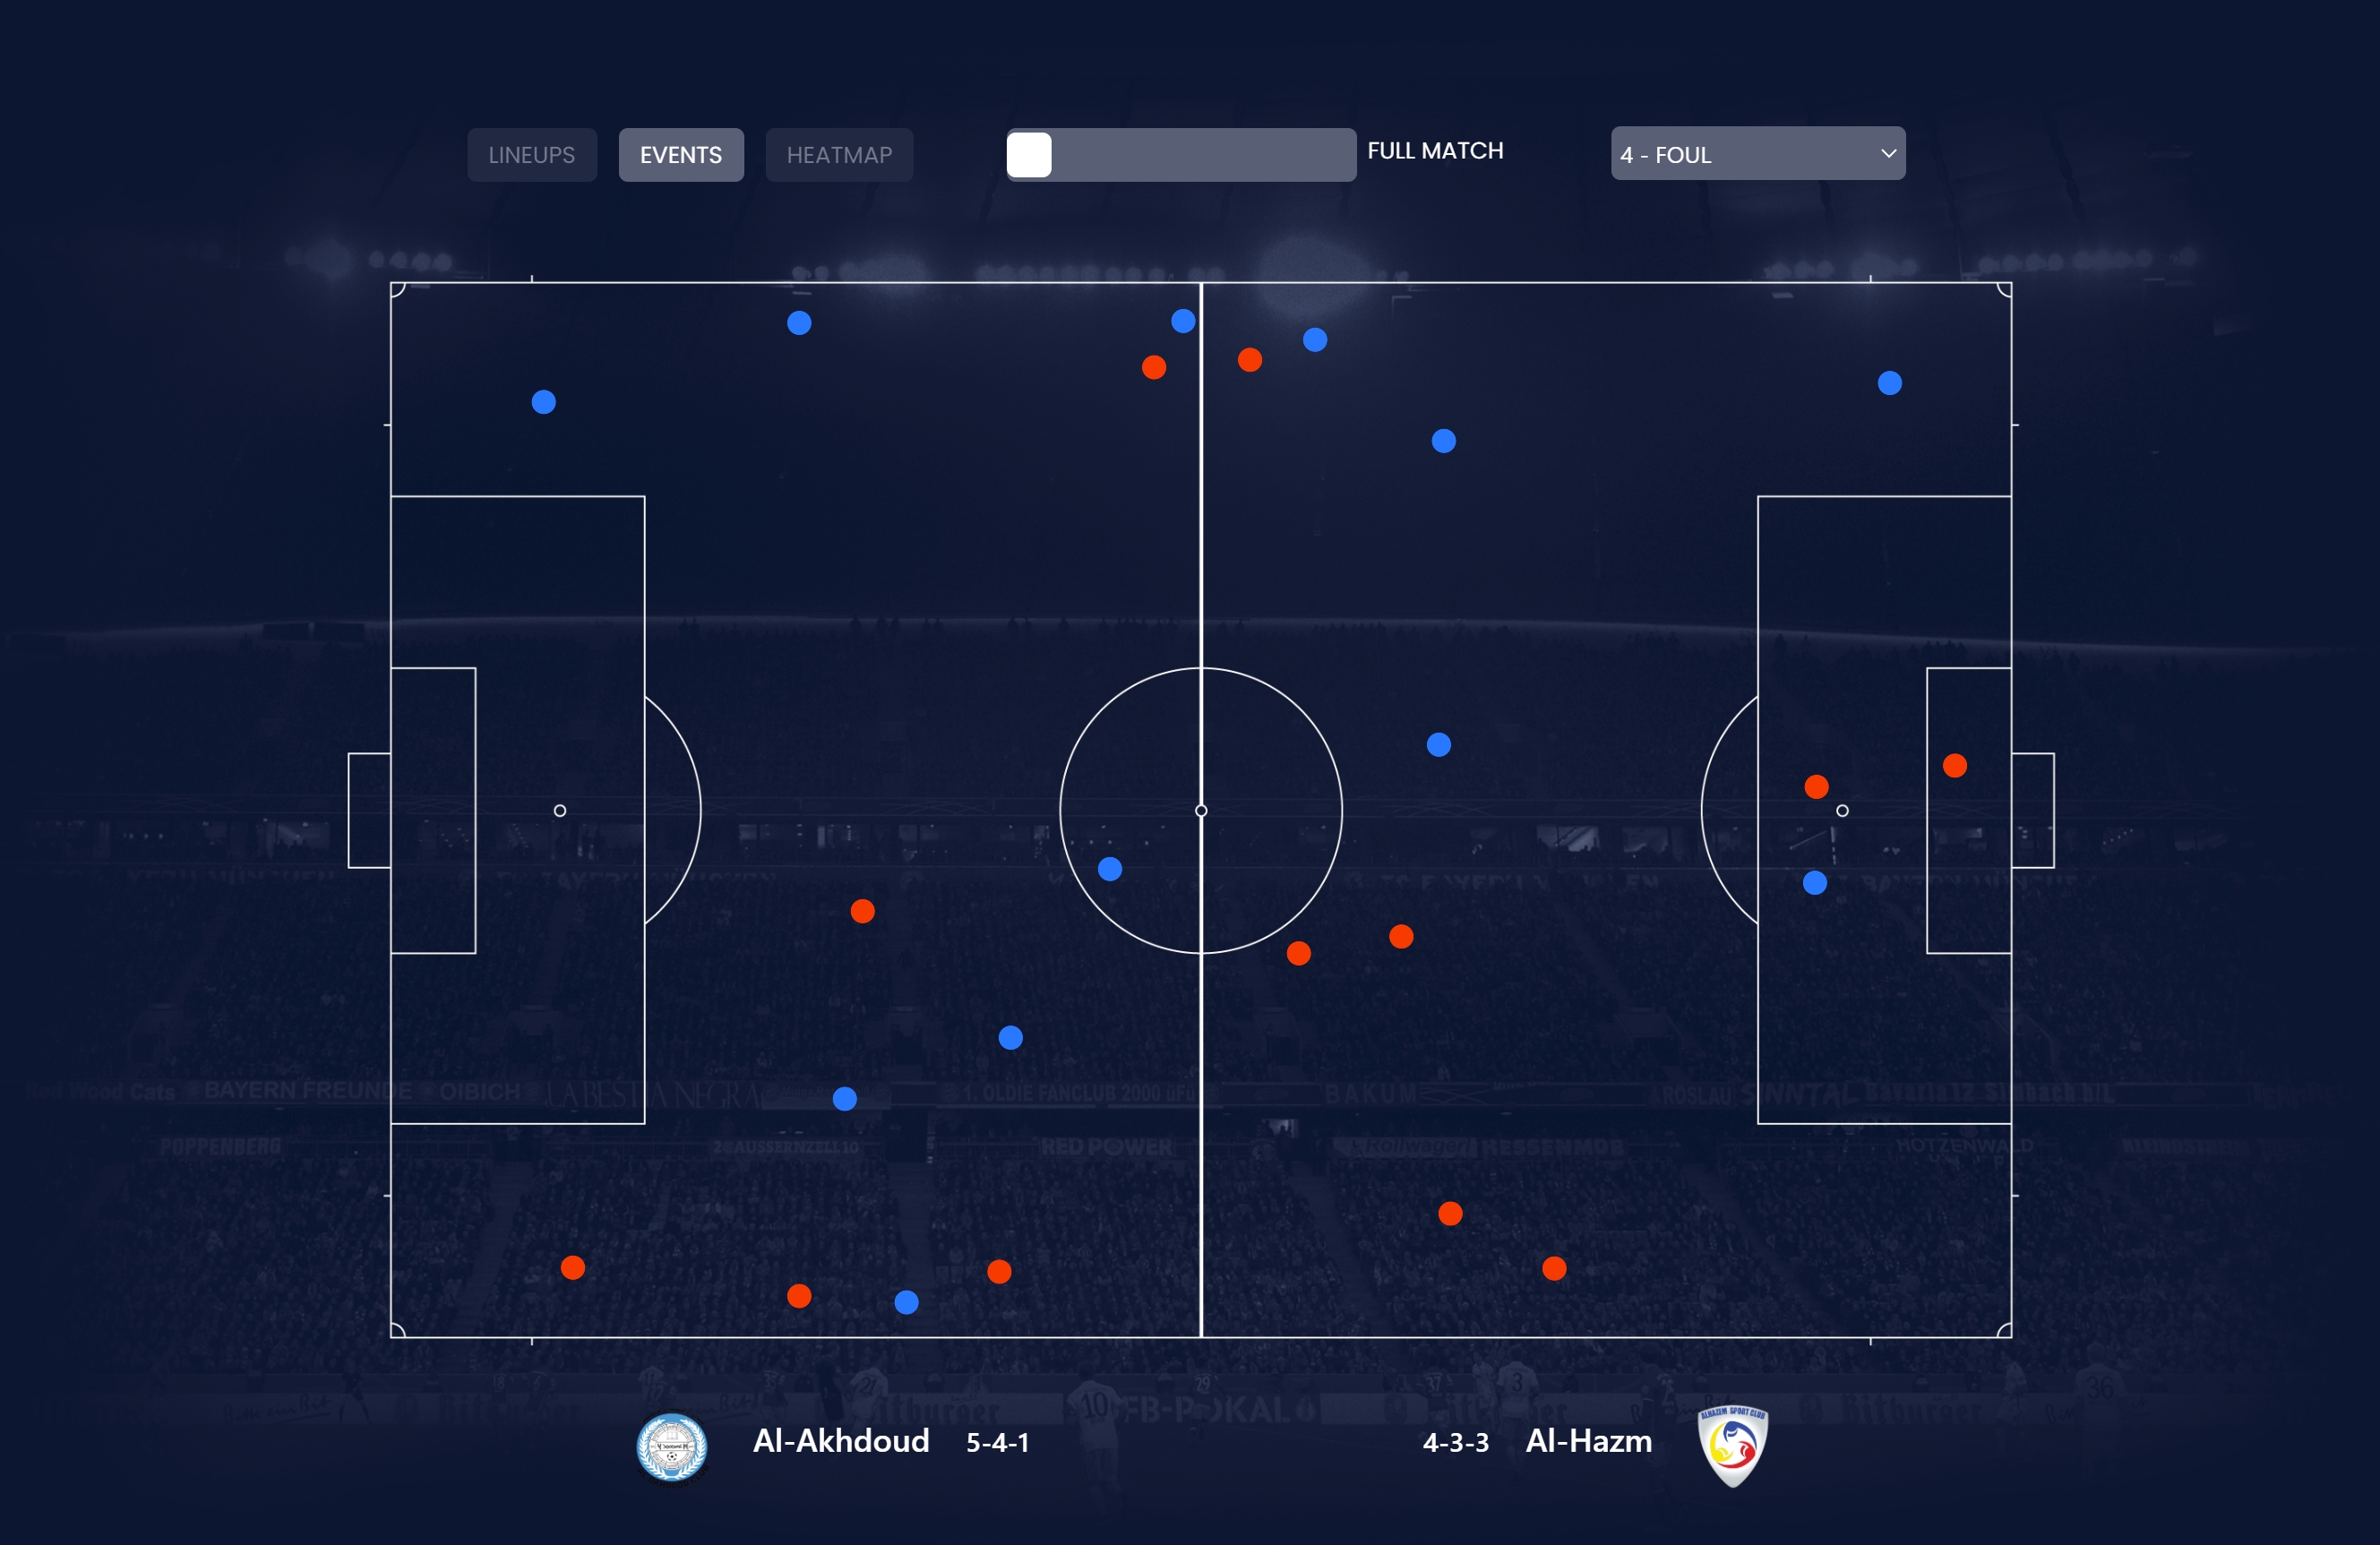
A lineup view reconstructed both teams on the pitch using formation data, player positions, names, and shirt numbers. An event view plotted match actions according to their recorded coordinates and distinguished the two teams visually. Users could filter actions by event and sub-event type, move through the match minute by minute, or inspect the complete game.
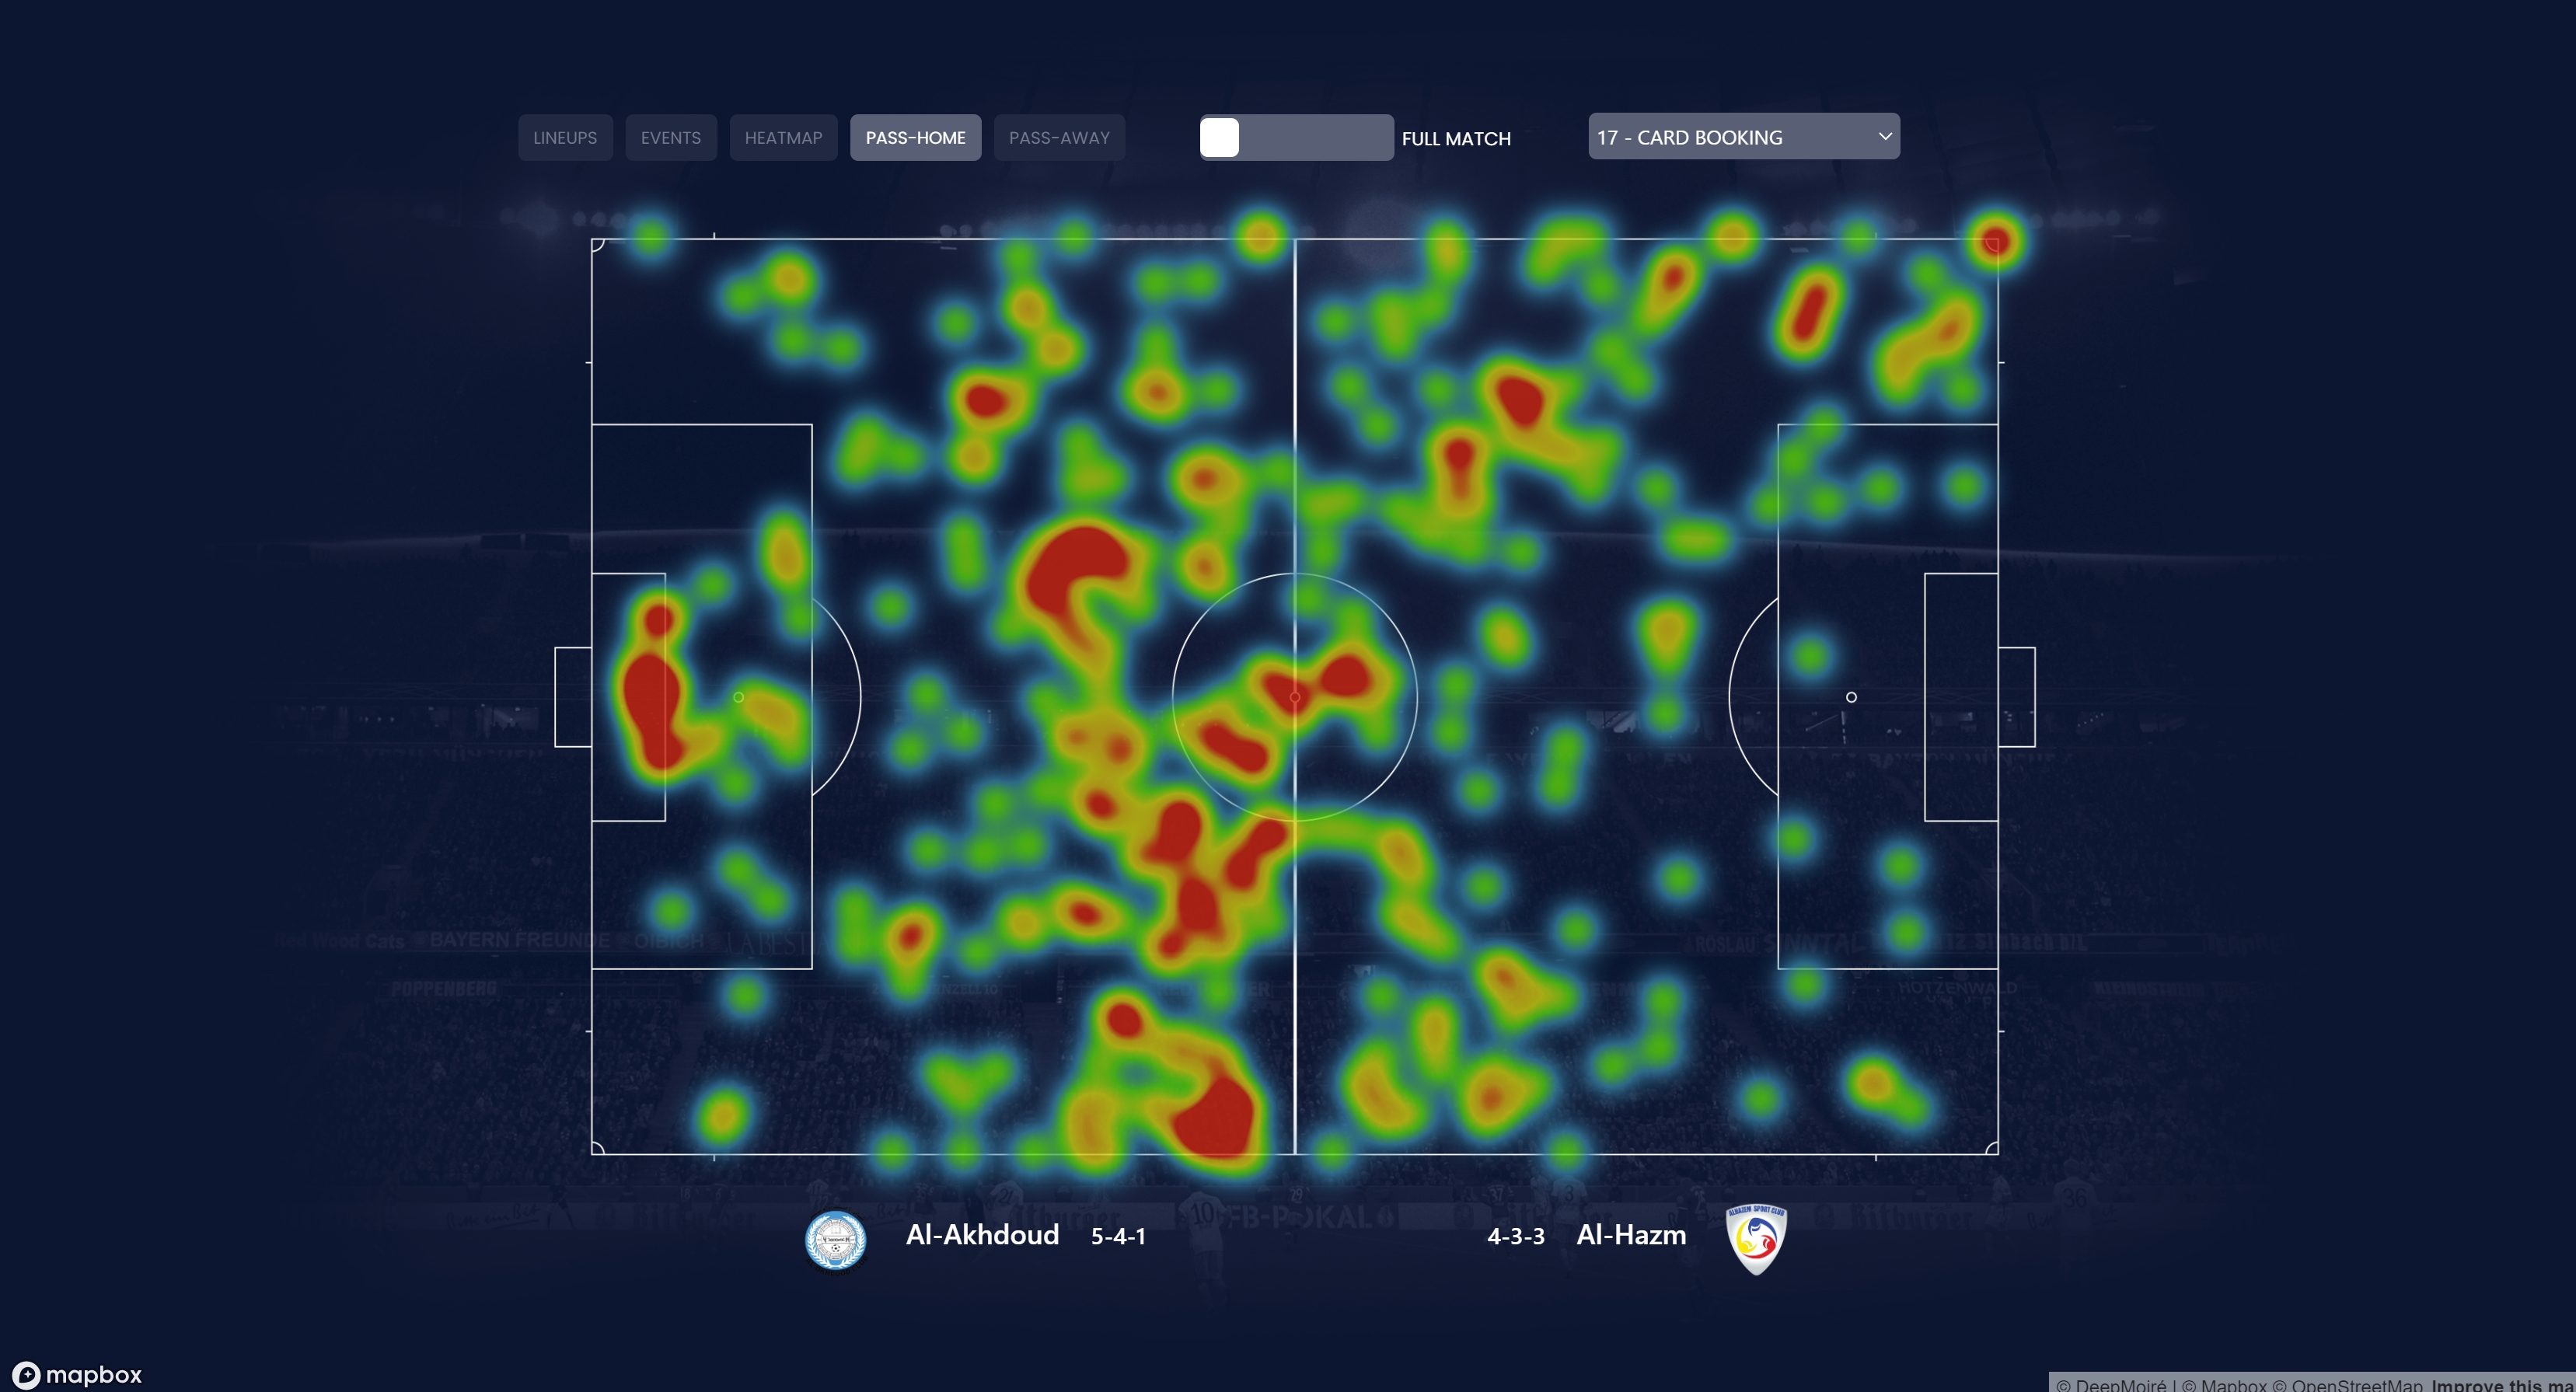
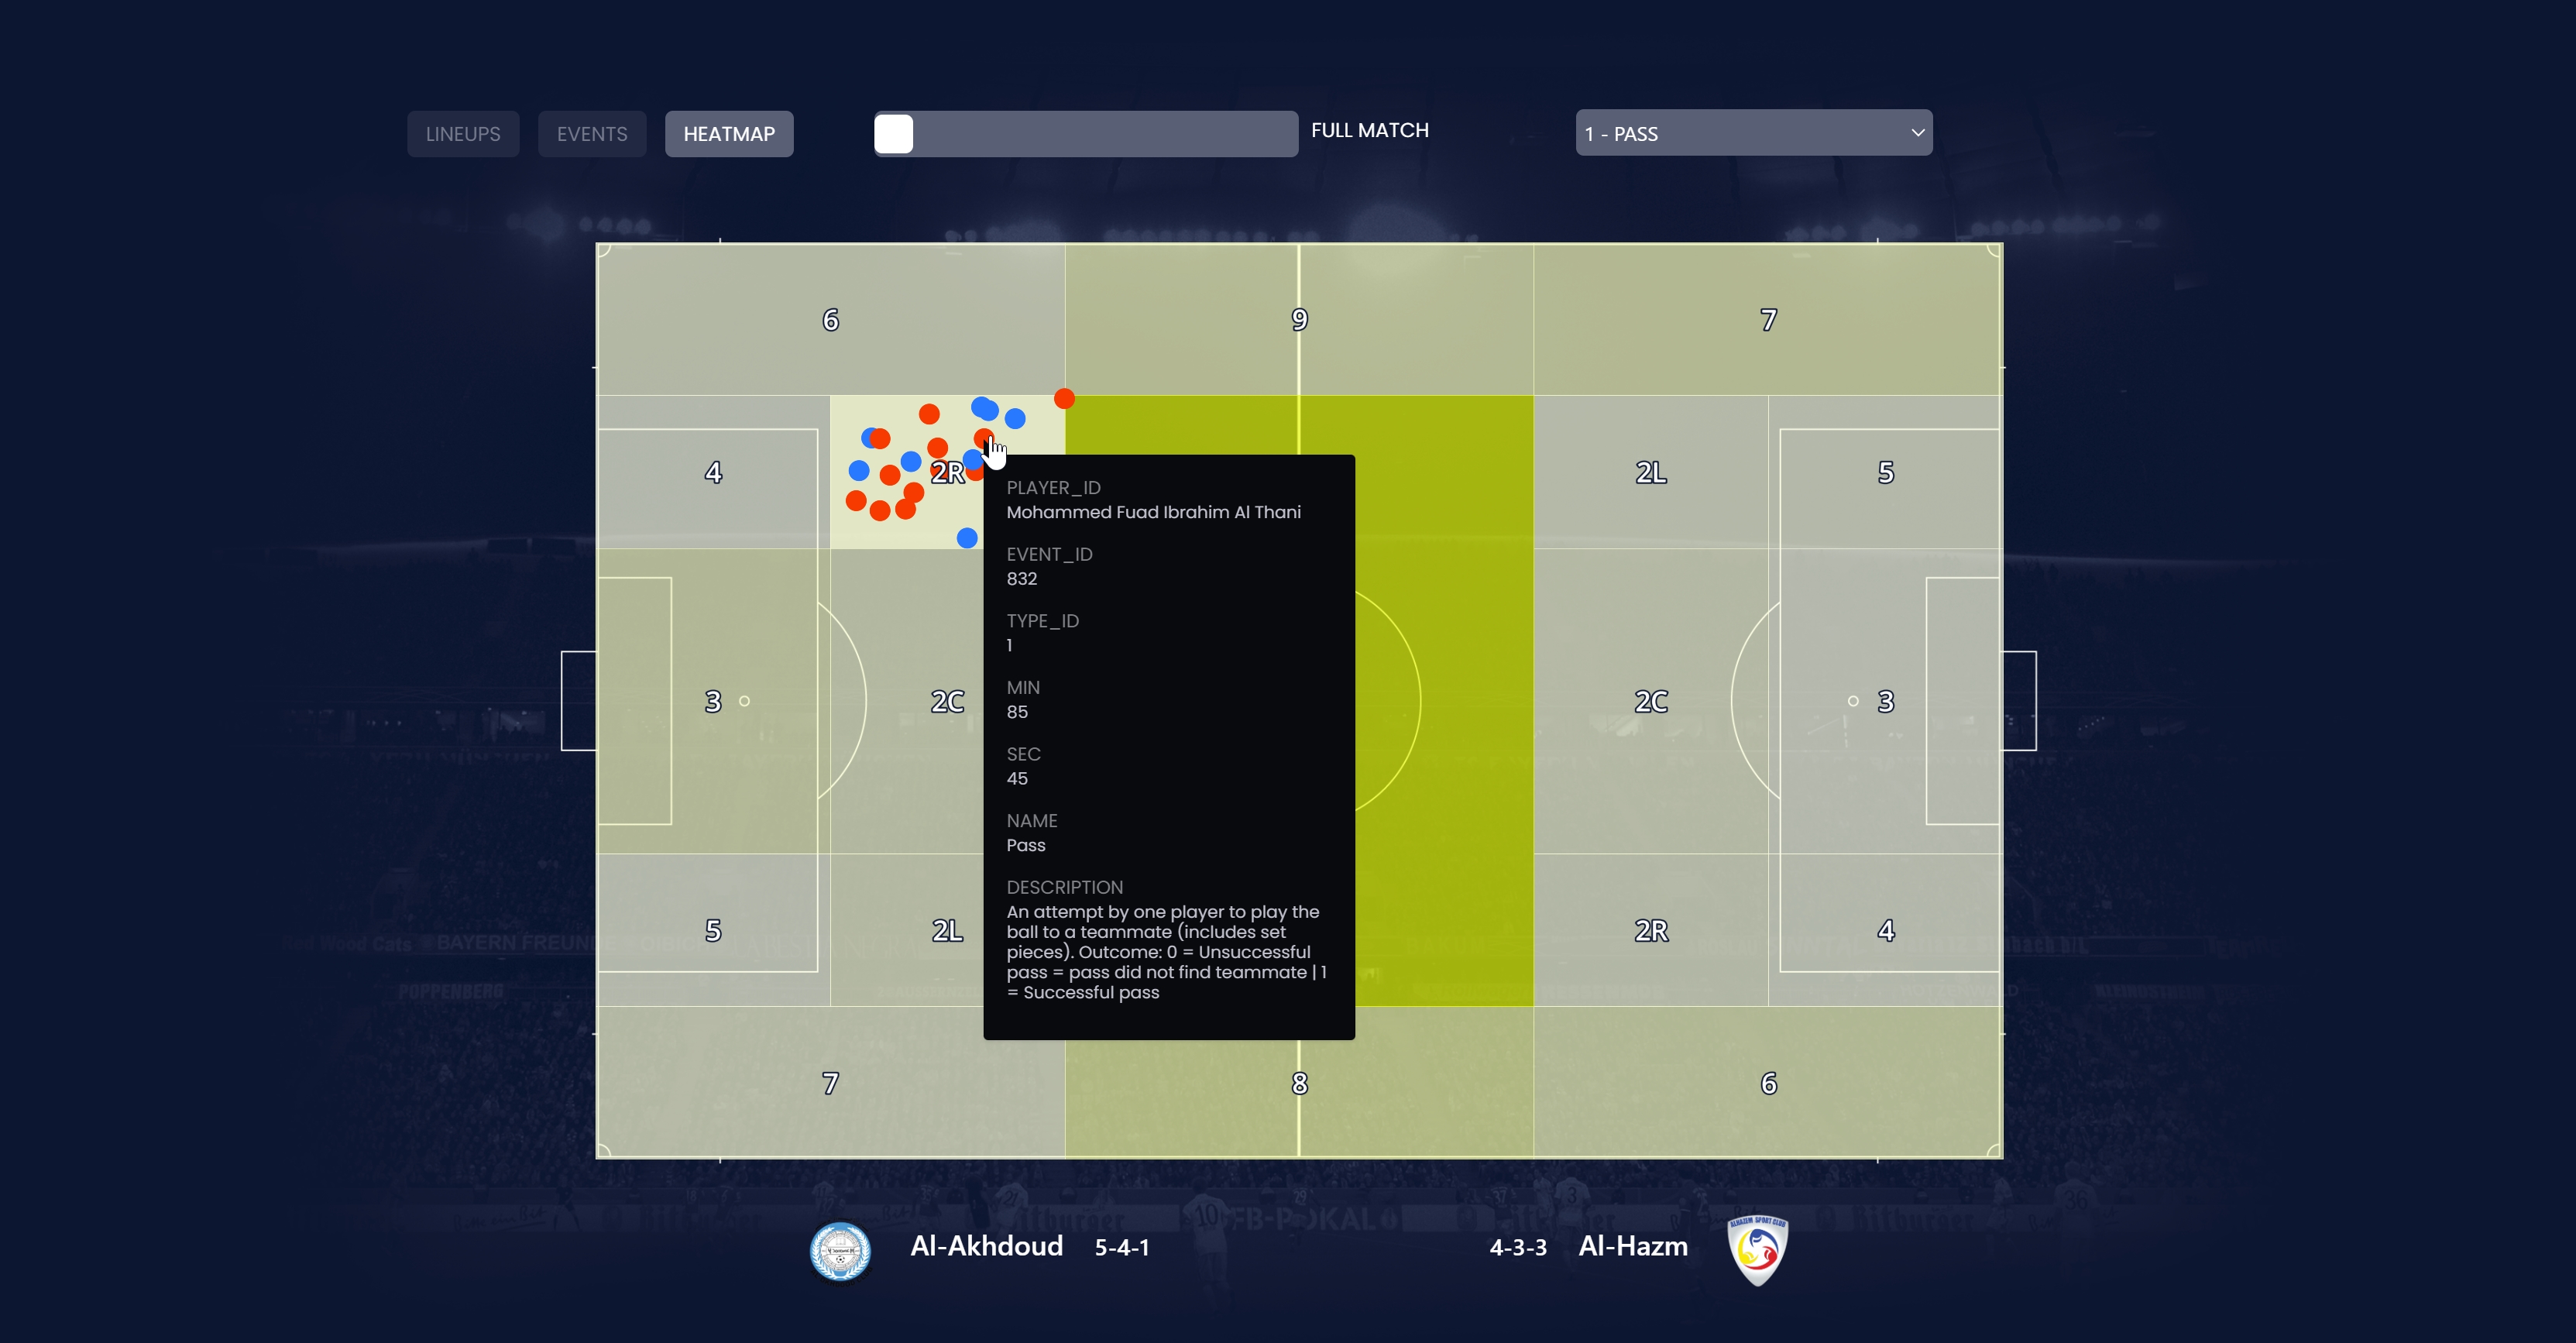
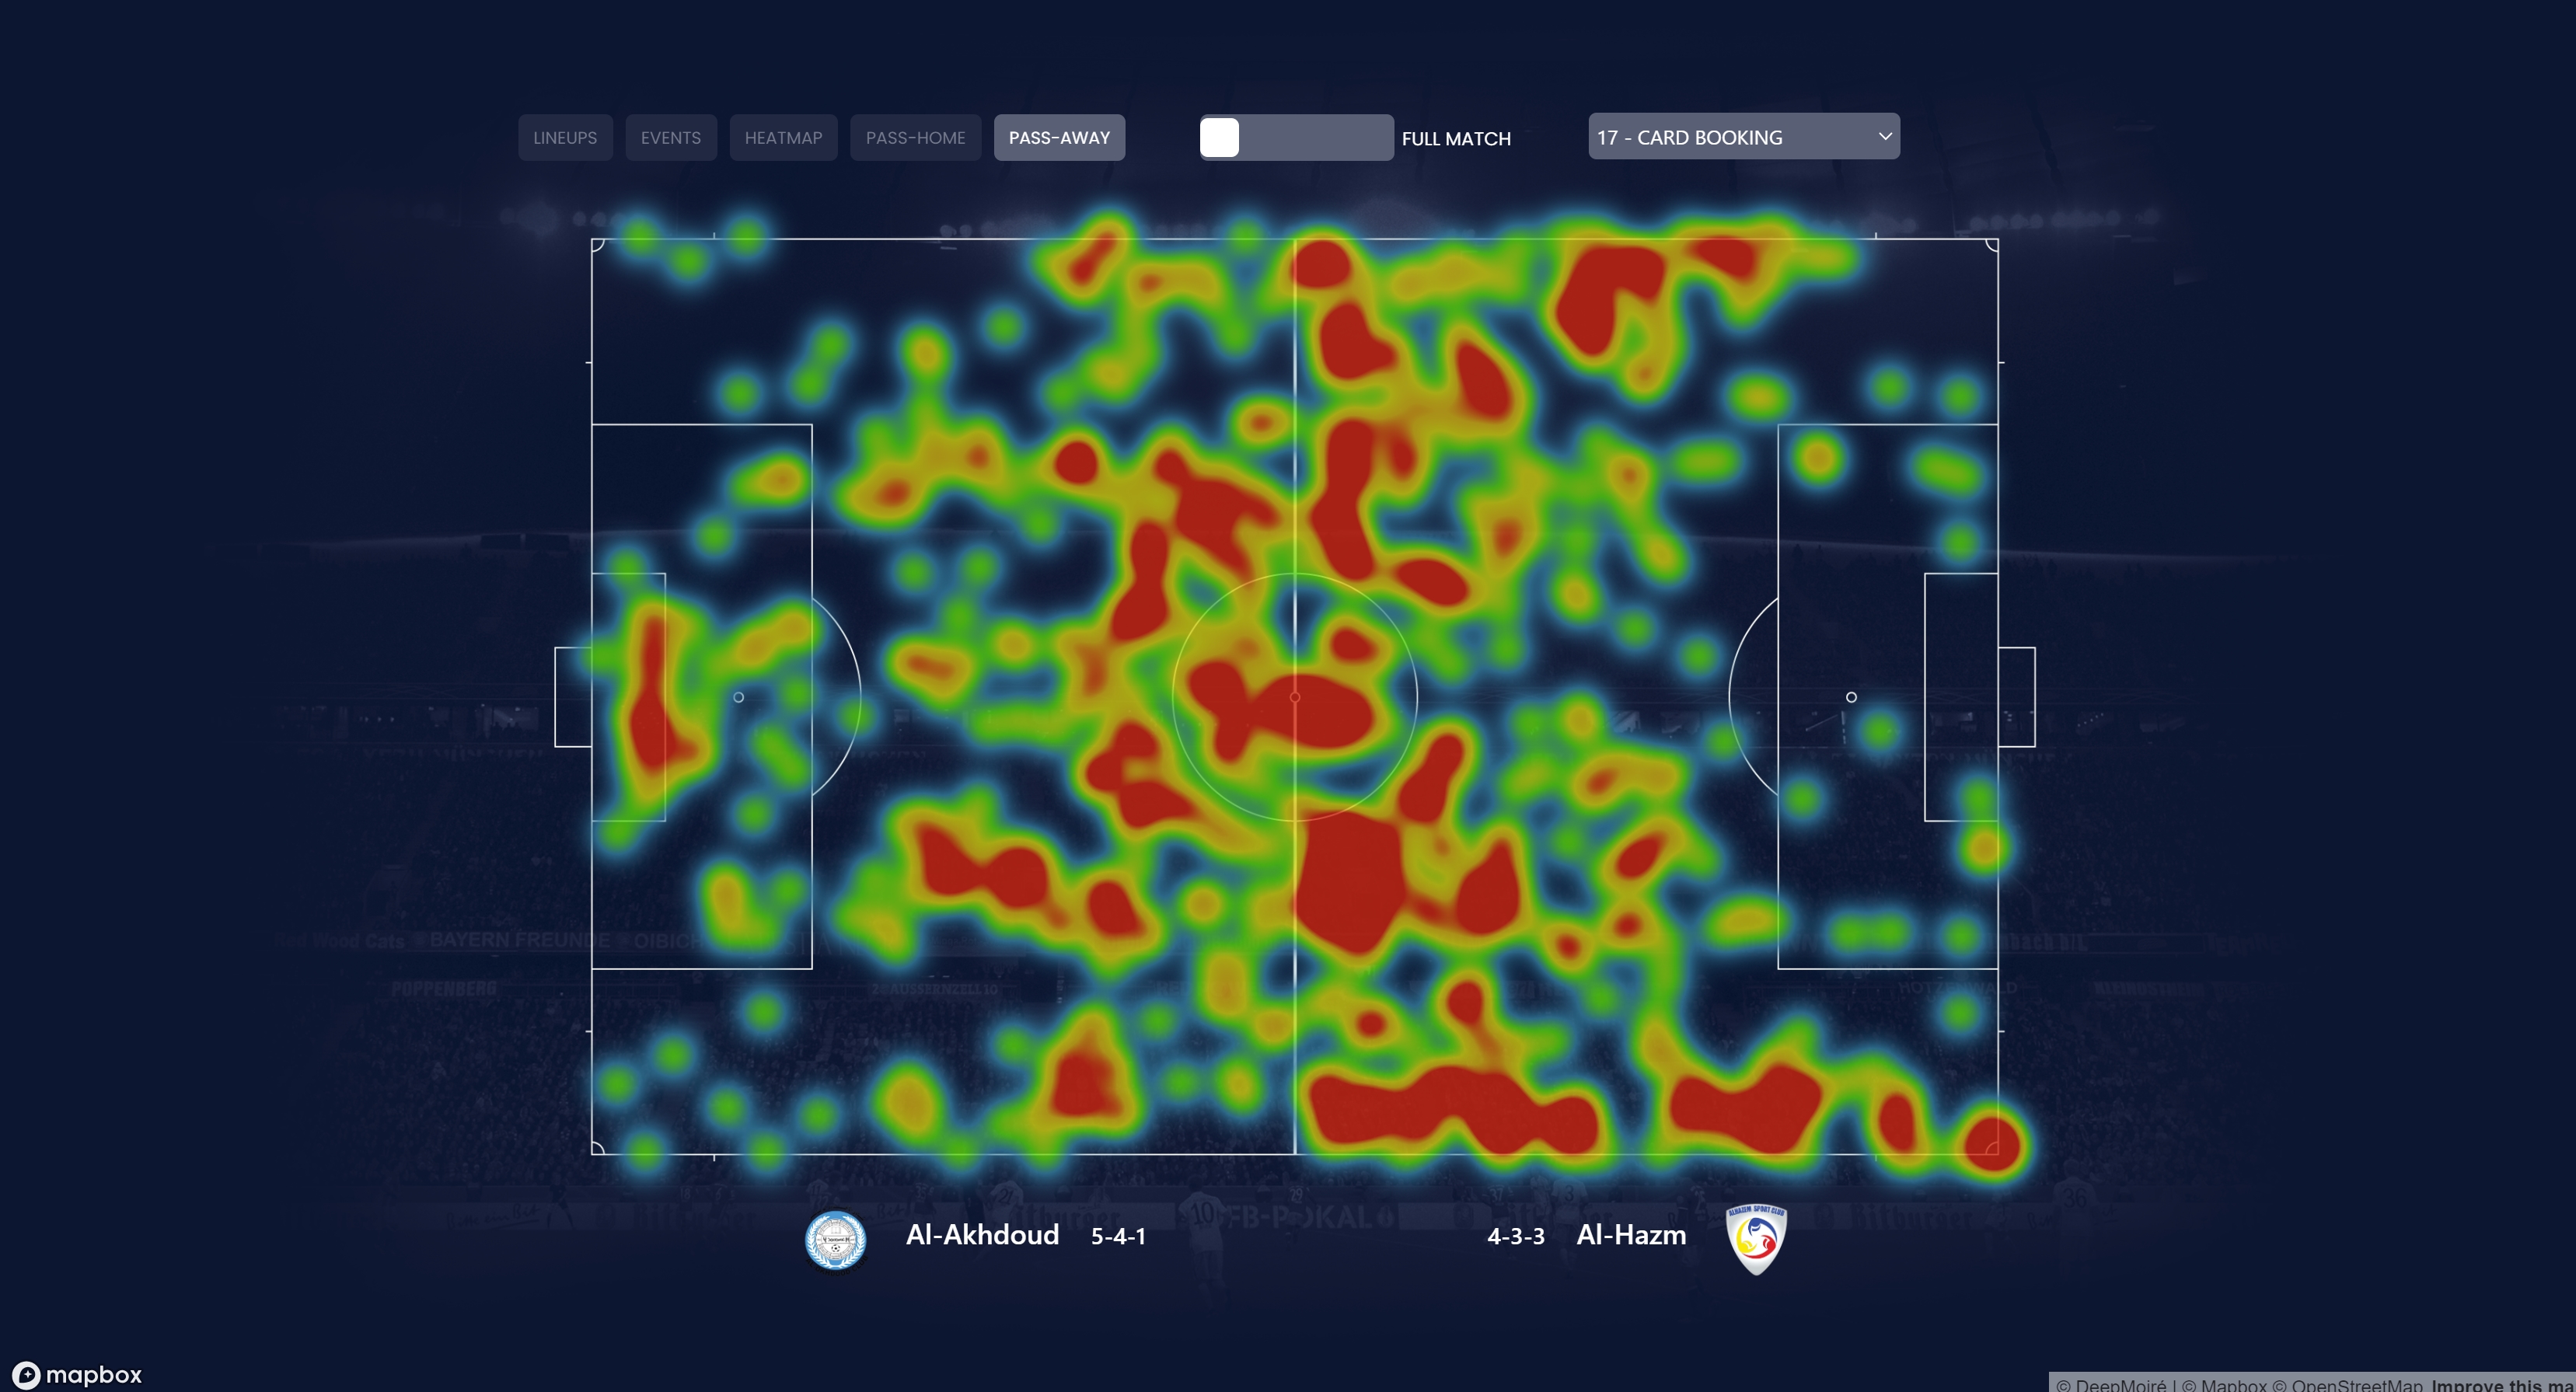
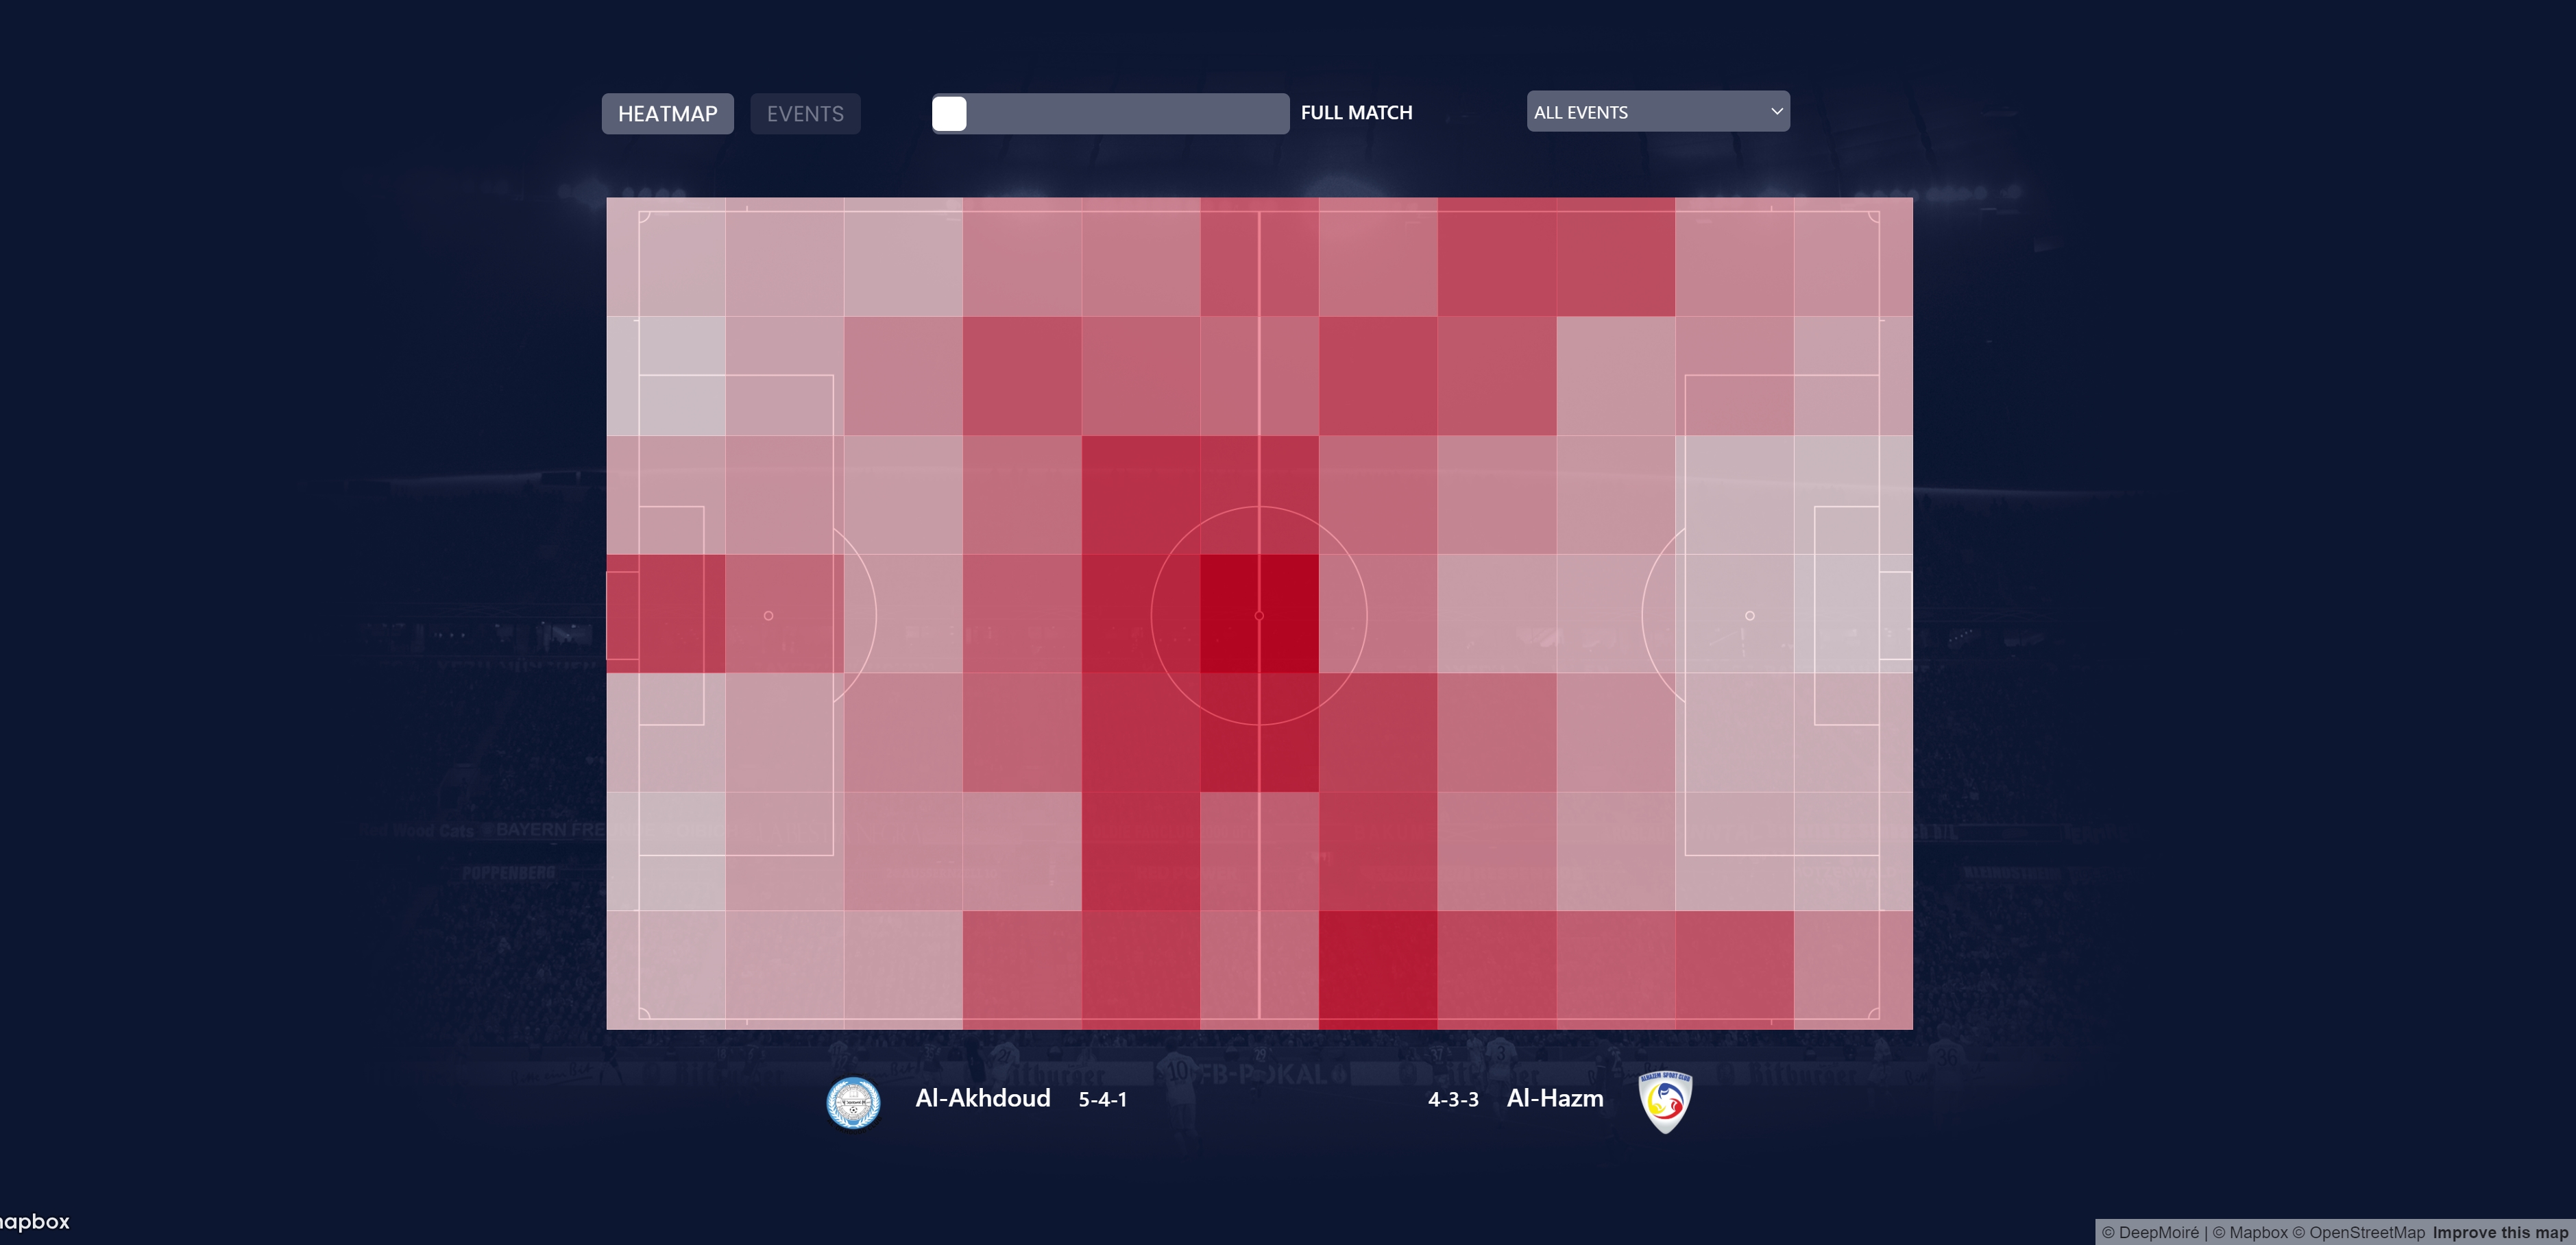
A spatial analysis view divided the pitch into 19 interactive zones. Each zone summarized the number and density of selected events, while selection revealed the individual actions contained within it. Team-specific heatmaps represented the spatial distribution of passes, crosses, shots, and ball recoveries.
Additional components included pass-matrix visualizations, radar charts, temporal line charts, and views connecting fouls and cards with the changing match result. The platform also supported real-time data updates and a responsive interface for different screen sizes.
Design & Data Visualization
The football pitch acted as the common spatial reference for several otherwise different datasets. Player formations, individual actions, zonal summaries, and continuous heatmaps could therefore be compared within the same visual environment.
Color consistently distinguished the two teams, while the visualization format changed according to the analytical question. Individual dots preserved event-level detail; zonal shading exposed aggregated distributions; heatmaps revealed broader spatial concentration; timelines showed how patterns developed during the match; and pass matrices and radar charts expressed relationships that could not be communicated effectively through pitch coordinates alone.
This combination supported both explanatory and exploratory analysis. The interface provided an immediate overview of a match while allowing users to investigate a specific minute, event family, sub-event, team, player, or pitch area and move between aggregated patterns and individual records.
Technical Approach
The application was developed as a custom HTML, CSS, and JavaScript interface. Mapbox GL JS provided the interactive spatial rendering environment, with the football pitch treated as a coordinate-based analytical surface rather than a conventional geographic basemap.
D3.js handled scales, transformations, classification, and data-driven interface behavior. Turf.js supported spatial operations such as assigning individual match events to the 19 pitch polygons. JSON and GeoJSON structures connected the processed data to the visualization layers.
The implementation translated the source coordinate system into the pitch geometry and joined individual actions with event descriptions, sub-event classifications, players, teams, and timestamps. Special processing rules corrected data-specific exceptions. Card bookings with zero coordinates, for example, inherited the position of the related preceding event so they appeared in their actual match context.
The modular, responsive interface was prepared for integration into a larger web platform. I delivered the complete visualization system and its integration specifications, while the client's technical team handled the final embedding within its own product.
Technologies
- Mapbox GL JS
- JavaScript
- HTML/CSS
- D3.js
- Turf.js
- Bootstrap
- JSON
- GeoJSON
- XML
- SQL
Data Workflow
I developed a custom ingestion and conversion workflow for raw match inputs originating from XML, SQL exports, JSON, and related classification files. The imported records were normalized into the structures required by the visualization system and connected through event, qualifier, player, and team identifiers.
Once the source data for a new match was supplied, the system regenerated the lineups, team labels, formations, filters, event layers, timelines, heatmaps, zone calculations, pass matrices, and statistical charts without requiring the interface to be rebuilt manually.
The real-time workflow also processed source XML updates during a match so the timeline, filters, charts, and spatial layers could incorporate the latest available events.
Outcome
The completed interactive data visualization platform converted heterogeneous football data into a consistent analytical experience. Users could move between player formations, individual actions, temporal sequences, zonal aggregations, heatmaps, passing relationships, statistical comparisons, and live match updates without leaving the same interface.
Most importantly, the work did not remain a one-match prototype. Its automated ingestion and regeneration workflow allowed the platform to be used across hundreds of matches, with new raw inputs producing updated visualizations and match-specific interface content automatically.