
Urban development / shadow impact analysis
3D Urban Shadow Analysis Interactive Map
Overview
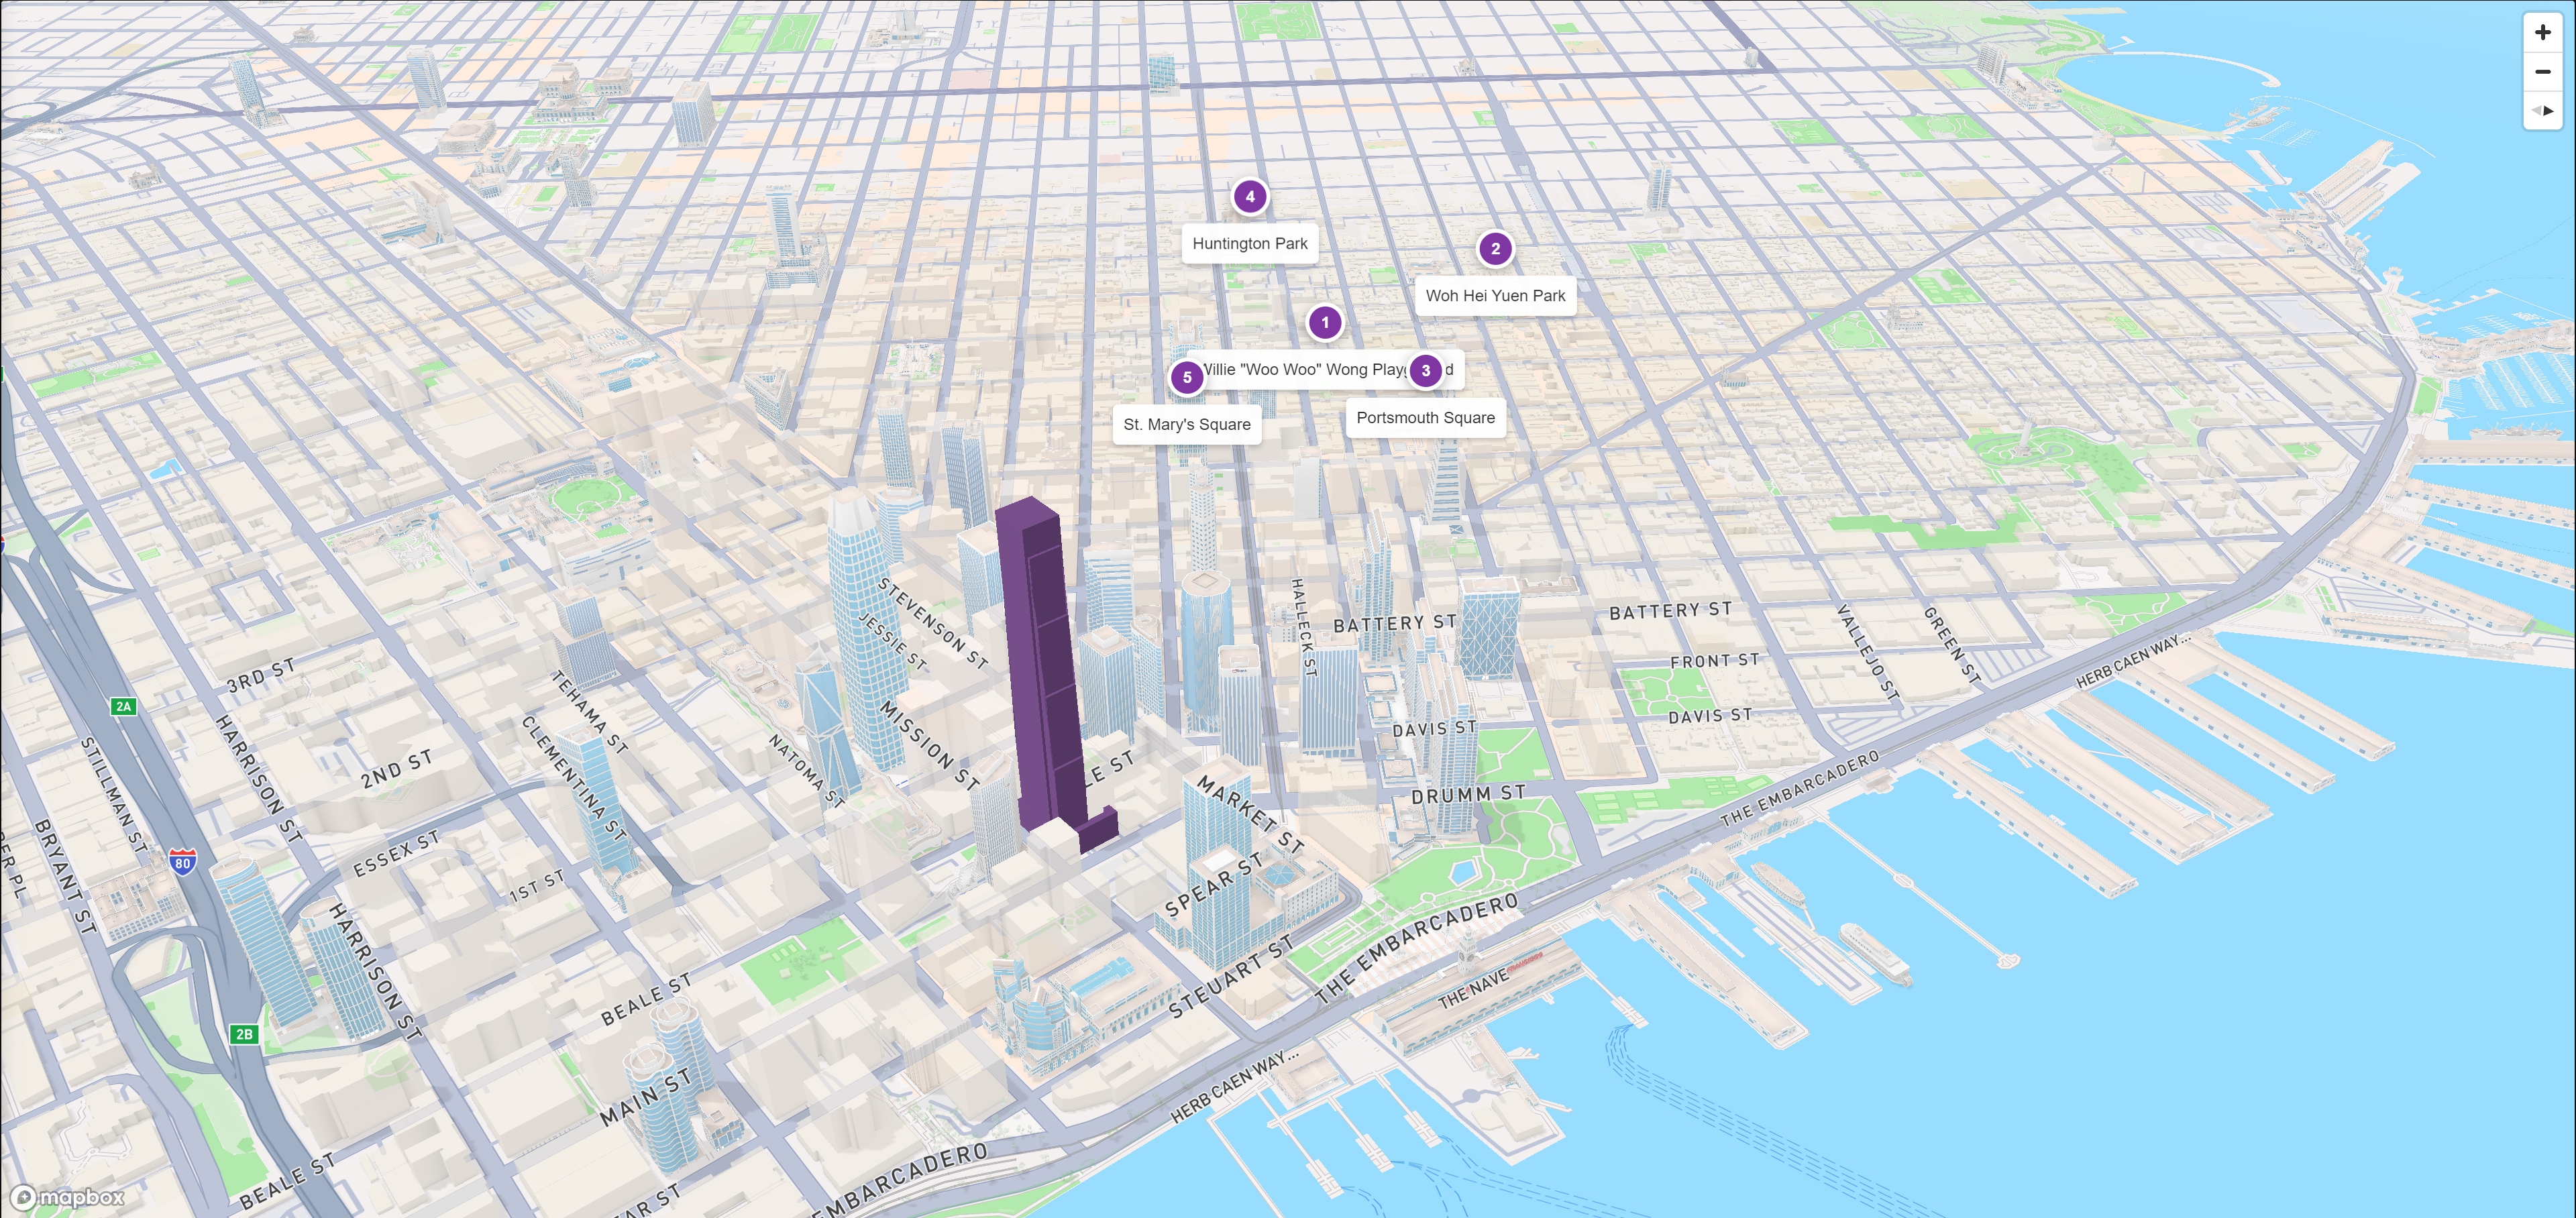
I designed and developed a custom 2.5D/3D interactive map for exploring the shadow impact of a proposed high-rise development across five public open spaces.
The application transformed a detailed analytical study—originally distributed across spreadsheets, calculations, tables, and static graphics—into a spatial web interface where users could understand the proposed tower within the surrounding city context, move between individual analyzed locations, and inspect the corresponding quantitative shadow results.
Challenge
The source analysis contained several layers of information for each location: existing shadow conditions, additional shadow introduced by the proposed development, combined shadow exposure, remaining sunlight, seasonal variation, maximum coverage, affected dates, and daily duration.
The challenge was to connect these numerical results to the actual spatial relationship between the proposed tower and the affected open spaces without reducing the project to a conventional flat dashboard. The interface needed to work at two scales: an overall 3D urban view establishing the geographic relationship between the tower and the analyzed locations, and a detailed view where each location could be examined individually.
Solution
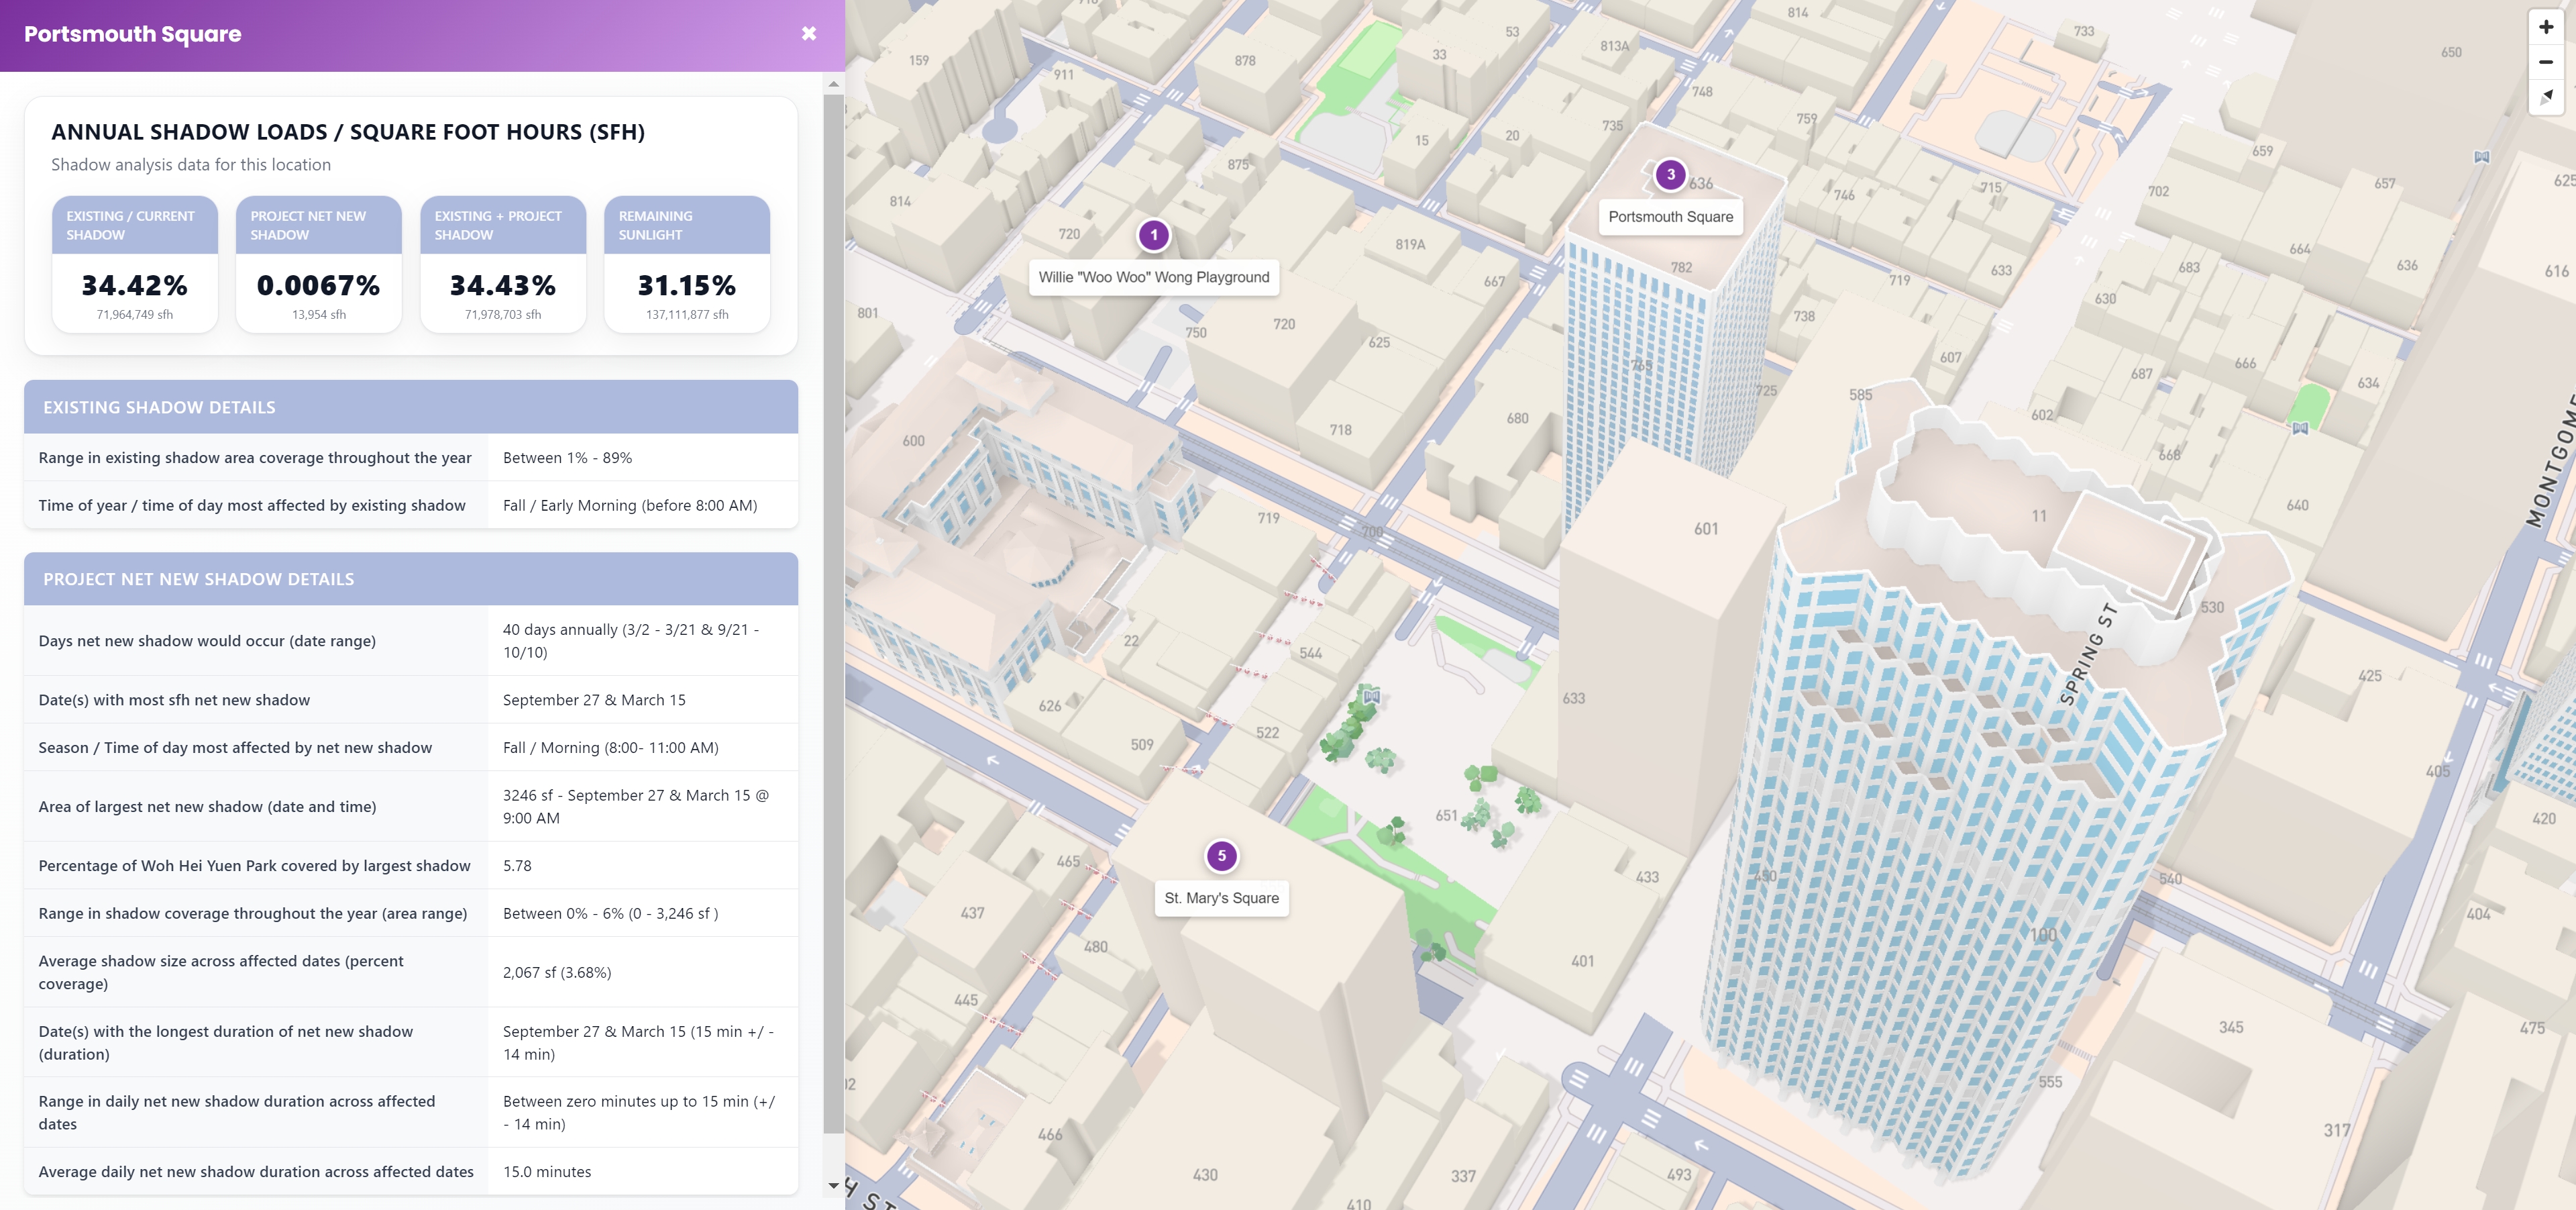
The finished application uses an interactive Mapbox environment as the main interface. A custom 3D model of the proposed tower is positioned directly within the surrounding 2.5D/3D city scene, while five analyzed public open spaces are represented as individually selectable map locations.
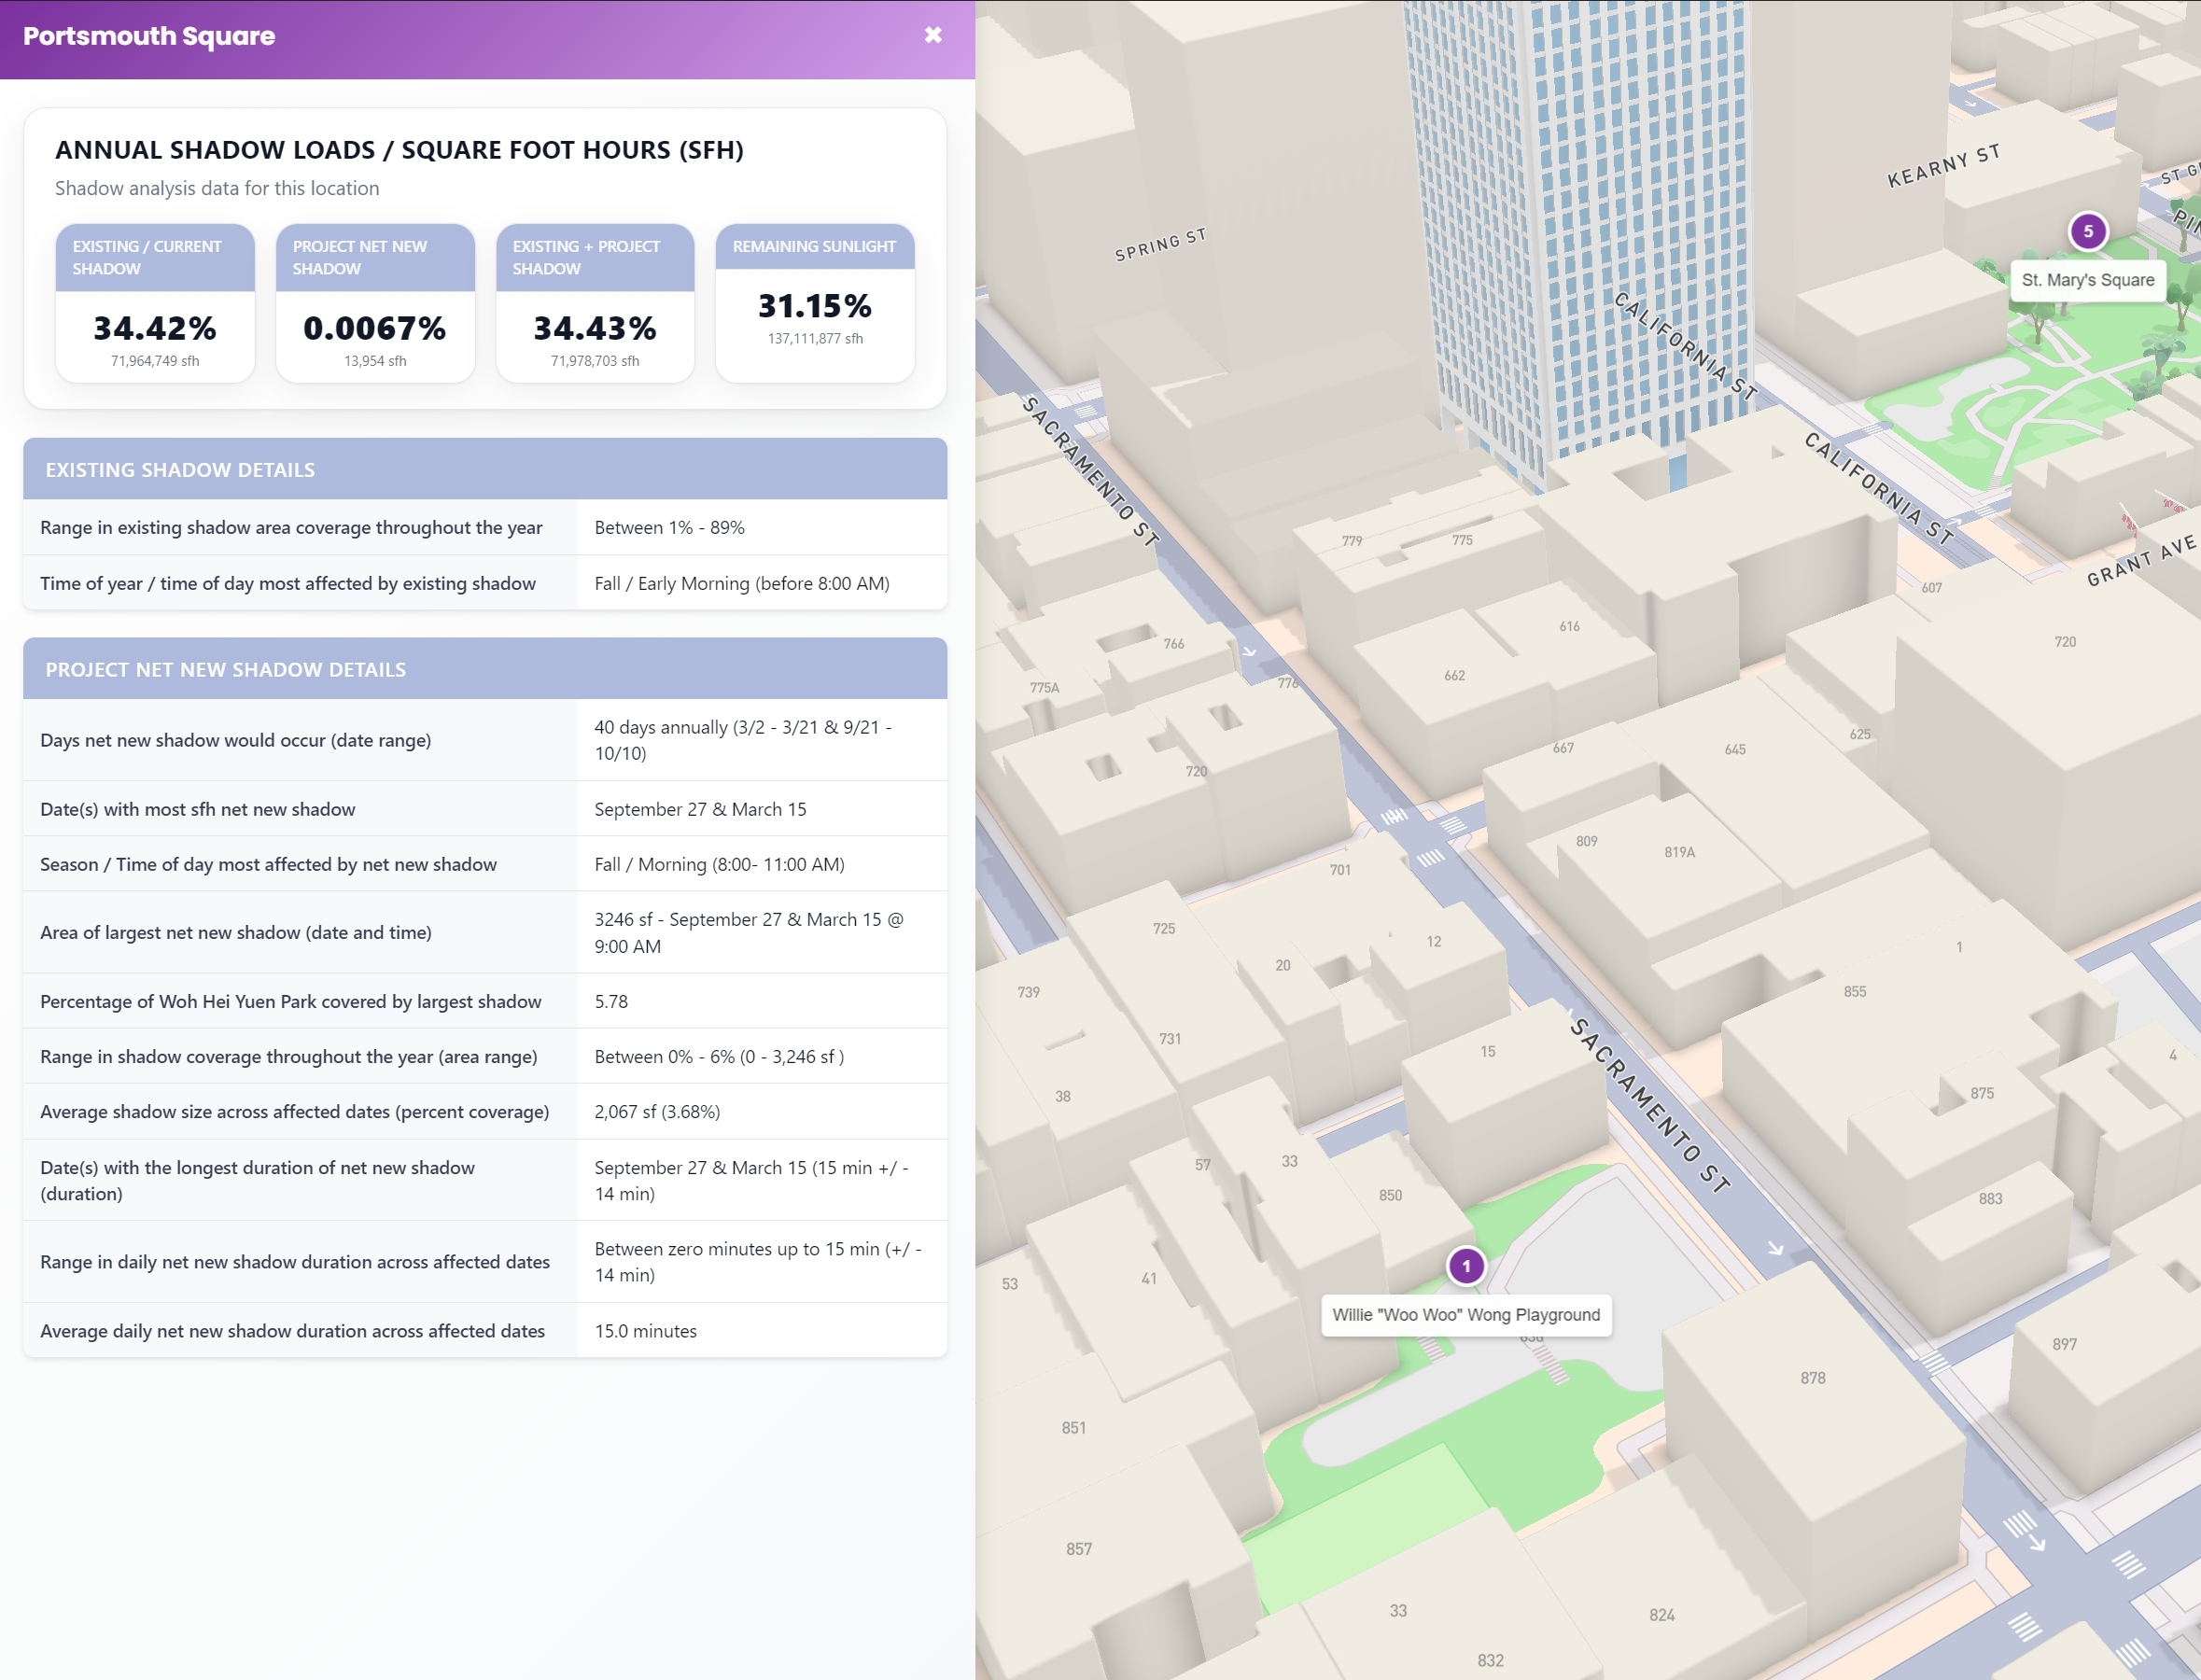
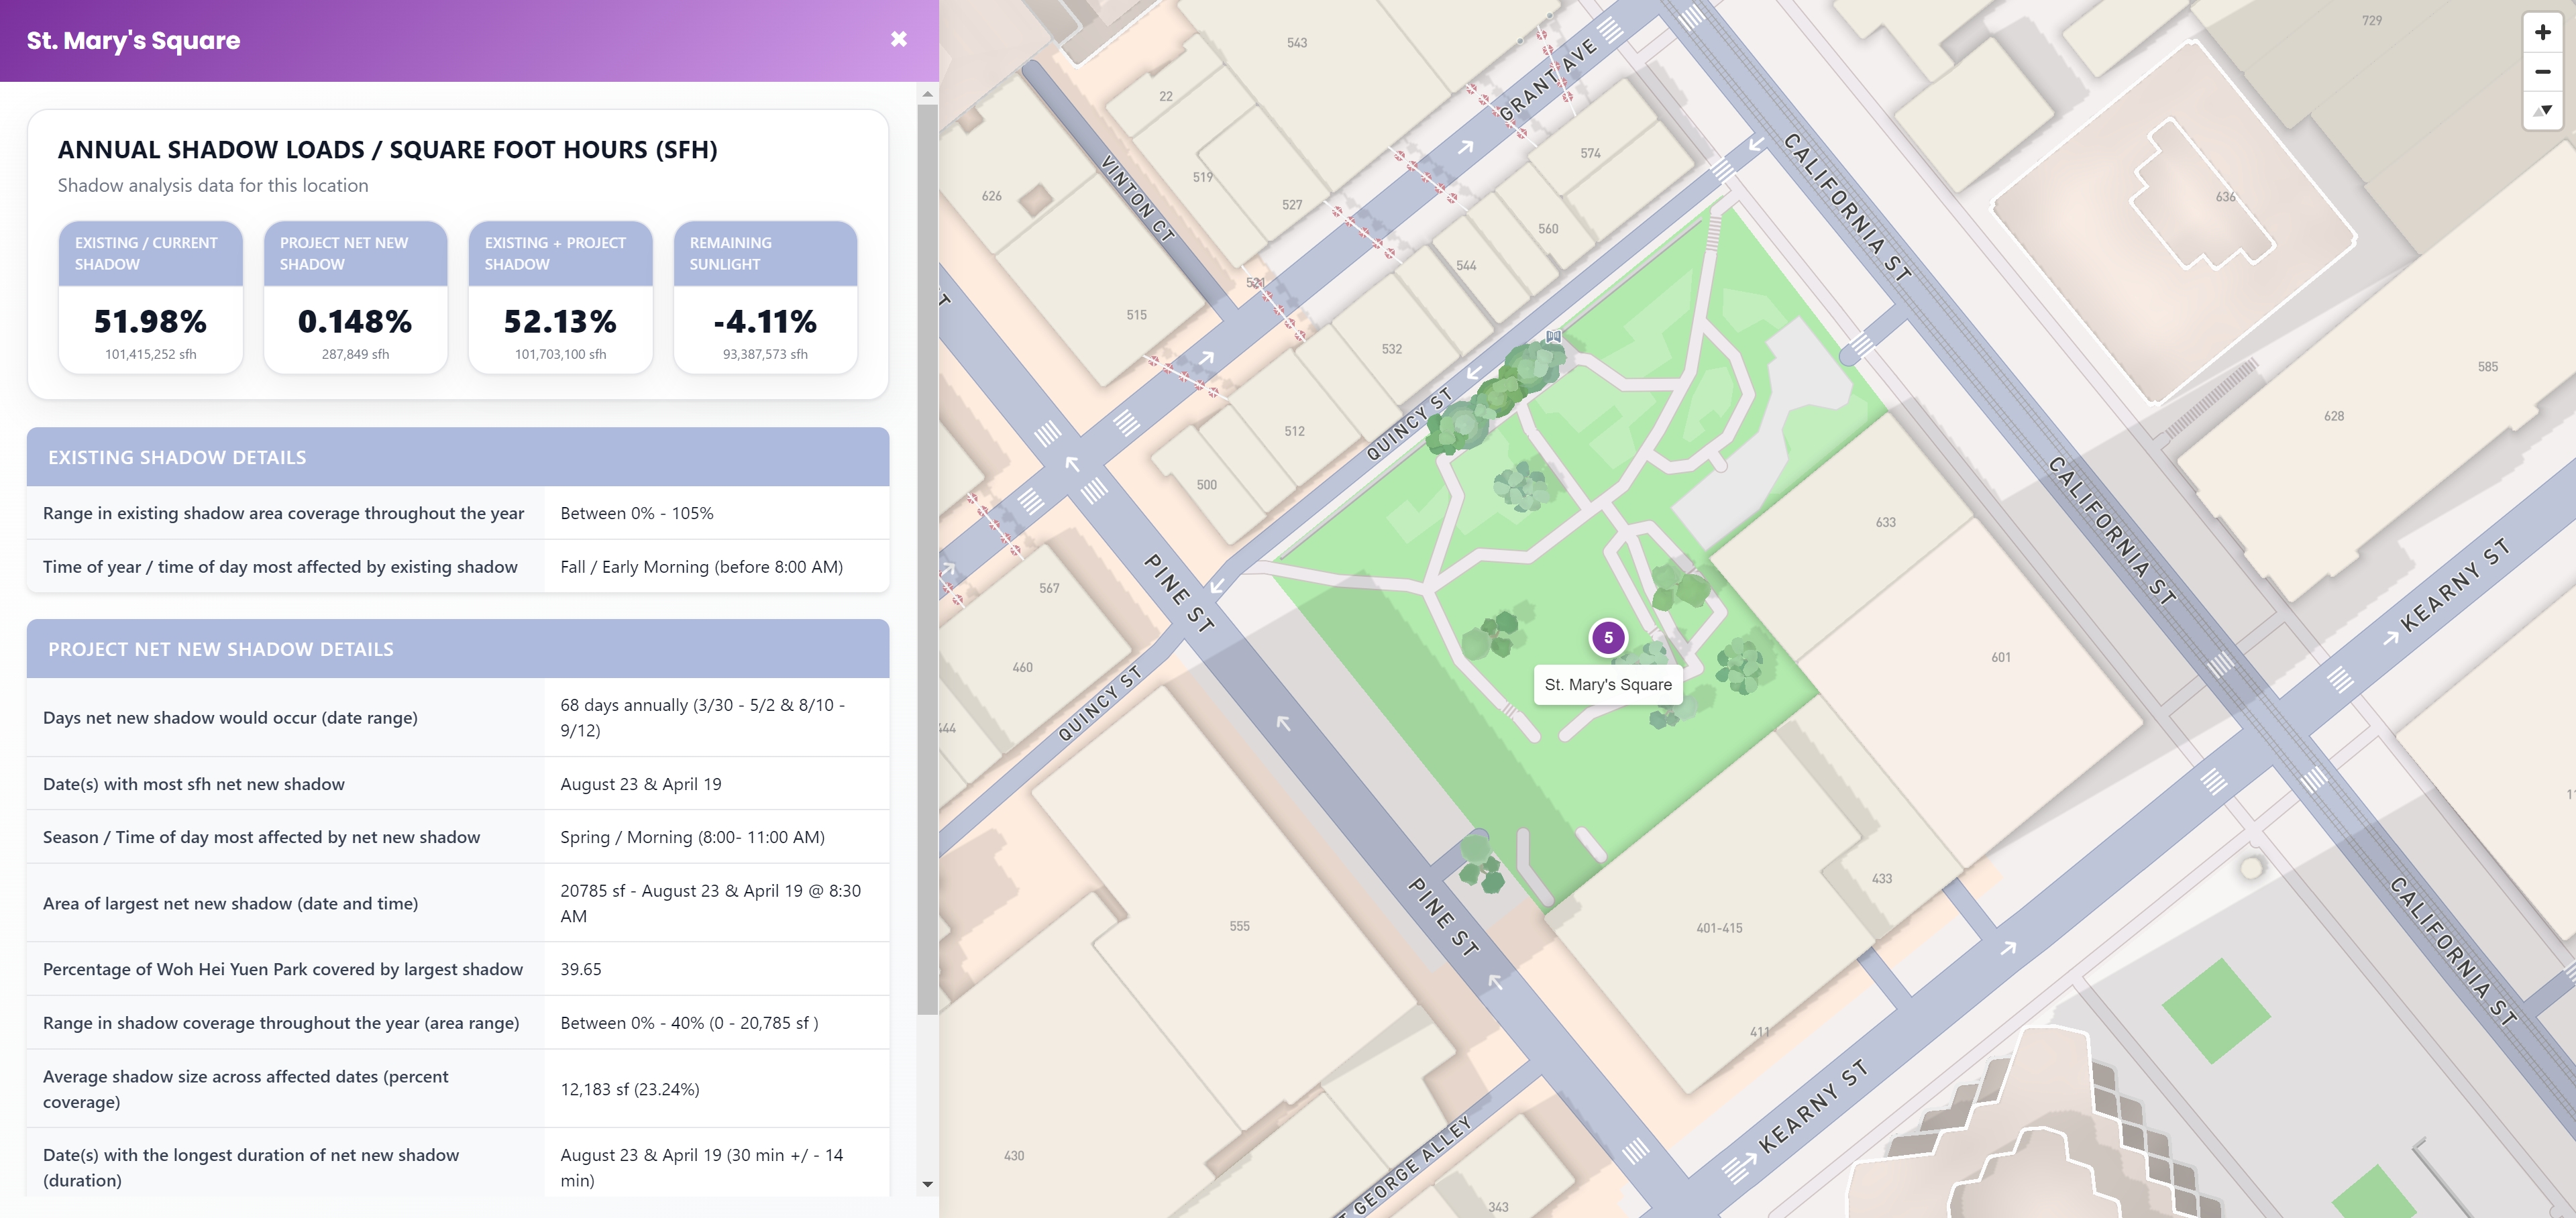
Selecting a location triggers a smooth camera transition from the broader urban view to a closer site-specific view and opens a dedicated analytical side panel. Closing the panel returns the user to the overall 3D project view, making it possible to move quickly between locations while maintaining their relationship to the proposed development.
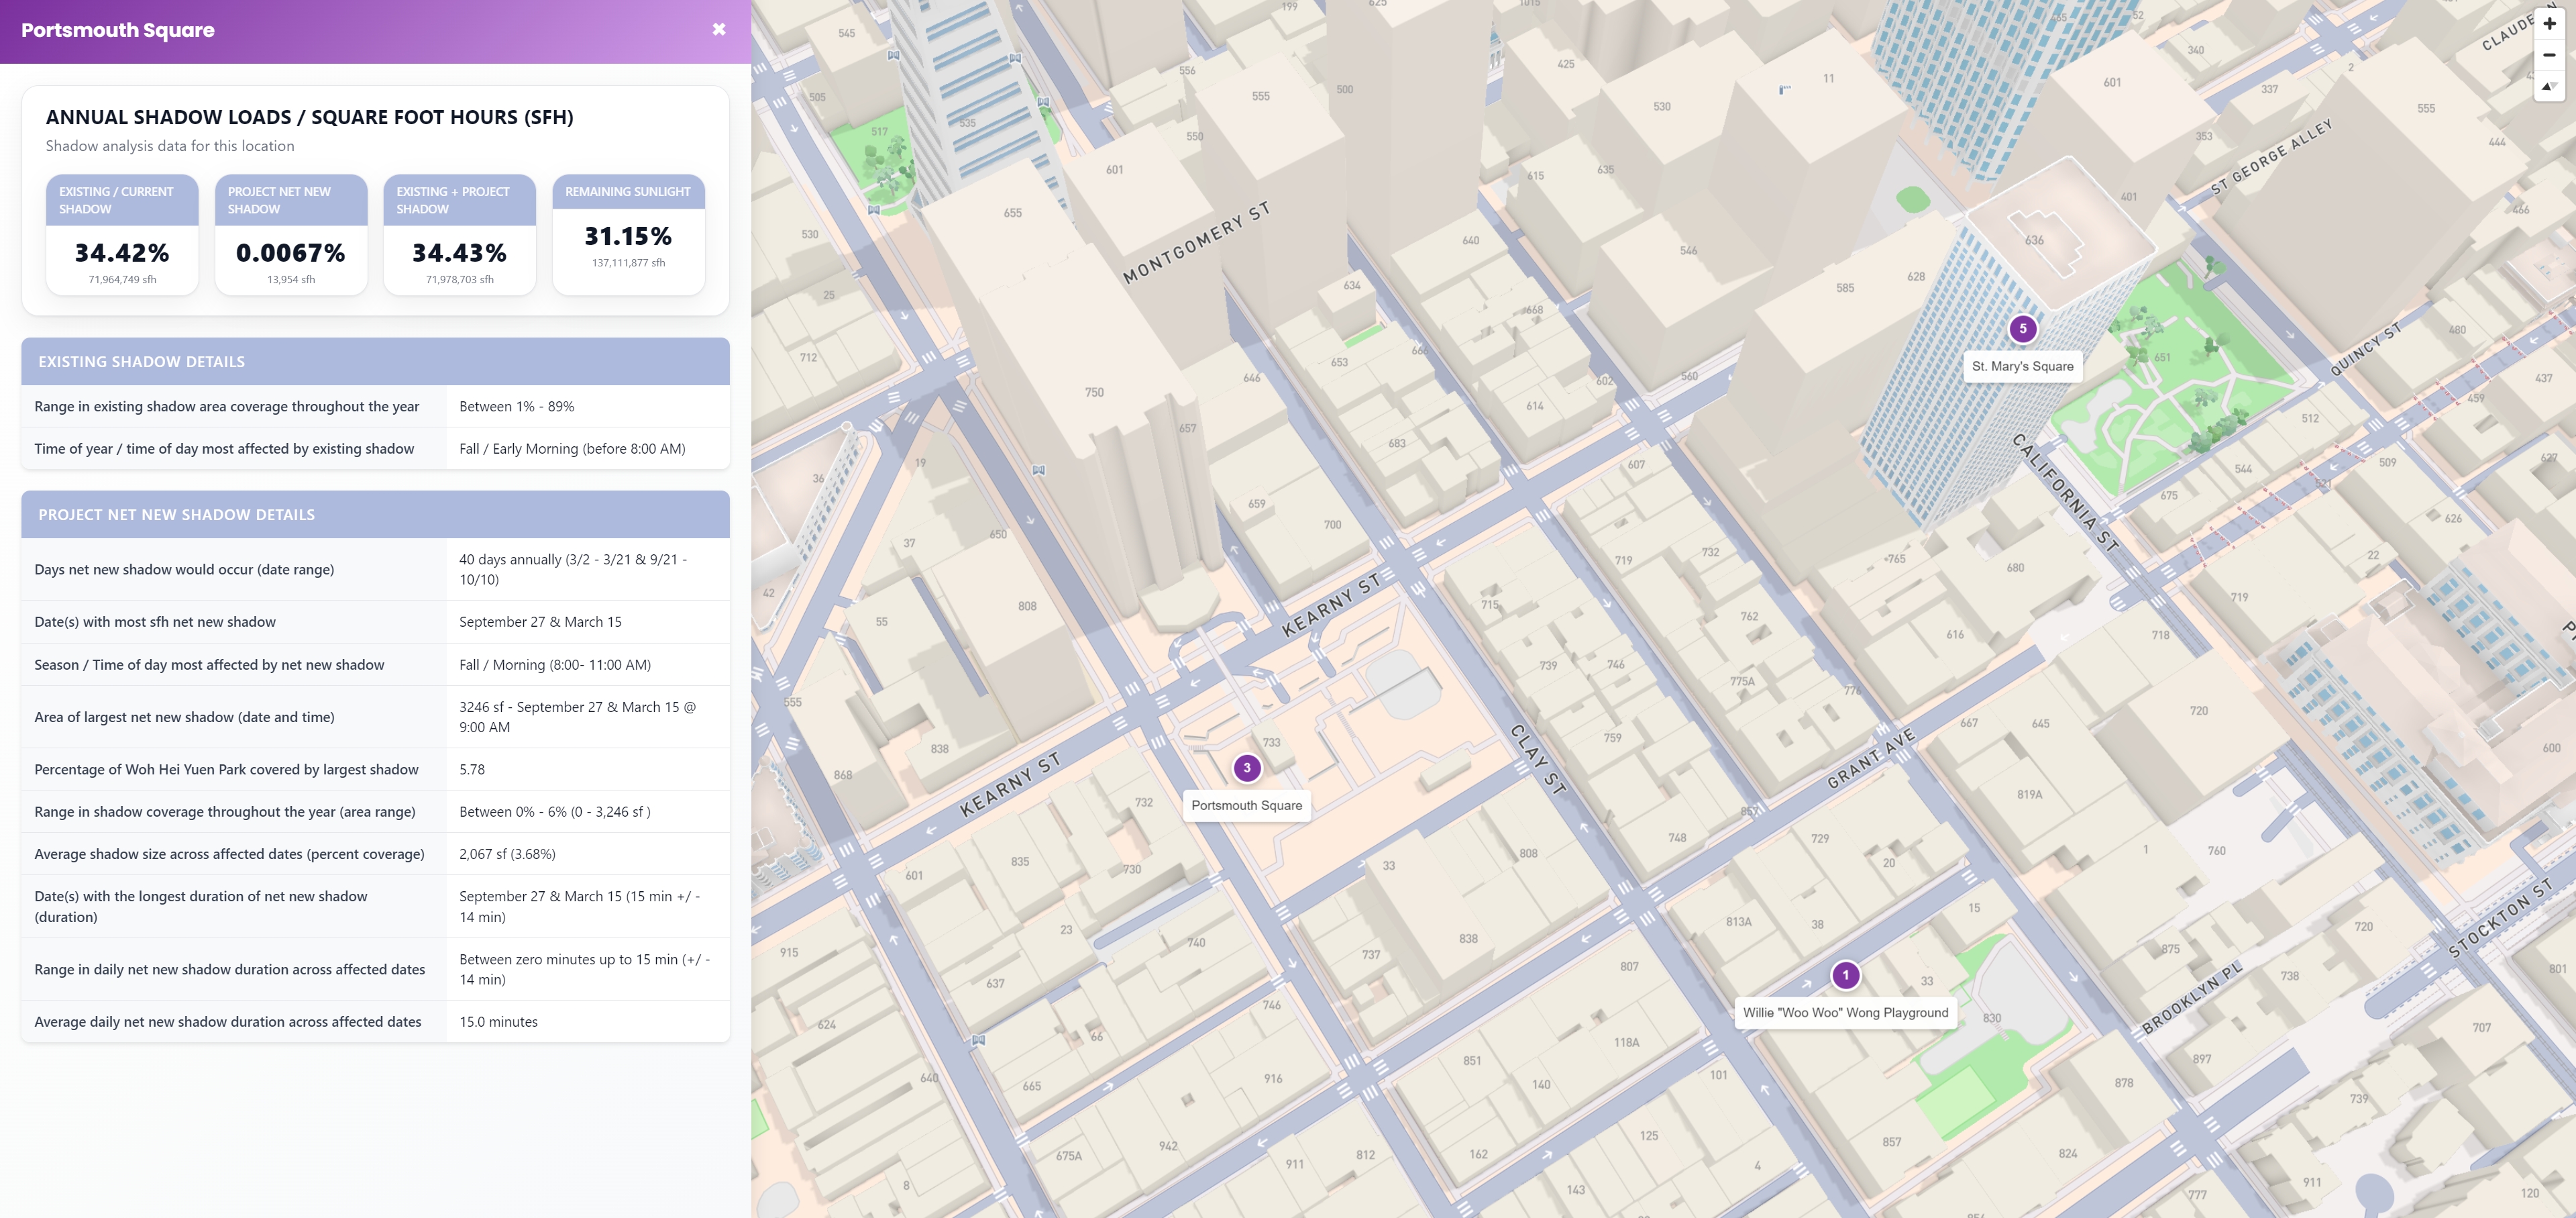
For each location, the panel presents four main annual indicators—existing/current shadow, project net-new shadow, combined shadow, and remaining sunlight—followed by detailed values covering annual ranges, affected periods, maximum shadow area and percentage coverage, average shadow size, dates of greatest impact, and shadow duration.
Design & Data Visualization
A central design decision was to preserve the urban context of the analysis rather than separate the quantitative results from the map.
The application opens with an oblique 3D perspective that establishes the proposed tower within the surrounding building fabric. Smooth animated camera transitions then guide users from the city-scale view to individual analyzed locations and back again. This interaction creates a continuous relationship between the overall development and the specific shadow conditions being examined.
The proposed building is represented as a custom 3D object rather than a generic map extrusion. Combined with the recent Mapbox urban style and surrounding 2.5D/3D geometry, this keeps the analytical information connected to the physical environment it describes.
Technical Approach
The core map was developed with Mapbox GL JS 3.14.0 using a contemporary Mapbox style and an oblique 3D camera configuration. Three.js is integrated into the Mapbox WebGL rendering context through a custom layer, allowing an external OBJ model of the proposed tower to be positioned, scaled, rotated, and lit directly within the geographic scene.
Custom JavaScript markers identify the analyzed locations, while Mapbox flyTo transitions synchronize movement between the overall project view and each detailed location. Logic was also included to remove the existing building representation at the development site so the proposed geometry could occupy the correct position within the city model.
The resulting implementation combines the 2.5D/3D geographic environment, custom building geometry, spatial interaction, and quantitative analytical interface within a single browser-based application.
Technologies
- Mapbox GL JS
- JavaScript
- HTML/CSS
- Three.js
- SheetJS/XLSX
- OBJ 3D model
Data Workflow
The analytical interface was designed around an external Excel workbook rather than hard-coding the shadow results into the page.
At runtime, the application loads the spreadsheet through SheetJS/XLSX, converts its worksheets into JavaScript records, associates those records with the corresponding analyzed locations, and dynamically generates the metric cards and detailed analytical tables.
This separates the source analysis from its visual presentation and creates a direct bridge between the existing spreadsheet-based workflow and the interactive geographic interface. Different location results can therefore populate the same consistent dashboard structure without manually recreating each analytical view.
Outcome
The completed application turned a technically dense shadow study into an explorable spatial system. Users could understand the proposed tower within its broader 3D urban context, move smoothly between five analyzed public open spaces, and inspect how the development affected each location through a consistent set of quantitative shadow metrics.
The project also established a reusable data-driven relationship between spreadsheet analysis and web visualization: structured analytical outputs could be translated into location-specific interactive dashboards while remaining directly connected to the geography and 3D context of the development.