
Commercial real estate / property availability and spatial stacking plans
3D Commercial Real Estate Map & Spatial Stacking Plan
Overview
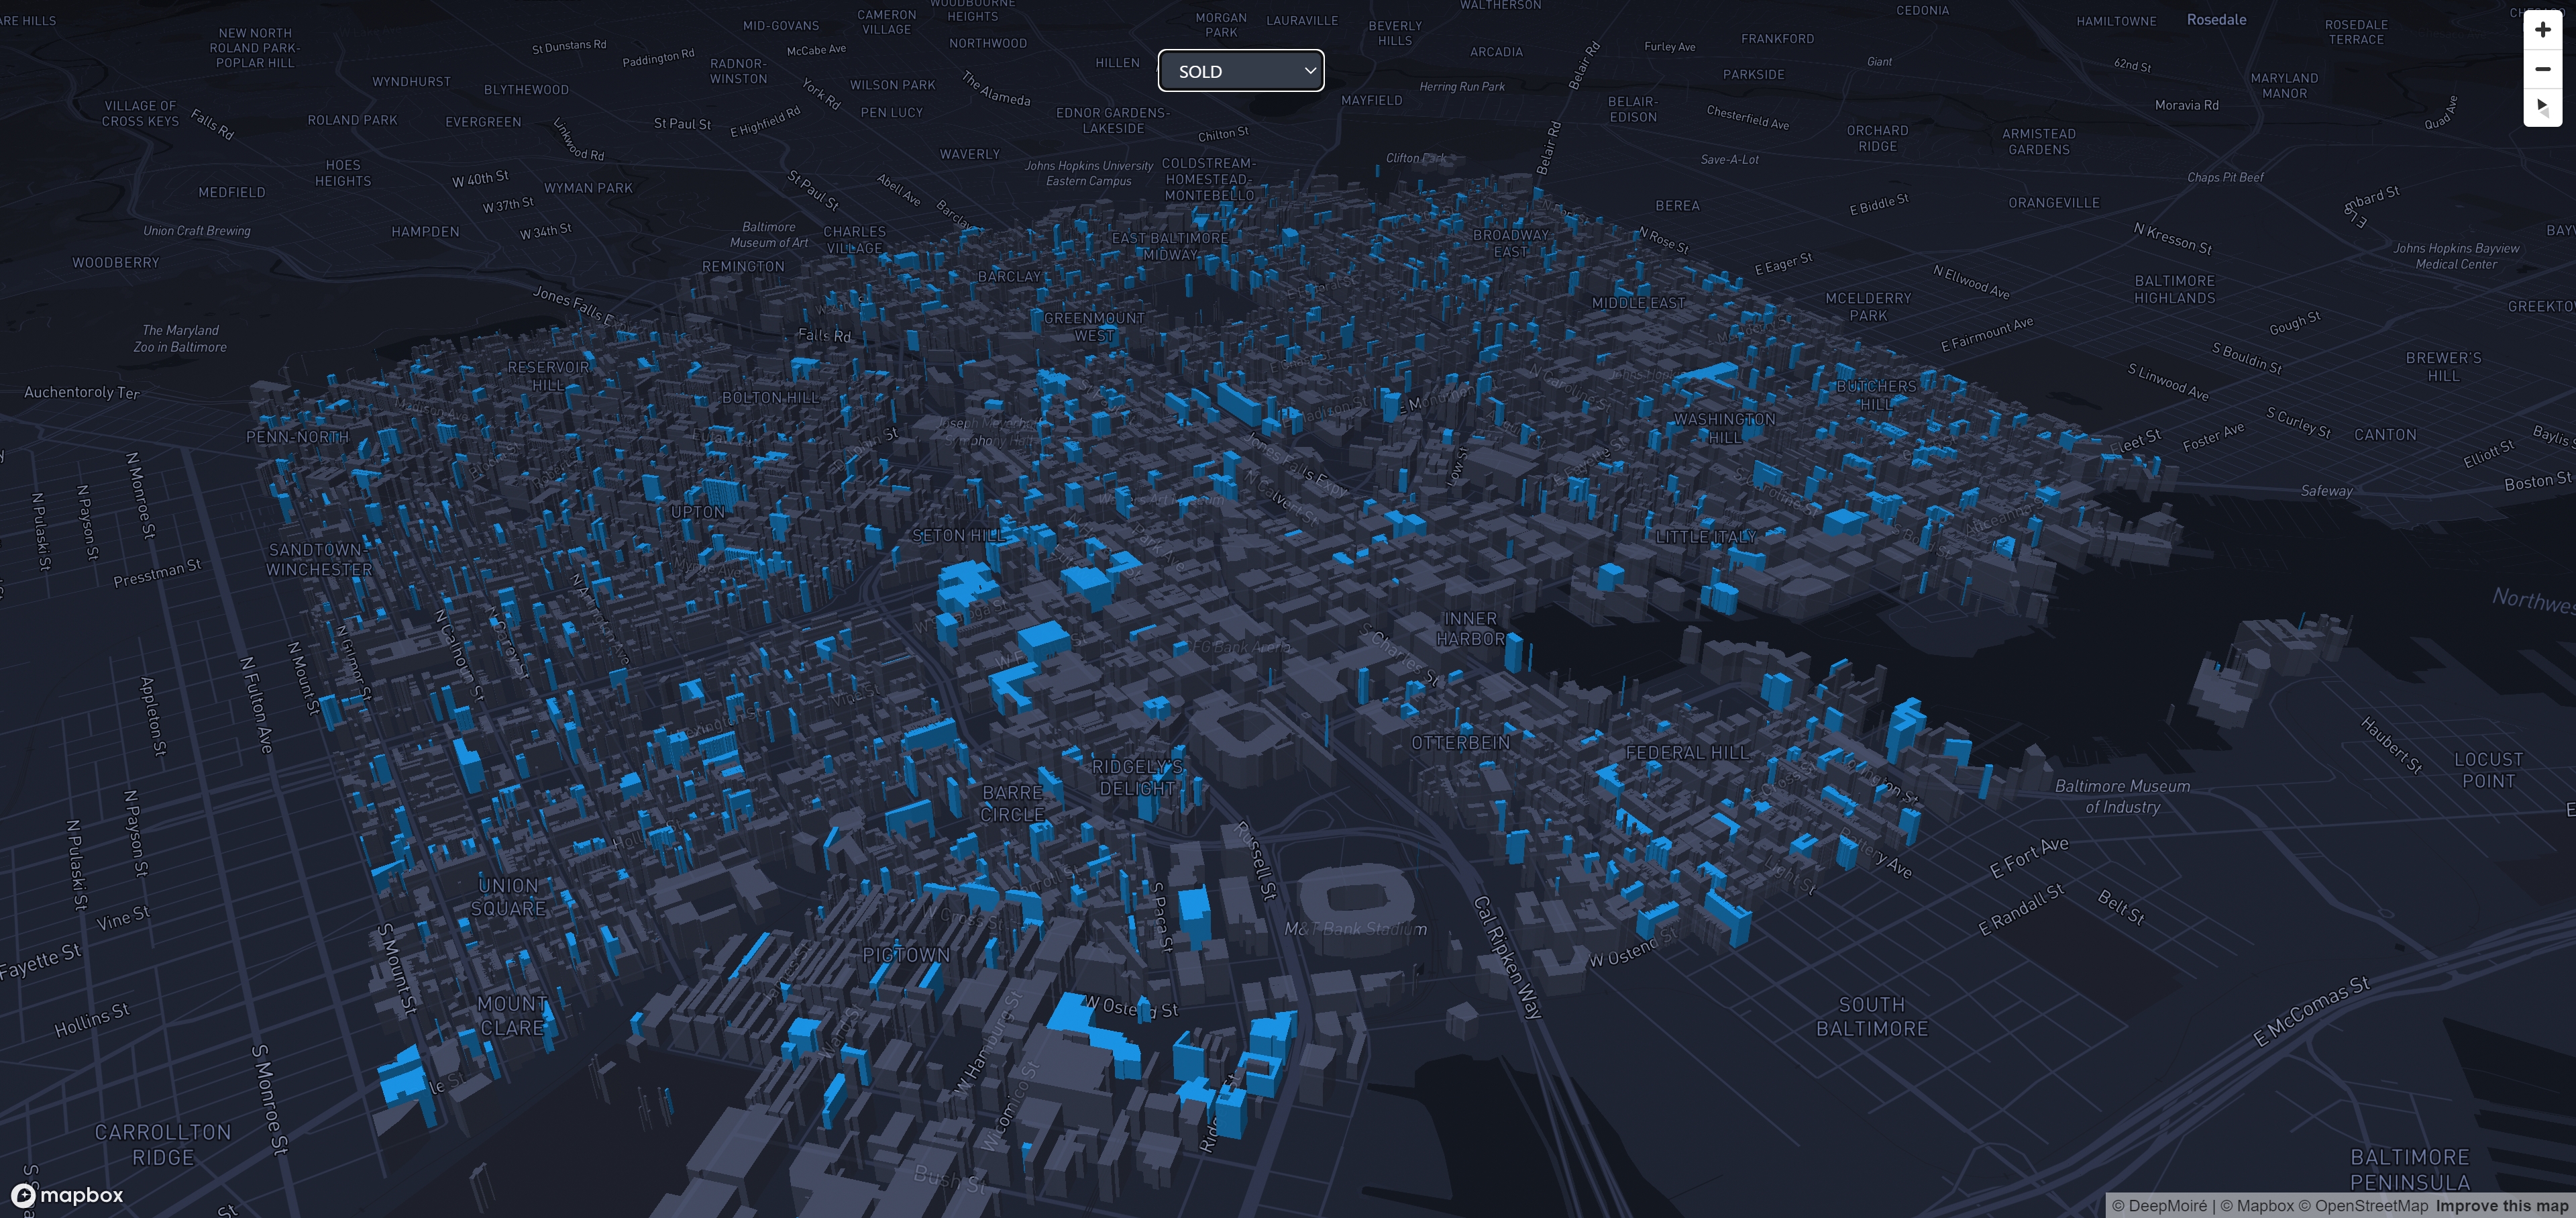
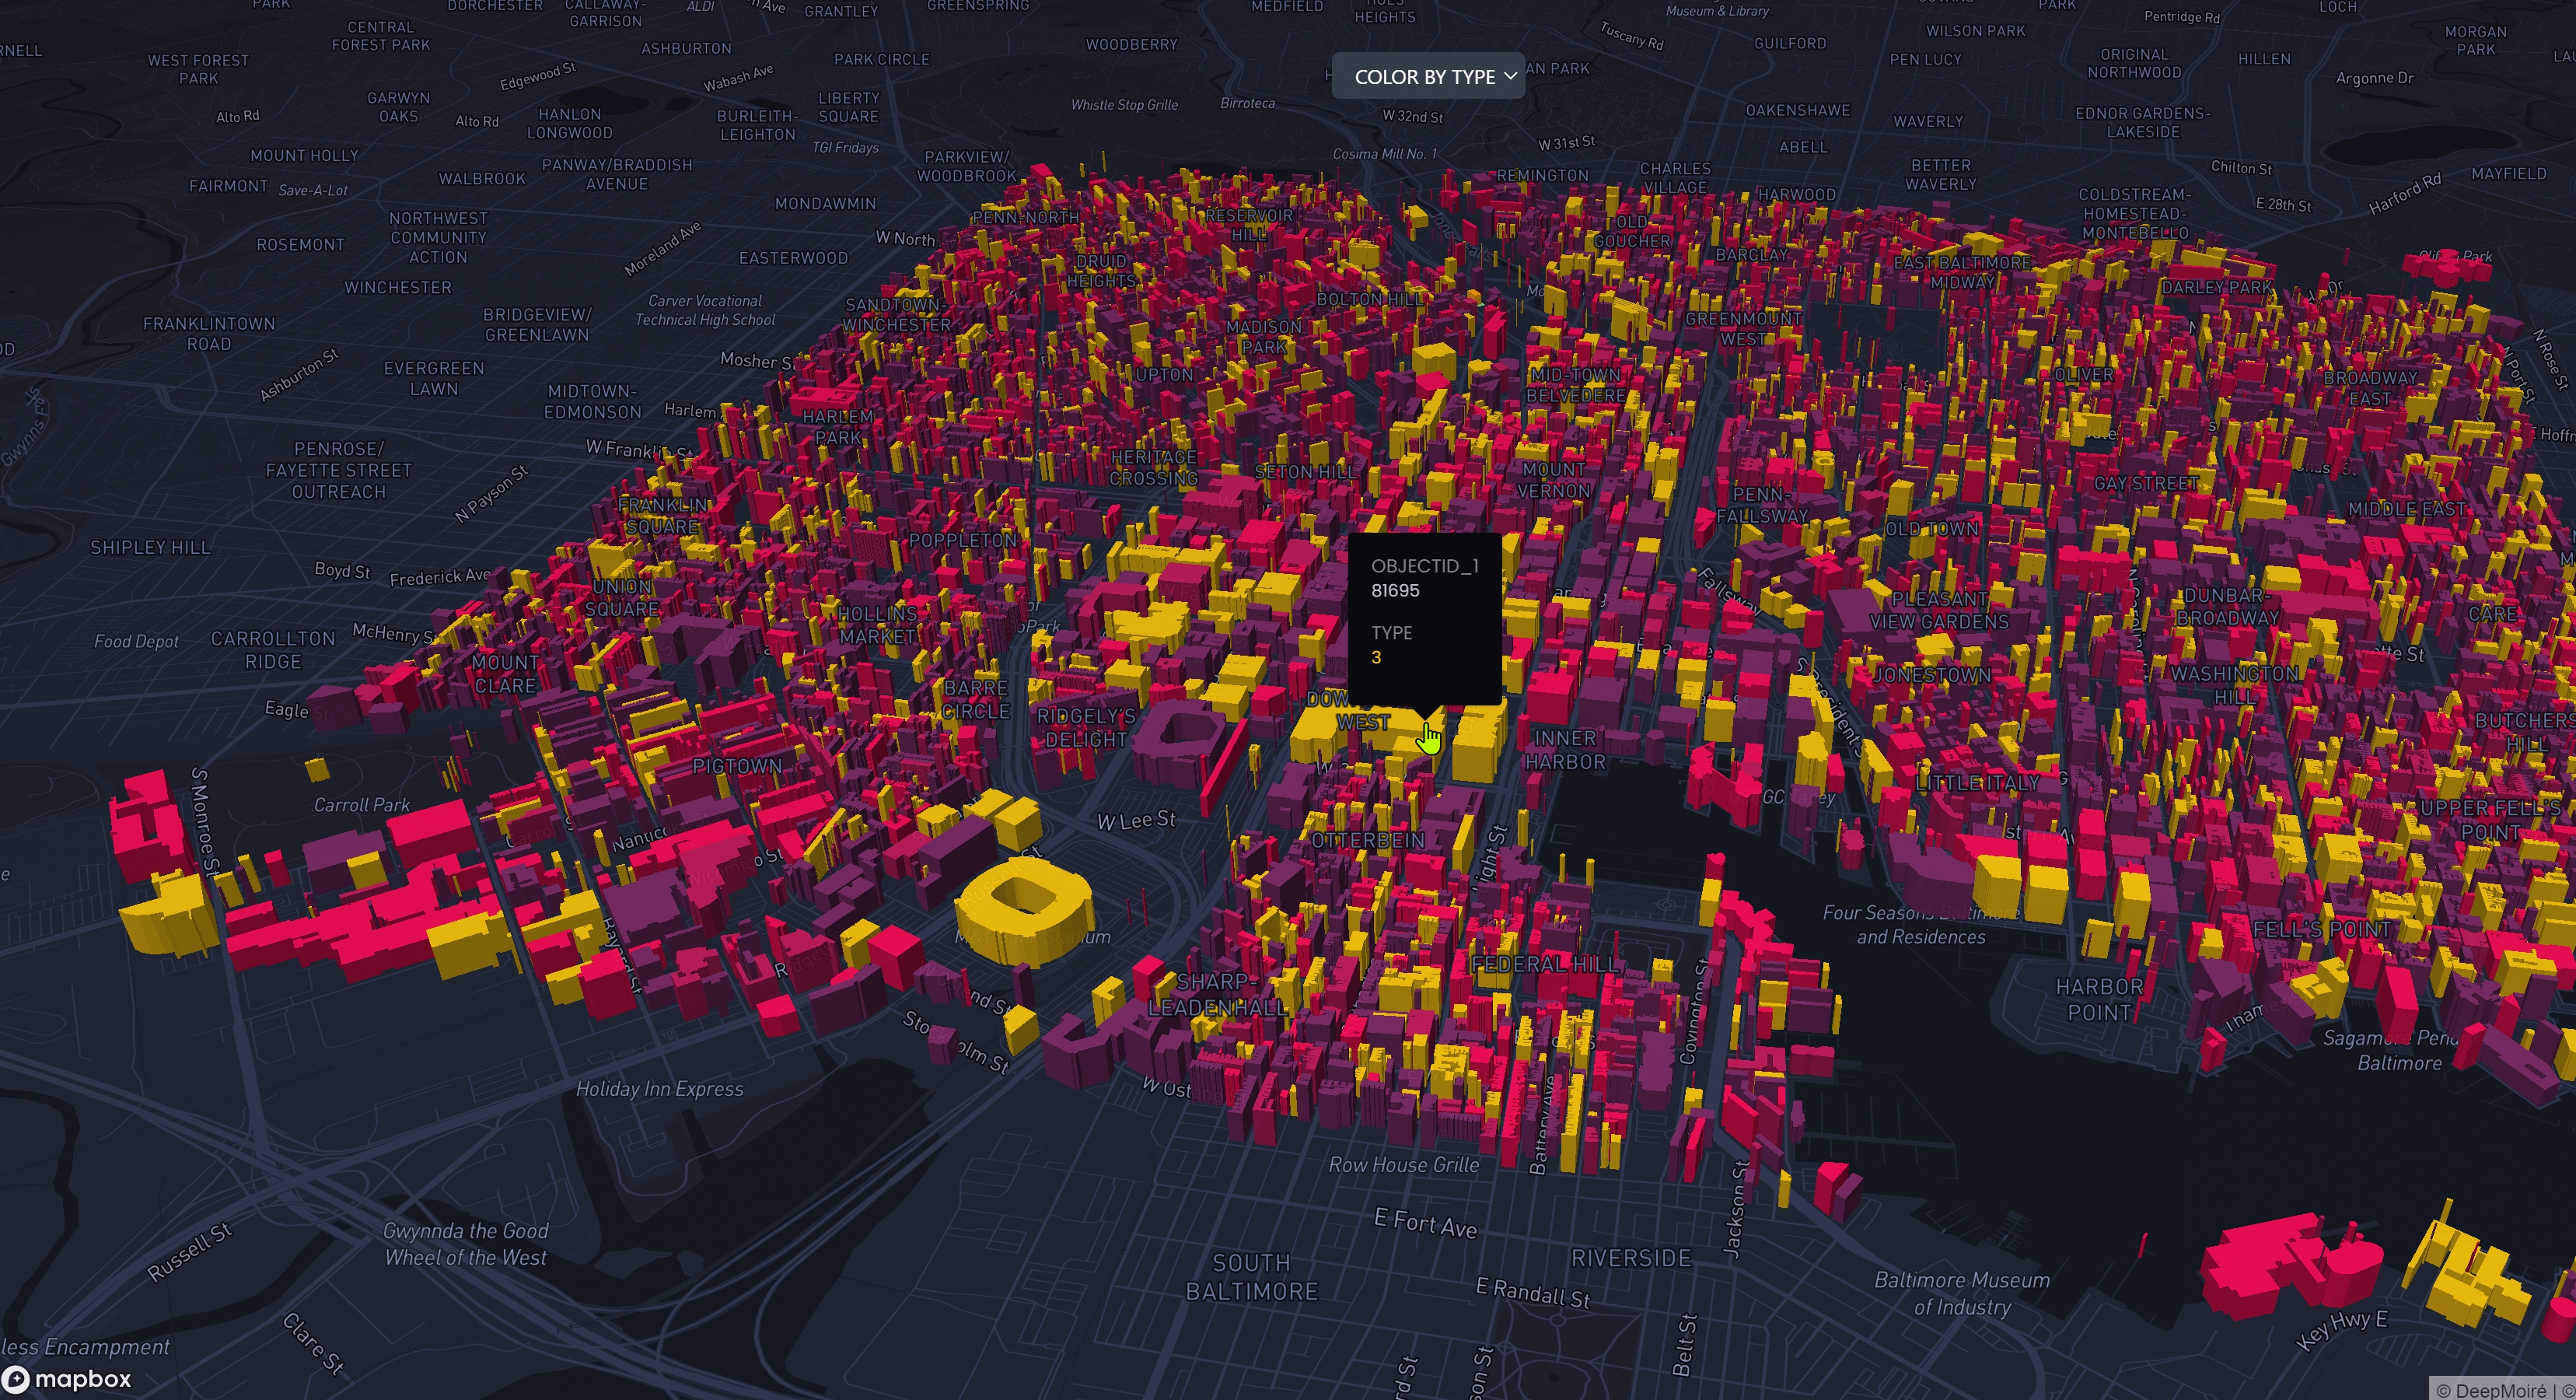
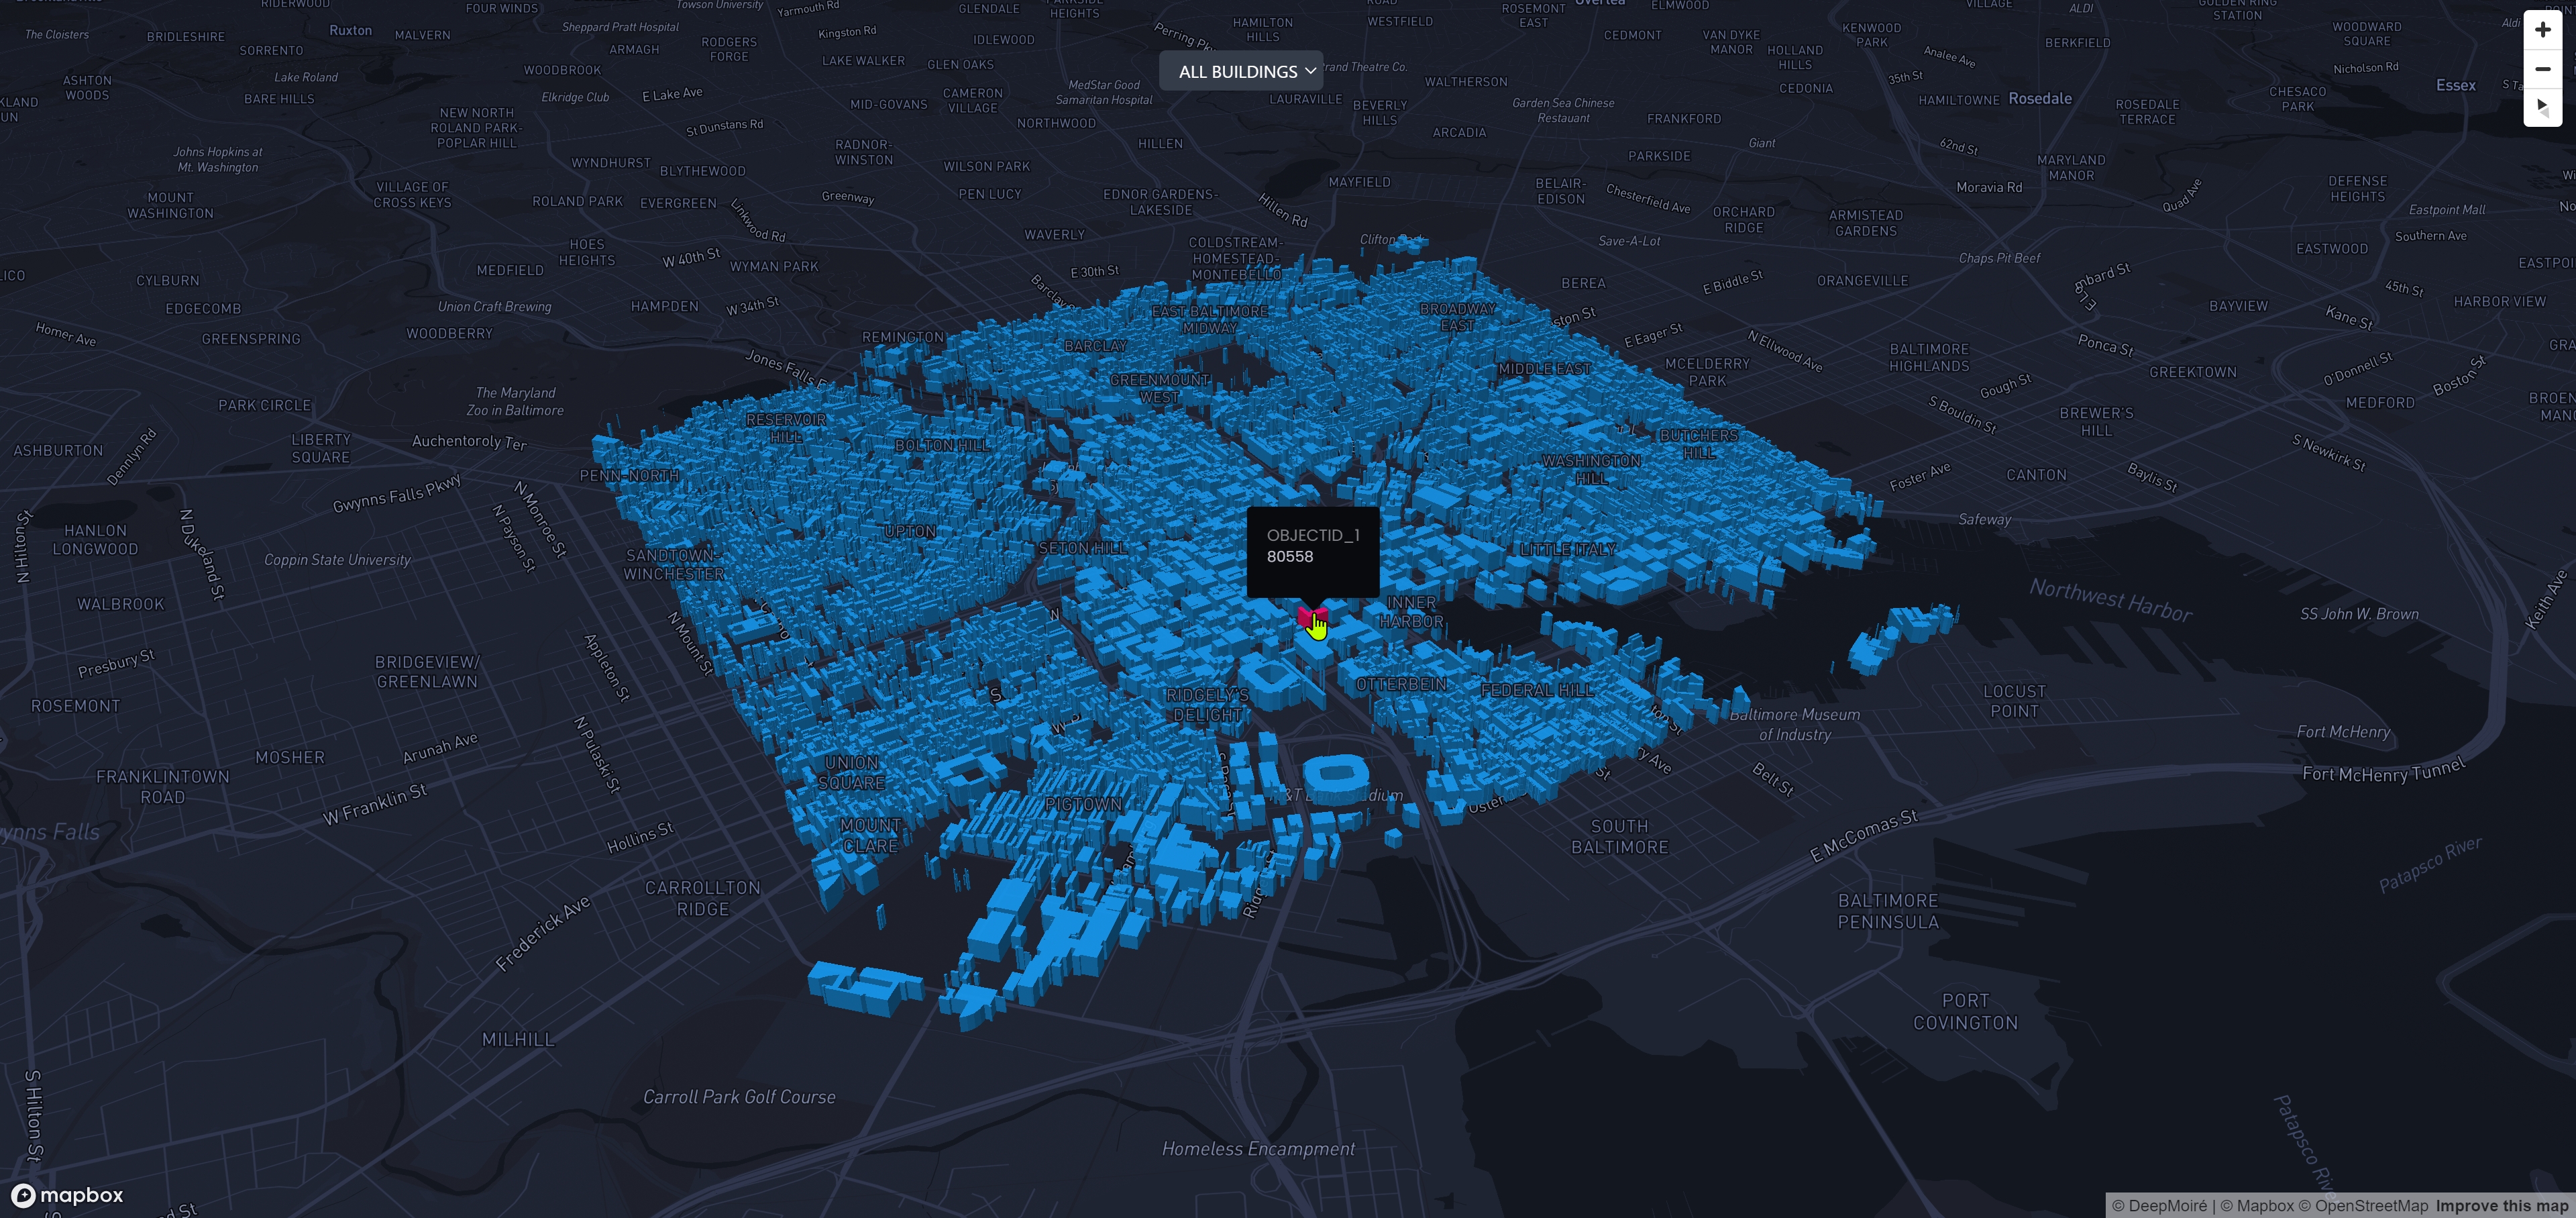
This project developed an integration-ready 3D mapping module for a commercial real estate SaaS platform. The goal was to move beyond point-based property maps and conventional stacking plans by linking real estate records to building footprints, color-coding properties by type, displaying land parcels, and visualizing available commercial space at floor level in an interactive Mapbox interface.
Challenge
The property database primarily identified real estate assets through coordinates and property records, while the requested 3D experience required accurate building-footprint geometry and floor-aware data. The solution therefore had to connect point-based property data with polygon footprints, combine separate property and availability datasets, and preserve the relationship between each building, its number of floors, and the commercial spaces available on specific levels.
Solution
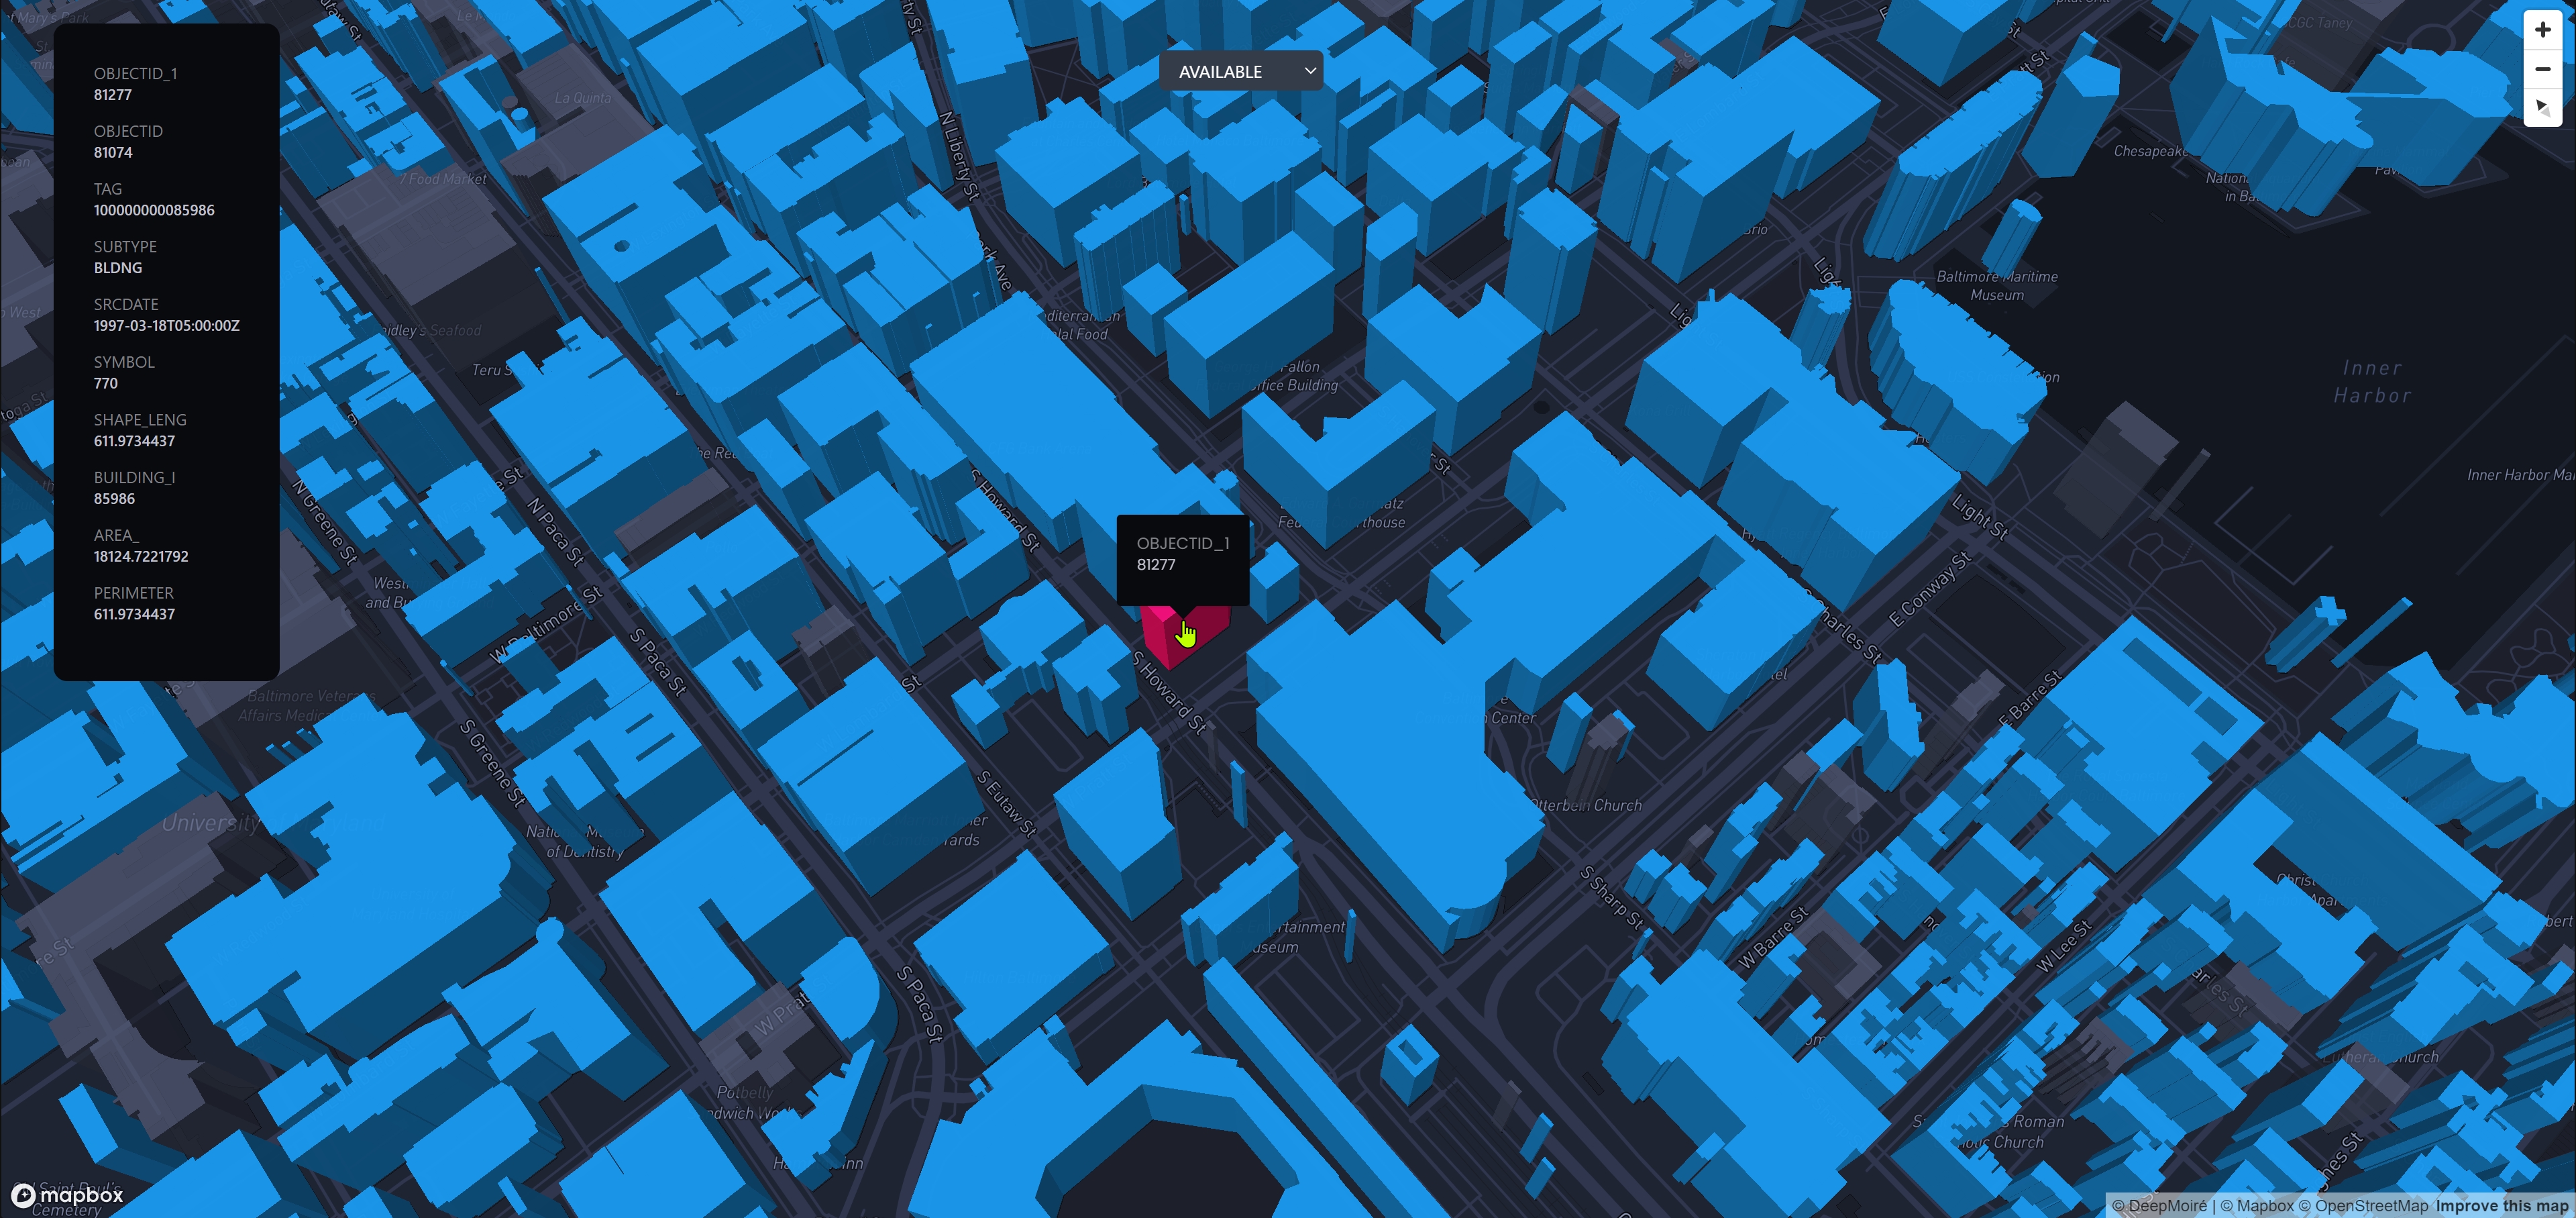
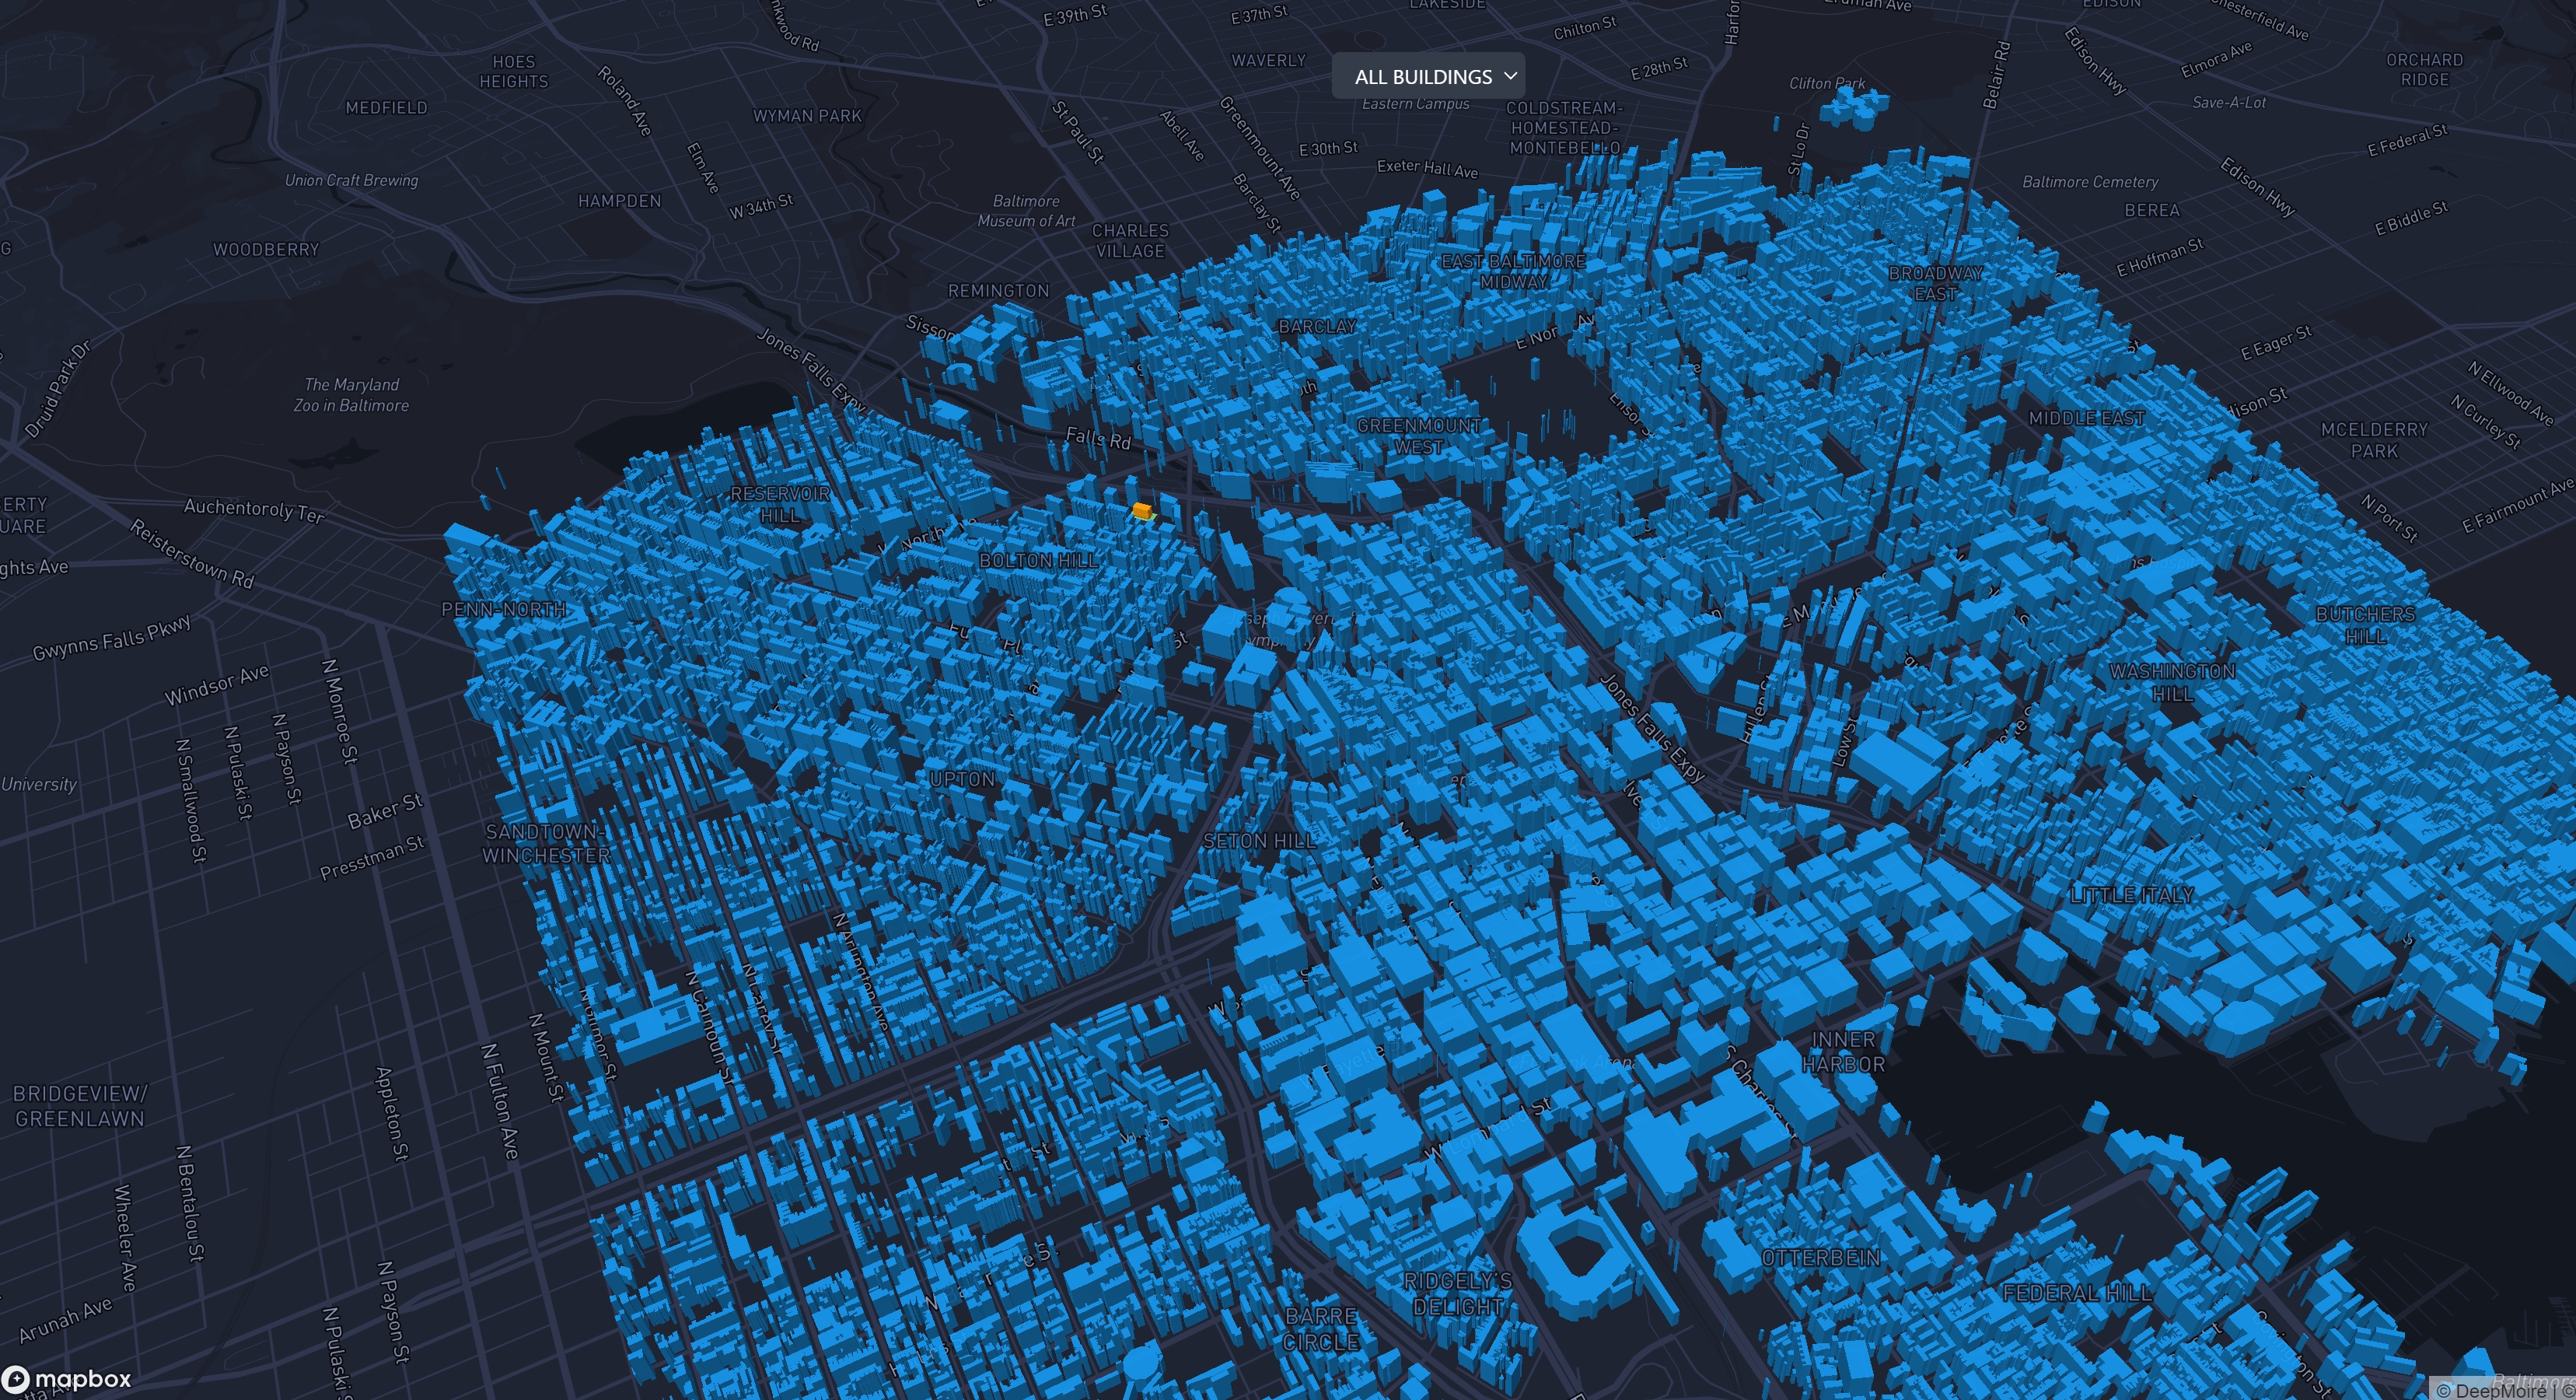
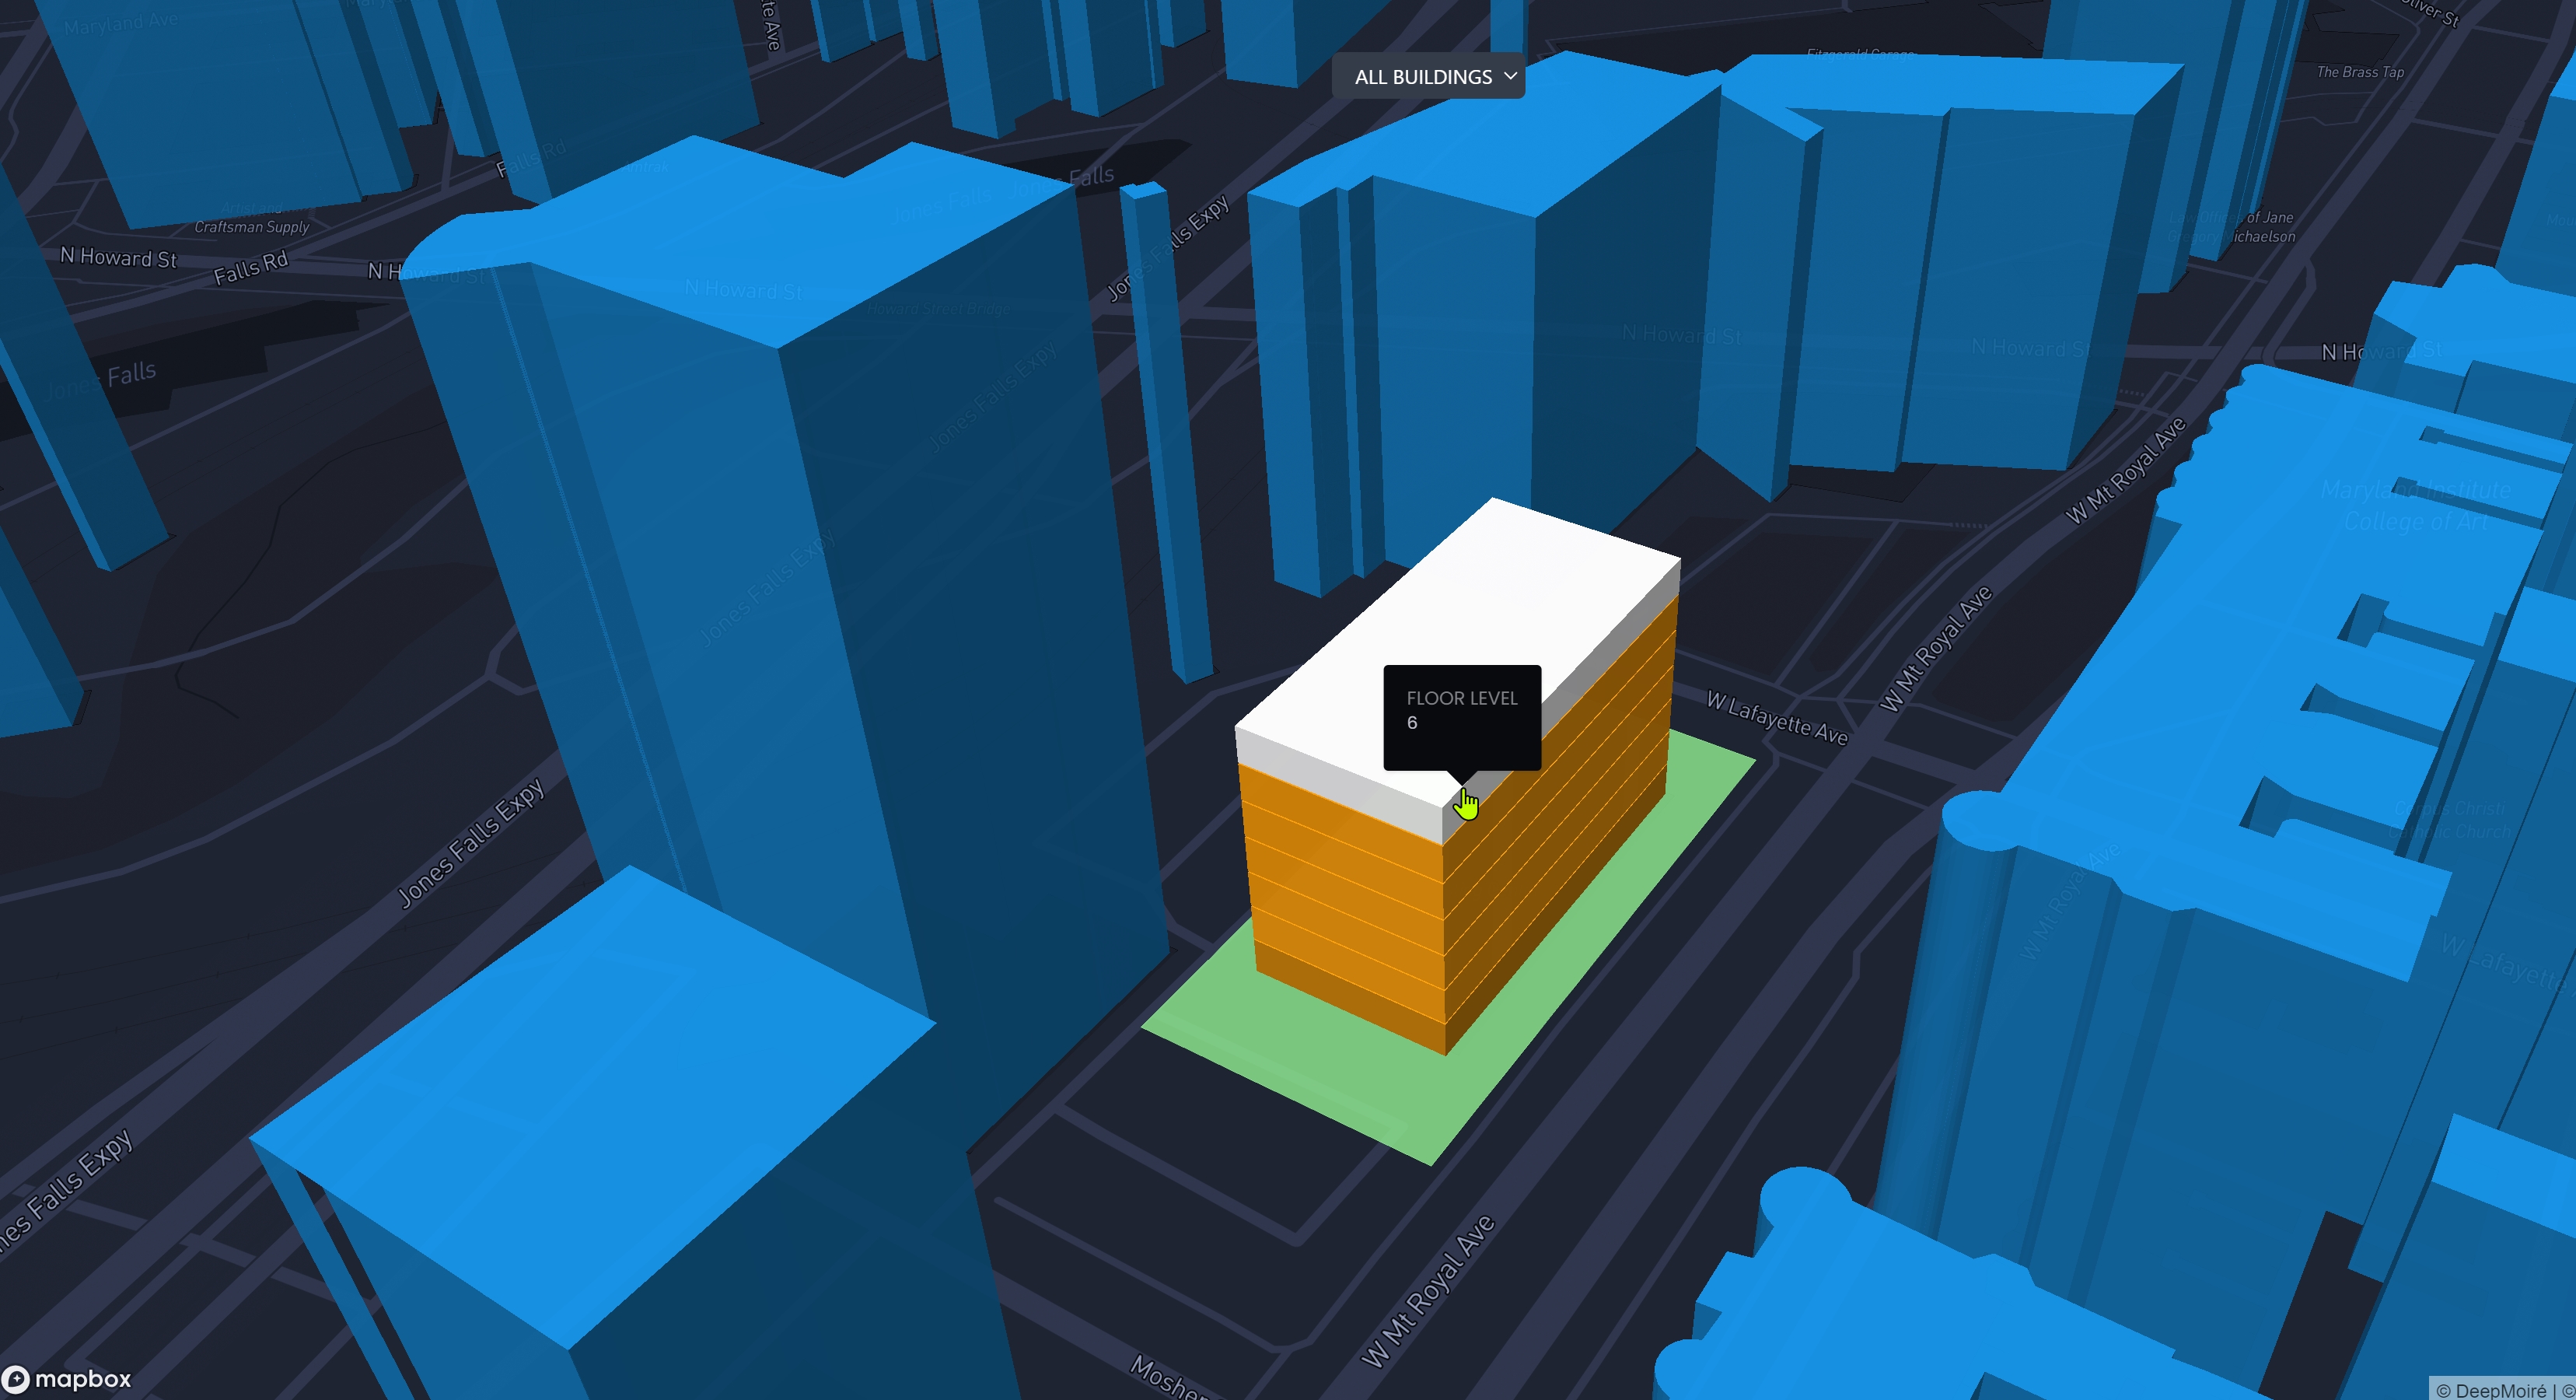
The delivered module provided a 2D/3D map toggle, 3D building extrusions, property-type color coding, and separate visualization for land parcels. At closer zoom levels, buildings with floor data were divided into stacked floor extrusions. Users could hover over individual floors to inspect the corresponding suite and availability information, including available and divisible space, clear height, lease rate and type, and availability dates.
Design & Data Visualization
The main visualization decision was to translate the logic of a traditional commercial real estate stacking plan into the geographic context of the map. Property categories were communicated through building color, land was visually separated from built assets, and floor-level detail appeared only at closer zoom levels. Individual floors used hover states and contextual popups so the map could move from portfolio-scale property exploration to building-scale availability inspection without requiring a separate diagram.
Technical Approach
Mapbox GL JS fill-extrusion layers were used for the 3D real estate visualization. Property records loaded from CSV were converted to GeoJSON, while Turf.js was used to calculate footprint centroids and associate property points with the nearest building geometry. Property attributes were then transferred to the matched footprints, with building height derived from the recorded number of floors. For floor-enabled properties, the script generated separate stacked polygon features with explicit extrusion bases and heights, allowing each level to carry interactive state and floor-specific availability information. D3.js handled loading of the CSV and GeoJSON data sources.
Technologies
- Mapbox GL JS
- JavaScript
- Turf.js
- D3.js
- GeoJSON
- CSV
- HTML/CSS
- jQuery
- csv2geojson
Data Workflow
The map combined separate property, availability, building-footprint, and land-parcel datasets. The property table controlled building-level attributes such as property type and floor count, while the availability table supplied suite and lease information associated with specific floors. The geospatial matching workflow connected point-based real estate records to building-footprint polygons inside the map script, producing an integration-ready dataset and visualization for the client engineering team.
Outcome
The completed code package gave the client an integration-ready method for visualizing commercial real estate inventory in 3D rather than only as map markers or conventional 2D stacking plans. It connected property records with actual building shapes, exposed floor-level availability in spatial context, and established a reusable workflow for bringing additional property and availability data into the mapping interface.